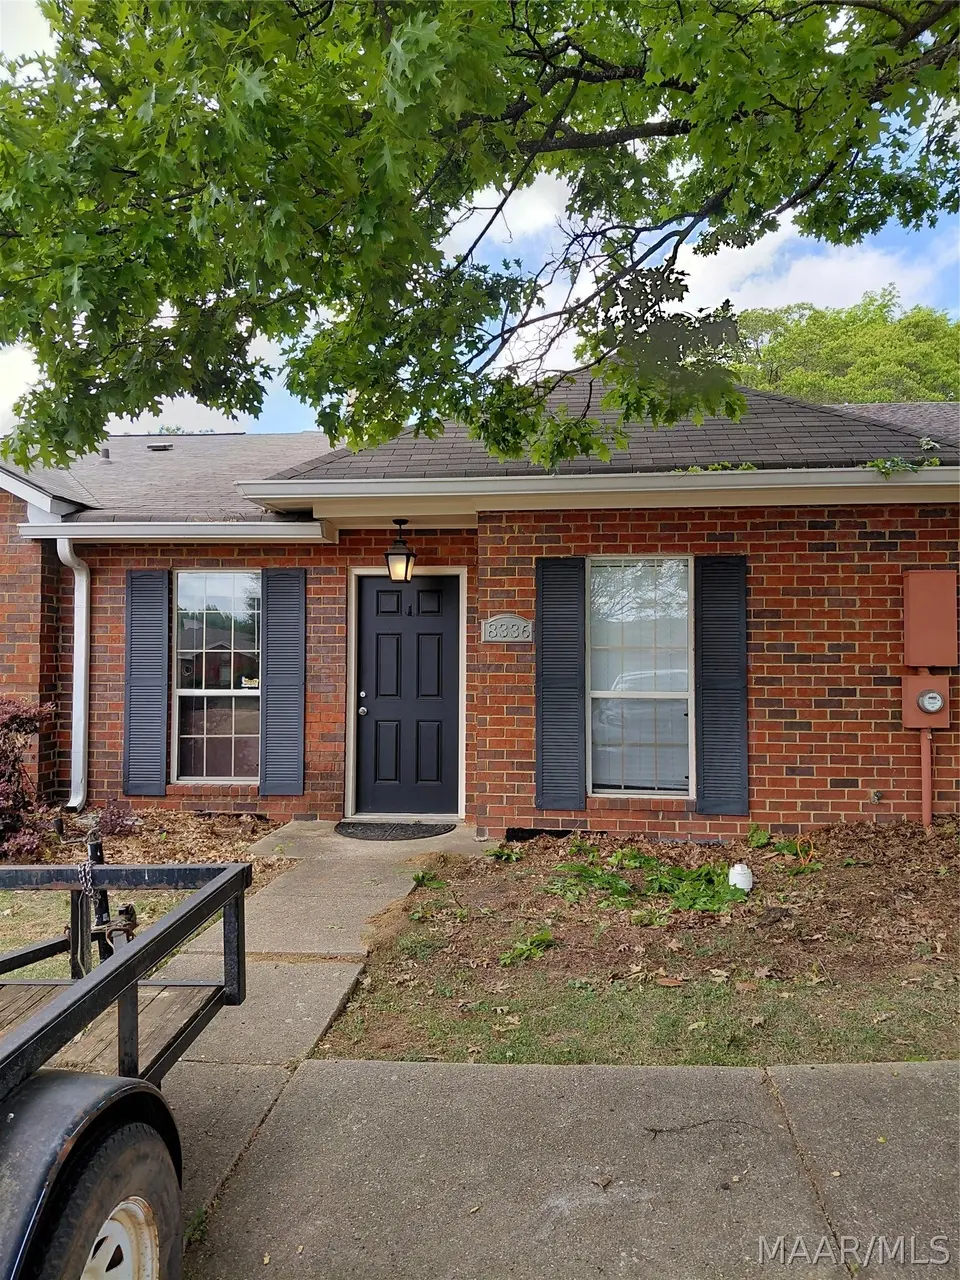
8336 Grand Oak Ct · Montgomery, AL
Flood risk 1/10 · Minimal
- FEMA flood zone
- X (unshaded)
- Chance of flooding over 30 yrs
- 0.0%
- Est. flood insurance / yr
- $507 – $1,088
Fire risk 3/10 · Minor
- Est. fire insurance / yr
- $916 – $1,700
Heat risk 8/10 · Major
- Hot days now (above 107°F)
- 7 days/yr
- Hot days in 30 yrs
- 21 days/yr
Wind risk 6/10 · Moderate
- Chance of severe wind over 30 yrs
- 77.0%
Air-quality risk 2/10 · Minimal
- Unhealthy air days now
- 1 days/yr
- Unhealthy air days in 30 yrs
- 3 days/yr
Risk factors via First Street. Map © Google.
Why this score? — see what drove the B+ grade
The composite is a weighted blend of 9 inputs, each scored 0–100. Each bar is that input's sub-score; the figure is the points it added to the 100-point composite (weight × sub-score).
- Cash flow +30.0/30.0
- ARV discount +15.0/15.0
- 1% rule +10.0/10.0
- DSCR +10.0/10.0
- Rent growth +3.2/5.0
- Livability +3.2/5.0
- Condition / age +2.5/5.0
- Schools +1.7/10.0
- Appreciation +0.0/10.0
$99,000
🖨 Deal sheet (PDF) 📄 Offer letter ✓ Due diligence
Listing remarks
Halcyon Oaks GEM!!! This cozy townhome is a steal. Just off Taylor Road, and conveniently located near Eastchase, surrounded by popular restaurants, and easy access to the interstate. Great Investment! Please contact agent for access to property. If school zones are important, please contact the Montgomery County Board of Education.
Key facts
- Cozy townhome
- Conveniently located
- Parking
Tags
Property features AI
Finance
- Other: City lot on a cul-de-sac
- HOA & community: Homeowners association with an annual fee of $88
Exterior
- Parking: Parking pad (2 pads); Shared driveway
- Security: Fire alarm
- Utilities: Cable available; Electricity available; High-speed internet available; Public water; Public sewer
- Home design: Single-story; Brick construction; Slab foundation; Home warranty included
- Construction: Built according to public records; Brick exterior
- Exterior features: Fully fenced yard; Privacy fencing; Patio; Storage
Interior
- Kitchen: Dishwasher; Electric cooktop; Electric oven; Disposal; Plumbed for ice maker; Refrigerator; Electric water heater
- Bedrooms: Bedroom on the first floor
- Flooring: Plank; Tile; Vinyl
- Bathrooms: 2 full bathrooms; Bathroom(s) on the first floor
- Heating & cooling: Central heating (electric); Central air; Ceiling fan(s)
- Interior features: Blinds; Garden tub / Roman tub; Separate shower; Window treatments
- Laundry & utility: Washer hookup; Dryer hookup
Neighborhood map
What this means for you Summary
Snapshot
- This is a 2-bed/2.0-bath single-family listed at $99k.
Deal economics
- At list price, monthly cash flow is $618 ($7k/yr) — positive.
- The deal already cash-flows at list — no discount required.
- Meets the 1% rule at list price ($2k rent vs $99k).
- Cap rate 13.8% vs local median 6.0% in Montgomery — top-decile yield for the area; either an underpriced asset or a hidden risk that comps aren't pricing in. Stress-test before assuming the spread holds.
Location & tenants
- Location reads 65/100 on livability (#138 in AL) — a middle-class / working-renter tenant base. Strengths: cost of living A+, housing A+; Watch: schools C-, employment D, crime F.
- Montgomery County (urban): math 9% / reading 31% proficiency, ranked #106 of 129 in AL (top 82%) — low school quality limits family demand, transient renter base, plan for 1-2y turnover; 70% free/reduced lunch — lower-income household profile, screen leases tightly.
- Market conditions: Rents rising (+3.0%/yr); 407 active listings in the ZIP; 7 comparable units currently listed for rent nearby; rentals at typical pace (median 15d on market — plan ~3-4 weeks tenant-placement turnaround); 460 units permitted in Montgomery County in 2024 (37 in 5+ unit buildings).
Forward outlook
- Local home prices are declining (-3.0%/yr); year-one equity from $684 of loan paydown is wiped out by about $3k of value loss. Plan a longer hold.
- Montgomery County population projected to shrink 8% by 2050 — rents likely to lag national; underwrite the cash flow, not the appreciation.
- At projected returns (-3.0% appreciation + 3.0% rent growth), your $28k cash investment doubles in ~5 years — after that, you're playing with house money.
Negotiation context
- Only 7 days on market — expect competitive offers; lowballing is unlikely to land.
Risks & watch-outs
- Climate carrying-cost: major wind risk, 77% chance of damaging wind over 30y; extreme-heat days projected 7→21/yr by 2055 (HVAC capex compounding) — expect insurance premiums to compound above CPI over the hold.
Questions for the listing agent
- What does the HOA fee cover, when was the last increase, and are there any pending special assessments or reserve-fund shortfalls?
- Is there a deadline driving the sale (1031 exchange, divorce, estate, relocation)? That informs how much negotiation room exists.
- Crime grade is F in this area — have there been break-ins, vandalism, or insurance claims at this property in the last 3 years? What carrier currently insures it and at what premium?
- What's the average days-on-market for RENTAL listings here right now (not sales)? A rising rental-DOM trend means longer vacancies and softer asking-rent achievability than the comps imply.
- What's the recent tenant-quality profile in this submarket — average credit score on applications, eviction rate, late-payment / NSF rate, and stable-employment percentage? A property-management company in the area should have these aggregated.
- How much new for-sale + rental construction is in the pipeline within 1–3 miles? Heavy new supply typically softens prices + rents 12–24 months out; constrained supply supports both.
Investment metrics
- 1% rule
- 1.65% ✓
- Cap rate
- 13.79%
- Cash-on-cash
- 26.76%
- DSCR
- 2.19
- GRM
- 5.0
CMA / ARV
- ARV (on-the-fly)
- $193,104
- Comps found
- 12
Show comp detail 12 sales within ~0.75 mi
| Address | Dist | Beds/Ba | Sqft | Sold | Price | $/sf | Match |
|---|---|---|---|---|---|---|---|
| 8325 Grand Oak Ct | 0.05mi | 2/2.0 | 1,254 (-3%) | 10mo | $139,200 | $111 | 84 |
| 8449 Water Oak Ct | 0.10mi | 2/2.0 | 1,237 (-5%) | 7mo | $195,000 | $158 | 82 |
| 8365 Grand Oak Ct | 0.06mi | 2/2.0 | 1,301 (+0%) | 18mo | $155,000 | $119 | 82 |
| 8405 English Oak Loop | 0.06mi | 3/2.0 (+1) | 1,264 (-2%) | 16mo | $180,000 | $142 | 75 |
| 7301 Spencer Cir | 0.56mi | 3/2.0 (+1) | 1,281 (-1%) | 3mo | $253,000 | $198 | 64 |
| 8461 English Oak Loop | 0.16mi | 3/2.0 (+1) | 1,387 (+7%) | 17mo | $170,000 | $123 | 62 |
| 7309 Spencer Cir | 0.55mi | 3/2.0 (+1) | 1,281 (-1%) | 11mo | $268,900 | $210 | 59 |
| 2627 Queens Hollow Ct | 0.67mi | 2/2.0 | 1,388 (+7%) | 12mo | $197,000 | $142 | 46 |
| 2108 Halcyon Downs Loop | 0.51mi | 3/2.0 (+1) | 1,476 (+14%) | 10mo | $220,000 | $149 | 40 |
| 3140 Knotts Dr | 0.62mi | 3/2.0 (+1) | 1,486 (+15%) | 3mo | $279,900 | $188 | 39 |
| 3204 Knotts Dr | 0.61mi | 3/2.0 (+1) | 1,486 (+15%) | 7mo | $294,900 | $198 | 36 |
| 2428 Noble Wood Ct | 0.66mi | 3/2.0 (+1) | 1,400 (+8%) | 18mo | $179,000 | $128 | 36 |
Match score weights: distance 35% · size 25% · config 20% · recency 20%. Top-matched comps best support the ARV.
Projected returns pro-forma
-3.0% appreciation · 2.99% rent growth · sell at horizon
- IRR
- 20.6%
- Equity multiple
- 1.84×
- Total profit
- $23,336
- Equity at exit
- $14,761
- IRR
- 28.8%
- Equity multiple
- 3.56×
- Total profit
- $71,034
- Equity at exit
- $8,560
Cash invested: $27,720 (down + closing). Projections, not guarantees.
Landlord ↔ Tenant lean methodology
- Overall (STATE)
- 90 Strongly Landlord-Friendly
- State Alabama
- 90 Strongly Landlord-Friendly · R+15
- County
- — inherits STATE
- City
- — inherits STATE
ZIP-level market 36117
- Home prices YoY
- -20.0%
- Rents YoY
- 3.0%
- Active inventory
- 407
- Price-to-rent
- 5.0×
Monthly cashflow live
- Estimated rent
- $1,638 high interval (Pro) →
- Mortgage (P&I)
- −$519
- Tax from tax record
- −$108 /mo · $1,301/yr
- Insurance
- −$41
- HOA
- −$7
- Vacancy / Maint / Mgmt
- −$344
- Net cashflow
- $618
Break-even live
Sensitivity live
| Price | -10% $674 | -5% $646 | +0% $618 | +5% $590 | +10% $562 |
|---|---|---|---|---|---|
| Rent | -10% $489 | -5% $554 | +0% $618 | +5% $683 | +10% $748 |
| Rate | -1.0pp $668 | -0.5pp $643 | base $618 | +0.5pp $593 | +1.0pp $566 |
UW: 25.0% down · 7.5% · 30yr · 1.5% tax · 5.0% vac · 8.0% maint · 8.0% mgmt
Financing live
Cash to close
- Down payment
- $24,750
- Closing costs
- $2,970
- Reserves months
- —
- Total cash needed
- —
Loan-product check · same deal, 3 products live
Conventional
25% down · 7.5% · 30yr
- Down + closing
- —
- Monthly P&I
- —
- Monthly cashflow
- —
- DSCR
- —
- Eligible?
- —
Personal DTI + credit; lowest rate.
DSCR
20% down · 8.5% · 30yr
- Down + closing
- —
- Monthly P&I
- —
- Monthly cashflow
- —
- DSCR
- —
- Eligible?
- —
No personal income docs; deal must DSCR.
Hard money
10% down · 12.0% · 12mo
- Down + closing
- —
- Monthly P&I
- —
- Monthly cashflow
- —
- DSCR
- —
- Eligible?
- —
Short-term bridge; refi at stabilization.
Rent comps 7 comps
| Address | Beds | Baths | Sqft | Rent | $/sqft | DOM | Units | Dist |
|---|---|---|---|---|---|---|---|---|
| 7406 Mill Ridge Ct Montgomery, AL | 3.0 | 2.0 | 1785 | $2,250 | $1.26 | 45d | 1 | 0.51mi |
| 2229 Halcyon Downs Loop Unit 1525028P Montgomery, AL | 3.0 | 2.0 | 1571 | $5,675 | $3.61 | 14d | 1 | 0.60mi |
| 8700 Seaton Blvd Montgomery, AL | 1.0–3.0 | 1.0–2.0 | 1081 | $1,532 | $1.42 | 14d | 35 | 0.60mi |
| 7104 Fair Oaks Ct Montgomery, AL | 3.0 | 2.0 | 1656 | $1,881 | $1.14 | 44d | 1 | 0.71mi |
| 3201 Watchman Dr Montgomery, AL | 1.0–3.0 | 1.0–2.0 | 1054 | $1,345 | $1.28 | 14d | 10 | 0.80mi |
| 7701 Taylor Oaks Cir Montgomery, AL | 1.0–3.0 | 1.0–2.0 | 1047 | $1,574 | $1.50 | 14d | 22 | 1.19mi |
| 1944 Woodrun Dr Montgomery, AL | 3.0 | 2.0 | 1689 | $1,595 | $0.94 | 14d | 1 | 1.37mi |
HOA detail
- Monthly dues
- $7 · $84/yr
Listing history 1 events
-
2026-05-22$99,000 Active
ⓘ Source: listings_history table (triggers on properties + properties_extension) + one-shot
backfill from property_details.listing_events for pre-trigger history.
Tax reassessment forecast AL · Resets to sale price
- Current annual tax
- $1,301 · $108/mo
- Projected year-2 tax
- $1,301 · $108/mo
- Expected delta
- $0/yr ($0/mo · 0.0%)
ⓘ Screening estimate from a state-policy table — verify with the county assessor before closing.
Climate risk First Street
- Flood 1/10 Low FEMA zone X (unshaded) · 0% chance over 30 yrs
- Wildfire 3/10 Moderate
- Heat 8/10 Severe 7 d/yr ≥107°F today · 21 d/yr by 30 yrs out
- Wind 6/10 Major 77% chance of damaging wind over 30 yrs
- Air quality 2/10 Low 1 unhealthy d/yr today · 3 by 30 yrs out
Nearby sold comps map
Loading sold comps map…
Walkable amenities ~0.75 mi
Loading nearby amenities…
Taxation est. · year 1
- Rental income
- $19,656
- − Mortgage interest
- −$5,546
- − Property taxes
- −$1,301
- − Insurance
- −$495
- − Repairs & maintenance
- −$1,572
- − Management
- −$1,572
- − HOA
- −$84
- − Depreciation
- −$2,880
- Taxable income
- $6,206
- Est. tax owed @ 24.0%
- −$1,489
- After-tax cash flow
- $5,929/yr
For passive investors: Depreciation is non-cash, so a rental often shows a tax loss while cash-flowing — sheltering income. Rental losses are passive: they offset passive income freely, and up to $25,000/yr can offset ordinary (W-2) income if you actively participate and your MAGI is under $100k (phasing out to $0 by $150k); unused losses carry forward. On sale, claimed depreciation is recaptured at up to 25%, and gains may owe capital-gains tax (a 1031 exchange can defer both). Figures are a year-1 estimate at your 24.0% rate — not tax advice; consult a CPA.
Schools (NCES district)
- District
- Montgomery County
- NCES district ID
- 0102430
- Math proficiency
- 9% ▼ -21.00%
- Reading proficiency
- 31% ▼ -1.00%
- Median HH income
- $43,902
- Composite
- 17.24/100
- National rank
- #9093
- State rank
- #106 of 129 in AL
Livability — Montgomery
- Score
- 65/100
- State rank
- #138
- US rank
- #13416
Category grades
Schools grade is shown separately in the Schools card above.
Census & demographics
- Census place
- Montgomery, AL
- County
- Montgomery County · 190,016 people
- City population
- 175,913
- Metro
- Montgomery, AL
- Population (ZIP)
- 53,172
- Household income
- $74,720
- Rent vs Own
- Severe rent burden
- 1742.0
Population outlook (Montgomery County) Hauer SSP2
- Today (2025)
- 224,008 people
- By 2030
- 221,460 · -1.1%
- By 2040
- 214,179 · -4.4%
- By 2050
- 204,912 · -8.5%
- By 2075
- 177,821 · -20.6%
- By 2100
- 145,134 · -35.2%
Race, ethnicity, and origin ACS 2023
- Neighborhood character
- Diverse neighborhood (Simpson 0.60)
- Race & ethnicity
- Black 53% White 34% Asian 8% Two or more races 3% Hispanic / Latino 3%
- Common ancestry
- Italian 1% Slovak 1% Lithuanian 1%
- Foreign-born
- 9% · South Korea, Canada, China
- Languages at home
- 90% English-only · Korean 4% Spanish 3% Other Indo-European 1%
Political lean MEDSL · Montgomery
- 2024 margin
- Solid D (+30.7) · D 64.8% · R 34.1% · Other 1.1%
- 2008→2024 swing
- +11.5pp toward D · 2008: 19.2pp · 2024: 30.7pp
- All cycles
- 2024: D+30.7 2020: D+31.5 2016: D+26.2 2012: D+24.3 2008: D+19.2
Not yet ingested
- Civics
- —
Market trends
- HPI YoY
- ▼ -37.24%
- Current HPI
- 148.7728
- Rent YoY
- ▲ 2.99%
- Metro
- Montgomery, AL
- State GDP YoY
- ▲ 2.94%
- F500 in state
- 4
Industry mix (Fortune 500 HQ in AL)
| Industry | F500 HQs | Revenue |
|---|---|---|
| Financial Services | 1 | $8B |
|
||
| Healthcare | 1 | $5B |
|
||
Price history
1 event — show timeline
- 2026-05-22 Listed $99,000 MAAR
Property tax history
+6.2%/yrLatest (2025): $1,301 · +3.8% YoY. Source: county tax records.
Cash-flow waterfall
monthlySold comps — $/sqft
last 12 mo · ≤1 miLoading sold comps…