 Fourplex
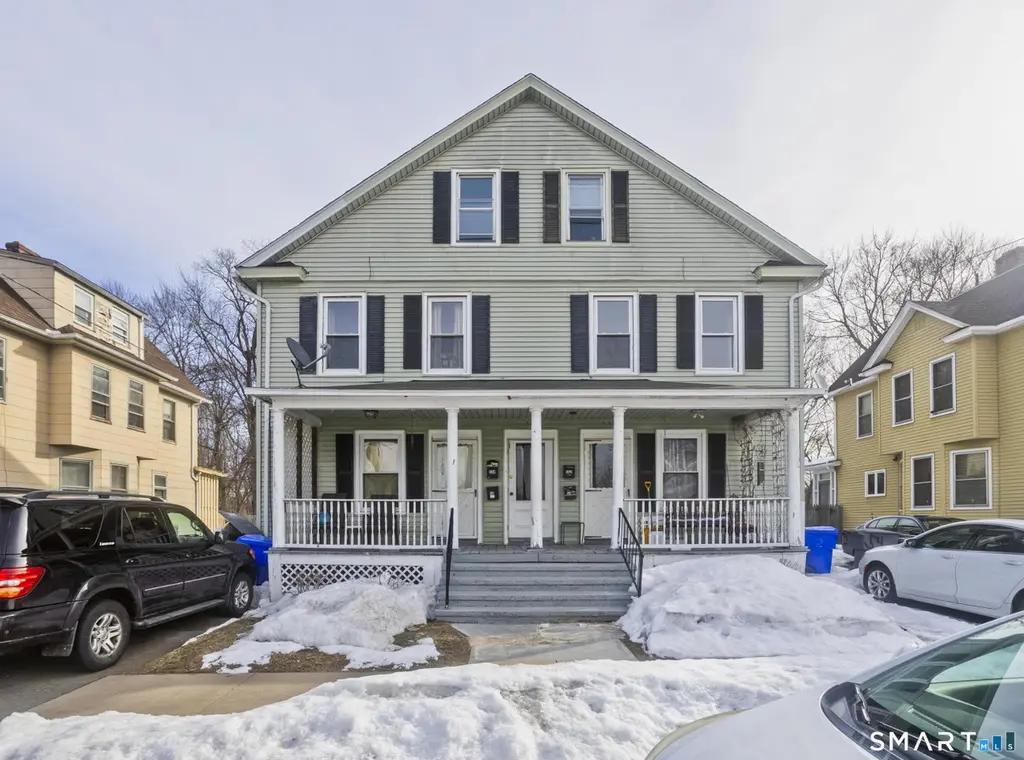
54 Hartford Ave · Thompsonville, CT
Flood risk 1/10 · Minimal
- FEMA flood zone
- X (unshaded)
- Chance of flooding over 30 yrs
- 0.0%
- Est. flood insurance / yr
- $473 – $860
Fire risk 2/10 · Minimal
- Est. fire insurance / yr
- $829 – $1,539
Heat risk 4/10 · Minor
- Hot days now (above 98°F)
- 7 days/yr
- Hot days in 30 yrs
- 15 days/yr
Wind risk 6/10 · Moderate
- Chance of severe wind over 30 yrs
- 27.0%
Air-quality risk 3/10 · Minor
- Unhealthy air days now
- 2 days/yr
- Unhealthy air days in 30 yrs
- 3 days/yr
Risk factors via First Street. Map © Google.
Why this score? — see what drove the C+ grade
The composite is a weighted blend of 9 inputs, each scored 0–100. Each bar is that input's sub-score; the figure is the points it added to the 100-point composite (weight × sub-score).
- Cash flow +30.0/30.0
- 1% rule +10.0/10.0
- DSCR +10.0/10.0
- Rent growth +3.5/5.0
- Livability +3.5/5.0
- Schools +3.0/10.0
- Condition / age +2.5/5.0
- ARV discount +1.5/15.0
- Appreciation +0.0/10.0
$475,000
🖨 Deal sheet (PDF) 📄 Offer letter ✓ Due diligence
Multi-family units
County records classify this as Multi-Family (5+ Unit). Listing-text estimate: 4 units. estimate disagrees with records
5+ unit building — per-unit beds/baths from public records are typically unavailable; the breakdown below (if shown) is an estimate from the listing text.
Listing remarks MLS
Good condition, carefree siding, each unit with separate utilities. 24 Hour notice to show. Better chance to show more apartments if scheduled after 4pm 7 daysa week.
Key facts
- Private yard area
- Near area amenities
- 9,147 sq ft lot
Tags
Property features AI
Exterior
- Parking: Paved off-street parking; 8 parking spaces
- Utilities: Public water connected; Public sewer connected; Fuel tank located in basement; Ridge vents and storm doors (energy features)
- Home design: Multi-family property (4-family)
- Construction: Frame construction; Brick foundation; Asphalt shingle roof; Vinyl siding; Sage exterior color
- Exterior features: Underground utilities; Sidewalk; Deck and covered deck; Gutters; Garden area; Exterior lighting
Interior
- Bedrooms: 6 total bedrooms
- Bathrooms: 4 full bathrooms
- Heating & cooling: Hot water heating; Hot water from natural gas with 40-gallon tank; Heat fuel includes electric and oil
- Interior features: Full basement; 18 total rooms; Multi-family with 4 units
- Laundry & utility: Basement laundry hook-ups; In-unit laundry hook-ups in Unit 2 and Unit 3
Neighborhood map
What this means for you Summary
Snapshot
- This is a 4 × 6-bed/4.0-bath units multifamily listed at $475k.
Deal economics
- At list price, monthly cash flow is $5k ($58k/yr) — positive. Per door: $1k/mo.
- The deal already cash-flows at list — no discount required.
- Meets the 1% rule at list price ($10k rent vs $475k).
- Recommended offer: $468k (1.5% below list) — sets the bar for market timing.
- Cap rate 18.4% vs local median 5.2% in Thompsonville — top-decile yield for the area; either an underpriced asset or a hidden risk that comps aren't pricing in. Stress-test before assuming the spread holds.
Location & tenants
- Location reads 69/100 on livability (#103 in CT) — a middle-class / working-renter tenant base. Strengths: health & safety A+, housing A, crime B+; Watch: amenities F, commute F, employment D-.
- Enfield School District (suburban): math 25% / reading 41% proficiency, ranked #114 of 153 in CT (top 74%) — families likely to look elsewhere, expect single-tenant / working-renter base with shorter leases.
- Zoned schools: Henry Barnard School (365 students, 46% FRL); John F. Kennedy Middle School (math 22% / reading 39%, grade F, #138 of 175 statewide, top 79%, 1,096 students, 46% FRL); Enfield High School (math 29% / reading 54%, grade F, #102 of 194 statewide, top 53%, 1,490 students, 40% FRL) — zoned schools average 44% FRL vs 29% district-wide (15 pts higher); higher-poverty schools than district average — tighter screening recommended.
- Market conditions: Rents rising (+3.9%/yr); 188 active listings in the ZIP; solid renter incomes; 1,867 units permitted in Capitol Planning Region in 2024 (1,399 in 5+ unit buildings).
- At $10,178/mo this rent would consume 135% of the median local household income ($90k/yr) (locally 954% of renters already pay >50% of income on rent) — very limited rent-growth headroom before tenants either downsize or default.
Forward outlook
- Local home prices are declining (-3.0%/yr); year-one equity from $3k of loan paydown is wiped out by about $14k of value loss. Plan a longer hold.
- At projected returns (-3.0% appreciation + 3.9% rent growth), your $133k cash investment doubles in ~3 years — after that, you're playing with house money.
Negotiation context
- It's been on market 15 days — a 2% lower offer ($468k) is reasonable based on typical stale-listing flexibility.
- 3 sale attempts since 25y ago; this cycle's ask is 6% above the opening price — seller raised mid-cycle; expect resistance to lowballs.
- Current owner paid $130k; list at $475k implies a 266% gain — meaningful room to come down on a strong offer.
Risks & watch-outs
- Watch-outs: built in 1920 — expect roof / HVAC / electrical / plumbing capex.
- Climate carrying-cost: major wind risk, 27% chance of damaging wind over 30y — expect insurance premiums to compound above CPI over the hold.
Questions for the listing agent
- Can we see the unit-by-unit rent roll, current vacancy, and any below-market leases? What's the average tenancy length?
- What capital expenditures (roof, boiler, parking lot, exteriors) have been made in the last 5 years, and what's planned in the next 2?
- Built in 1920 — when were the roof, HVAC, electrical panel, plumbing, and water heater last replaced?
- Is there a deadline driving the sale (1031 exchange, divorce, estate, relocation)? That informs how much negotiation room exists.
- What's the average days-on-market for RENTAL listings here right now (not sales)? A rising rental-DOM trend means longer vacancies and softer asking-rent achievability than the comps imply.
- What's the recent tenant-quality profile in this submarket — average credit score on applications, eviction rate, late-payment / NSF rate, and stable-employment percentage? A property-management company in the area should have these aggregated.
- How much new apartment / multifamily construction is in the pipeline within 1–3 miles? Heavy new supply (>2% of stock underway) typically softens rents 12–24 months out; light construction supports rent growth.
Investment metrics
- 1% rule
- 2.14% ✓
- Cap rate
- 18.41%
- Cash-on-cash
- 43.29%
- DSCR
- 2.93
- GRM
- 3.9
CMA / ARV
- ARV (on-the-fly)
- $419,211
- Comps found
- 6
Show comp detail 6 sales within ~0.75 mi
| Address | Dist | Beds/Ba | Sqft | Sold | Price | $/sf | Match |
|---|---|---|---|---|---|---|---|
| 42-44 Hartford Ave | 0.03mi | 6/3.0 | 3,076 (-14%) | 3mo | $460,000 | $150 | 69 |
| 41 Windsor St | 0.18mi | 5/4.0 (-1) | 3,420 (-4%) | 19mo | $289,250 | $85 | 63 |
| 21 Hartford Ave | 0.09mi | 6/13.0 | 3,583 (0%) | 19mo | $212,000 | $59 | 60 |
| 61 Pleasant St | 0.28mi | 7/4.0 (+1) | 3,270 (-9%) | 19mo | $415,000 | $127 | 51 |
| 98 Church St | 0.20mi | 7/3.5 (+1) | 3,180 (-11%) | 19mo | $289,250 | $91 | 49 |
| 54 Prospect St | 0.68mi | 7/3.0 (+1) | 3,416 (-5%) | 5mo | $400,000 | $117 | 47 |
Match score weights: distance 35% · size 25% · config 20% · recency 20%. Top-matched comps best support the ARV.
Projected returns pro-forma
-3.0% appreciation · 3.9% rent growth · sell at horizon
- IRR
- 41.2%
- Equity multiple
- 2.79×
- Total profit
- $238,013
- Equity at exit
- $70,824
- IRR
- 47.8%
- Equity multiple
- 5.81×
- Total profit
- $640,098
- Equity at exit
- $41,069
Cash invested: $133,000 (down + closing). Projections, not guarantees.
Landlord ↔ Tenant lean methodology
- Overall (STATE)
- 27 Tenant-Leaning
- State Connecticut
- 27 Tenant-Leaning · D+7
- County
- — inherits STATE
- City
- — inherits STATE
ZIP-level market 06082
- Rents YoY
- 3.9%
- Active inventory
- 188
- Price-to-rent
- 15.6×
Monthly cashflow live
- Estimated rent
- $10,178 medium interval (Pro) →
- Mortgage (P&I)
- −$2,491
- Tax from tax record
- −$554 /mo · $6,651/yr
- Insurance
- −$198
- HOA
- −$0
- Vacancy / Maint / Mgmt
- −$2,137
- Net cashflow
- $4,798
Break-even live
Sensitivity live
| Price | -10% $5,066 | -5% $4,932 | +0% $4,798 | +5% $4,663 | +10% $4,529 |
|---|---|---|---|---|---|
| Rent | -10% $3,993 | -5% $4,395 | +0% $4,798 | +5% $5,200 | +10% $5,602 |
| Rate | -1.0pp $5,037 | -0.5pp $4,918 | base $4,798 | +0.5pp $4,674 | +1.0pp $4,549 |
4-unit breakdown (identical units grouped — click to expand)
| Units | Beds | Baths | Est. rent |
|---|---|---|---|
| 4× units | 6 | 4 | $10,180 |
| #1 | 6 | 4 | $2,545 |
| #2 | 6 | 4 | $2,545 |
| #3 | 6 | 4 | $2,545 |
| #4 | 6 | 4 | $2,545 |
| Total (4 units) | $10,178 | ||
UW: 25.0% down · 7.5% · 30yr · 1.5% tax · 5.0% vac · 8.0% maint · 8.0% mgmt
Financing live
Cash to close
- Down payment
- $118,750
- Closing costs
- $14,250
- Reserves months
- —
- Total cash needed
- —
Loan-product check · same deal, 3 products live
Conventional
25% down · 7.5% · 30yr
- Down + closing
- —
- Monthly P&I
- —
- Monthly cashflow
- —
- DSCR
- —
- Eligible?
- —
Personal DTI + credit; lowest rate.
DSCR
20% down · 8.5% · 30yr
- Down + closing
- —
- Monthly P&I
- —
- Monthly cashflow
- —
- DSCR
- —
- Eligible?
- —
No personal income docs; deal must DSCR.
Hard money
10% down · 12.0% · 12mo
- Down + closing
- —
- Monthly P&I
- —
- Monthly cashflow
- —
- DSCR
- —
- Eligible?
- —
Short-term bridge; refi at stabilization.
Listing history 8 events
-
2026-05-20status Active
-
2026-05-20price $475,000
-
2026-03-13status Under Contract
-
2026-03-04$450,000 Active
-
2001-09-07soldstatus $129,900
-
2001-09-05soldstatus $129,900 166-char remark
Show marketing remark (166 chars)
Good condition, carefree siding, each unit with separate utilities. 24 Hour notice to show. Better chance to show more apartments if scheduled after 4pm 7 daysa week.
-
2001-04-13$129,900 166-char remark
Show marketing remark (166 chars)
Good condition, carefree siding, each unit with separate utilities. 24 Hour notice to show. Better chance to show more apartments if scheduled after 4pm 7 daysa week.
-
1992-07-28soldstatus $180,000
ⓘ Source: listings_history table (triggers on properties + properties_extension) + one-shot
backfill from property_details.listing_events for pre-trigger history.
Tax reassessment forecast CT · Partial reset (capped growth)
- Current annual tax
- $6,651 · $554/mo
- Projected year-2 tax
- $8,408 · $701/mo
- Expected delta
- +$1,757/yr (+$146/mo · 26.4%)
ⓘ Screening estimate from a state-policy table — verify with the county assessor before closing.
Climate risk First Street
- Flood 1/10 Low FEMA zone X (unshaded) · 0% chance over 30 yrs
- Wildfire 2/10 Low
- Heat 4/10 Moderate 7 d/yr ≥98°F today · 15 d/yr by 30 yrs out
- Wind 6/10 Major 27% chance of damaging wind over 30 yrs
- Air quality 3/10 Moderate 2 unhealthy d/yr today · 3 by 30 yrs out
Nearby sold comps map
Loading sold comps map…
Walkable amenities ~0.75 mi
Loading nearby amenities…
Taxation est. · year 1
- Rental income
- $122,136
- − Mortgage interest
- −$26,607
- − Property taxes
- −$6,651
- − Insurance
- −$2,375
- − Repairs & maintenance
- −$9,771
- − Management
- −$9,771
- − Depreciation
- −$13,818
- Taxable income
- $53,143
- Est. tax owed @ 24.0%
- −$12,754
- After-tax cash flow
- $44,816/yr
For passive investors: Depreciation is non-cash, so a rental often shows a tax loss while cash-flowing — sheltering income. Rental losses are passive: they offset passive income freely, and up to $25,000/yr can offset ordinary (W-2) income if you actively participate and your MAGI is under $100k (phasing out to $0 by $150k); unused losses carry forward. On sale, claimed depreciation is recaptured at up to 25%, and gains may owe capital-gains tax (a 1031 exchange can defer both). Figures are a year-1 estimate at your 24.0% rate — not tax advice; consult a CPA.
Schools (NCES district)
- District
- Enfield School District
- NCES district ID
- 0901470
- Math proficiency
- 25% ▼ -14.00%
- Reading proficiency
- 41% ▼ -10.00%
- Median HH income
- $68,750
- Composite
- 30.42/100
- National rank
- #6238
- State rank
- #114 of 153 in CT
Livability — Thompsonville
- Score
- 69/100
- State rank
- #103
- US rank
- #8941
Category grades
Schools grade is shown separately in the Schools card above.
Census & demographics
- Census place
- Thompsonville, CT
- County
- Hartford County · 754,208 people
- Metro
- Hartford-East Hartford-Middletown, CT
- Population (ZIP)
- 41,090
- Household income
- $90,404
- Rent vs Own
- Severe rent burden
- 954.0
Population outlook (Capitol County) Hauer SSP2
- By 2040
- 1,063,519
Race, ethnicity, and origin ACS 2023
- Neighborhood character
- Predominantly White (76%)
- Race & ethnicity
- White 76% Hispanic / Latino 11% Two or more races 9% Black 5% Asian 2%
- Hispanic origin (detail)
- Mexican 1% Puerto Rican 7%
- Common ancestry
- Romanian 10% Lithuanian 9% Slovak 2%
- Foreign-born
- 6% · Canada, Jamaica
- Languages at home
- 89% English-only · Spanish 5% Other Indo-European 2% Russian/Polish/Slavic 1%
Political lean MEDSL · Capitol
- 2024 margin
- Strong D (+21.9) · D 60.1% · R 38.2% · Other 1.7%
- All cycles
- 2024: D+21.9
Not yet ingested
- Civics
- —
Market trends
- HPI YoY
- ▼ -494.72%
- Current HPI
- 192.4011
- Rent YoY
- ▲ 3.90%
- Metro
- Hartford-East Hartford-Middletown, CT
- State GDP YoY
- ▲ 1.06%
- F500 in state
- 38
Industry mix (Fortune 500 HQ in CT)
| Industry | F500 HQs | Revenue |
|---|---|---|
| Industrial Machinery | 4 | $38B |
|
||
| Insurance | 3 | $71B |
|
||
| Financial Services | 2 | $25B |
|
||
| Transportation / Logistics | 2 | $18B |
|
||
| Healthcare | 1 | $247B |
|
||
| Telecommunications | 1 | $55B |
|
||
Price history
+163.9% since first listed8 events — show timeline
- 2026-05-20 Price Changed $475,000 Smart MLS
- 2026-05-20 Relisted — Smart MLS
- 2026-03-13 Pending — Smart MLS
- 2026-03-04 Listed $450,000 Smart MLS
- 2001-09-07 Sold (Public Records) $129,900 Public Records
- 2001-09-05 Sold (MLS) $129,900 Smart MLS
- 2001-04-13 Listed $129,900 Smart MLS
- 1992-07-28 Sold (Public Records) $180,000 Public Records
Property tax history
+2.4%/yrLatest (2025): $6,651 · +2.8% YoY. Source: county tax records.
Cash-flow waterfall
monthlySold comps — $/sqft
last 12 mo · ≤1 miLoading sold comps…