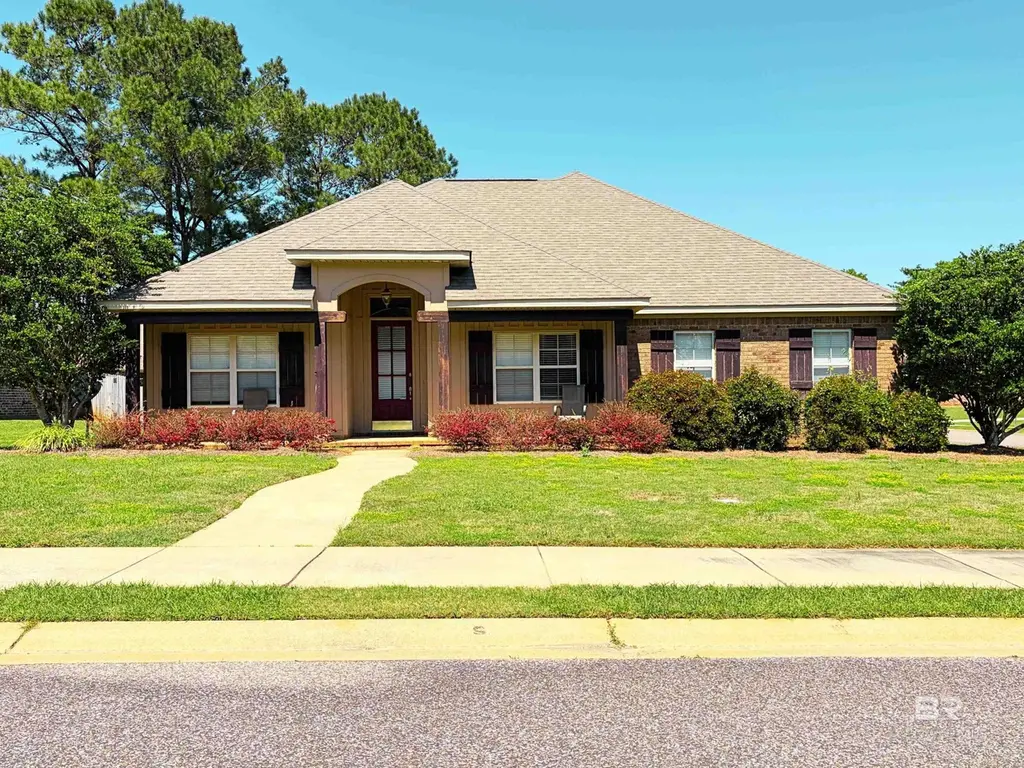
20777 Southwood St · Fairhope, AL
Flood risk 1/10 · Minimal
- FEMA flood zone
- X (unshaded)
- Chance of flooding over 30 yrs
- 0.0%
- Est. flood insurance / yr
- $507 – $1,088
Fire risk 4/10 · Minor
- Est. fire insurance / yr
- $916 – $1,700
Heat risk 10/10 · Severe
- Hot days now (above 106°F)
- 7 days/yr
- Hot days in 30 yrs
- 23 days/yr
Wind risk 9/10 · Severe
- Chance of severe wind over 30 yrs
- 99.0%
Air-quality risk 4/10 · Minor
- Unhealthy air days now
- 3 days/yr
- Unhealthy air days in 30 yrs
- 5 days/yr
Risk factors via First Street. Map © Google.
Why this score? — see what drove the D grade
The composite is a weighted blend of 9 inputs, each scored 0–100. Each bar is that input's sub-score; the figure is the points it added to the 100-point composite (weight × sub-score).
- Cash flow +11.0/30.0
- ARV discount +10.5/15.0
- Schools +3.9/10.0
- Livability +3.8/5.0
- DSCR +3.2/10.0
- Rent growth +3.2/5.0
- Condition / age +2.5/5.0
- 1% rule +2.0/10.0
- Appreciation +0.0/10.0
$349,000
🖨 Deal sheet (PDF) 📄 Offer letter ✓ Due diligence
Listing remarks
Welcome to this move-in ready home in Fairhope River Station community! Easy to show. This 4 bedroom, 3 full bath home offers the perfect blend of comfort, style, and functionality. Step inside to an open floor plan filled with abundant natural light, enhanced by blinds and transom windows. The foyer entrance welcomes you with elegant crown molding, while the spacious living area features high ceilings, additional crown molding, and a cozy gas fireplace that creates a warm and inviting atmosphere for everyday living and entertaining. The kitchen is thoughtfully designed with granite countertops, stainless steel appliances, ample cabinetry, crown molding, a separate pantry, and a charming br
Key facts
- Open floor plan
- Transom windows
- Plantation shutters
Tags
Property features AI
Finance
- Other: Mineral rights: unknown
- HOA & community: Annual association fee of $275; includes cable TV and grounds maintenance; No community amenities listed
Exterior
- Parking: Attached double garage with automatic door (2 covered spaces)
- Security: Intercom
- Utilities: Served by Fairhope utilities
- Home design: Single-family home; One story; Resale property; Whole/full ownership; Zoned for single family residence
- Construction: Built with brick, vinyl siding and wood siding; Composition roof; Slab foundation; Building area measured by agent (2,059 square feet)
- Exterior features: Partial fencing; Patio; Screened porch; Front porch; Corner lot in a subdivision; No waterfront
Interior
- Kitchen: Electric range; Microwave; Dishwasher; Refrigerator
- Bedrooms: Primary bedroom with attached bath (main/1st floor), approx. 17 x 15; Second bedroom approx. 12 x 12; Third bedroom approx. 12 x 12; Fourth bedroom approx. 12 x 12
- Flooring: Carpet; Tile
- Bathrooms: Three full bathrooms; Primary bath with double vanity, soaking tub and separate shower
- Heating & cooling: Central electric cooling; Ceiling fans
- Interior features: Entrance foyer; Sun room; High ceilings; Internet service available; Split bedroom plan; Living room fireplace
- Laundry & utility: Washer and dryer included; Main level laundry located inside (approx. 6 x 5 utility)
Neighborhood map
What this means for you Summary
Snapshot
- This is a 4-bed/3.0-bath single-family listed at $349k.
Deal economics
- At list price, monthly cash flow is $-149 ($-2k/yr) — negative.
- To cash-flow at today's rent, offer at most $323k (7.5% below list).
- To meet the 1% rule (rent ≥ 1% of price), the offer needs to be $245k (29.7% below list).
- Recommended offer: $245k (29.7% below list) — sets the bar for 1% rule.
- Cap rate 5.8% vs local median 2.8% in Fairhope — top-decile yield for the area; either an underpriced asset or a hidden risk that comps aren't pricing in. Stress-test before assuming the spread holds.
Location & tenants
- Location reads 76/100 on livability (#15 in AL, #3,577 nationally) — a middle-class / working-renter tenant base. Strengths: crime A+, employment A+, housing A+; Watch: cost of living D, amenities F, commute F.
- Baldwin County (rural): math 33% / reading 57% proficiency, ranked #18 of 129 in AL (top 14%) — families likely to look elsewhere, expect single-tenant / working-renter base with shorter leases.
- Zoned schools: Fairhope East Elementary (math 53% / reading 78%, grade B+, #37 of 627 statewide, top 6%, 740 students, 30% FRL); Fairhope Middle School (math 54% / reading 75%, grade A-, #3 of 257 statewide, top 1%, 777 students, 33% FRL); Fairhope High School (math 43% / reading 46%, grade F, #22 of 305 statewide, top 8%, 1,629 students, 31% FRL).
- Zoned-school proficiency averages 58% at this address vs 45% district-wide (+13 pts) — the actual schools serving this property are materially stronger than the Baldwin County average implies; a family-tenant draw the district grade alone would hide.
- Market conditions: Rents rising (+3.0%/yr); 633 active listings in the ZIP; 4 comparable units currently listed for rent nearby; rentals lingering (median 46d on market — plan ~5-8 weeks vacancy on turnover, expect pricing pressure); 75% of comp listings sitting > 30 days — soft ceiling on asking rent; solid renter incomes; 3,883 units permitted in Baldwin County in 2024 (481 in 5+ unit buildings).
- This rent runs 33% of the median local income ($90k/yr) — at the standard rent-burdened threshold; future hikes will face affordability resistance.
Forward outlook
- Local home prices are declining (-3.0%/yr); year-one equity from $2k of loan paydown is wiped out by about $10k of value loss. Plan a longer hold.
- Baldwin County population projected at +42% by 2050 — long-run rental-demand tailwind backs the buy-and-hold thesis.
Negotiation context
- It's been on market 44 days — a 3% lower offer ($339k) is reasonable based on typical stale-listing flexibility.
- 2 sale attempts with the ask held roughly flat each time — persistent listings suggest the price (not the market) is what's stuck; bring a comps-based counter.
Risks & watch-outs
- Climate carrying-cost: severe wind risk, 99% chance of damaging wind over 30y; extreme-heat days projected 7→23/yr by 2055 (HVAC capex compounding) — expect insurance premiums to compound above CPI over the hold.
Questions for the listing agent
- What do current leases actually rent for vs. the listed asking? Can we see a recent rent roll and the last 12 months of T-12 income?
- It's been on market 44 days. Have you received any prior offers? Is the seller open to a 30% concession, seller financing, or rate buy-down credit?
- What does the HOA fee cover, when was the last increase, and are there any pending special assessments or reserve-fund shortfalls?
- Is there a deadline driving the sale (1031 exchange, divorce, estate, relocation)? That informs how much negotiation room exists.
- Schools are A-rated — typically a magnet for longer-tenancy family renters. What's the average tenant stay here, and is there a school-zone premium baked into asking?
- The area grade is low — what's the realistic commute time and amenity access for the typical tenant pool here? Any planned neighborhood developments (good or bad) we should know about?
- What's the average days-on-market for RENTAL listings here right now (not sales)? A rising rental-DOM trend means longer vacancies and softer asking-rent achievability than the comps imply.
- What's the recent tenant-quality profile in this submarket — average credit score on applications, eviction rate, late-payment / NSF rate, and stable-employment percentage? A property-management company in the area should have these aggregated.
- How much new for-sale + rental construction is in the pipeline within 1–3 miles? Heavy new supply typically softens prices + rents 12–24 months out; constrained supply supports both.
Investment metrics
- 1% rule
- 0.70% ✗
- Cap rate
- 5.78%
- Cash-on-cash
- -1.83%
- DSCR
- 0.92
- GRM
- 11.9
CMA / ARV
- ARV (median comp)
- $373,532
- List price
- $349,000
- Delta
- -6.57%
- Verdict
- FAIR
- Comps
- 20 within 1.0 mi
Show comp detail 12 sales within ~0.75 mi
| Address | Dist | Beds/Ba | Sqft | Sold | Price | $/sf | Match |
|---|---|---|---|---|---|---|---|
| 10699 Eastwood Ave | 0.16mi | 4/2.0 | 1,961 (-5%) | 3mo | $353,000 | $180 | 78 |
| 10849 Eastwood Ave | 0.06mi | 3/2.0 (-1) | 2,190 (+6%) | 1mo | $345,000 | $158 | 77 |
| 10452 Gayfer Road Ext | 0.43mi | 3/2.0 (-1) | 2,001 (-3%) | 1mo | $425,000 | $212 | 65 |
| 268 Falls Creek St | 0.66mi | 4/2.0 | 2,121 (+3%) | 4mo | $430,000 | $203 | 57 |
| 176 Ornate Ave | 0.51mi | 4/2.0 | 2,230 (+8%) | 5mo | $419,000 | $188 | 54 |
| 212 Ornate Ave | 0.49mi | 4/2.0 | 2,270 (+10%) | 3mo | $440,000 | $194 | 54 |
| 116 Petz Ave | 0.48mi | 3/2.5 (-1) | 1,868 (-9%) | 2mo | $385,000 | $206 | 53 |
| 697 Calibre St | 0.55mi | 4/3.0 | 2,304 (+12%) | 2mo | $440,000 | $191 | 53 |
| 191 Ornate Ave | 0.51mi | 4/3.0 | 2,336 (+14%) | 2mo | $465,000 | $199 | 52 |
| 247 Falls Creek St | 0.69mi | 3/2.0 (-1) | 1,986 (-4%) | 3mo | $378,000 | $190 | 51 |
| 20363 Cadena Creek Ave | 0.61mi | 3/2.5 (-1) | 2,226 (+8%) | 6mo | $362,000 | $163 | 46 |
| 20367 River Mill Dr | 0.56mi | 3/2.5 (-1) | 1,798 (-13%) | 2mo | $285,000 | $159 | 44 |
Match score weights: distance 35% · size 25% · config 20% · recency 20%. Top-matched comps best support the ARV.
Projected returns pro-forma
-3.0% appreciation · 2.95% rent growth · sell at horizon
- IRR
- -19.4%
- Equity multiple
- 0.32×
- Total profit
- $-66,338
- Equity at exit
- $52,037
- IRR
- -12.4%
- Equity multiple
- 0.27×
- Total profit
- $-71,165
- Equity at exit
- $30,175
Cash invested: $97,720 (down + closing). Projections, not guarantees.
Landlord ↔ Tenant lean methodology
- Overall (STATE)
- 90 Strongly Landlord-Friendly
- State Alabama
- 90 Strongly Landlord-Friendly · R+15
- County
- — inherits STATE
- City
- — inherits STATE
ZIP-level market 36532
- Rents YoY
- 3.0%
- Active inventory
- 633
- Price-to-rent
- 11.9×
Monthly cashflow live
- Estimated rent
- $2,452 medium interval (Pro) →
- Mortgage (P&I)
- −$1,830
- Tax from tax record
- −$88 /mo · $1,053/yr
- Insurance
- −$145
- HOA
- −$23
- Vacancy / Maint / Mgmt
- −$515
- Net cashflow
- $-149
Break-even live
Sensitivity live
| Price | -10% $48 | -5% $-50 | +0% $-149 | +5% $-248 | +10% $-347 |
|---|---|---|---|---|---|
| Rent | -10% $-343 | -5% $-246 | +0% $-149 | +5% $-52 | +10% $45 |
| Rate | -1.0pp $27 | -0.5pp $-60 | base $-149 | +0.5pp $-240 | +1.0pp $-332 |
UW: 25.0% down · 7.5% · 30yr · 1.5% tax · 5.0% vac · 8.0% maint · 8.0% mgmt
Financing live
Cash to close
- Down payment
- $87,250
- Closing costs
- $10,470
- Reserves months
- —
- Total cash needed
- —
Loan-product check · same deal, 3 products live
Conventional
25% down · 7.5% · 30yr
- Down + closing
- —
- Monthly P&I
- —
- Monthly cashflow
- —
- DSCR
- —
- Eligible?
- —
Personal DTI + credit; lowest rate.
DSCR
20% down · 8.5% · 30yr
- Down + closing
- —
- Monthly P&I
- —
- Monthly cashflow
- —
- DSCR
- —
- Eligible?
- —
No personal income docs; deal must DSCR.
Hard money
10% down · 12.0% · 12mo
- Down + closing
- —
- Monthly P&I
- —
- Monthly cashflow
- —
- DSCR
- —
- Eligible?
- —
Short-term bridge; refi at stabilization.
Rent comps 4 comps
| Address | Beds | Baths | Sqft | Rent | $/sqft | DOM | Units | Dist |
|---|---|---|---|---|---|---|---|---|
| 10510 Gayfer Road Ext Fairhope, AL | 3.0 | 2.0 | 1460 | $1,900 | $1.30 | 45d | 1 | 0.39mi |
| 177 Ferdinand Ave Fairhope, AL | 4.0 | 2.0 | 1790 | $2,350 | $1.31 | 45d | 1 | 0.42mi |
| 101 Normandy St Fairhope, AL | 3.0 | 2.5 | 2377 | $2,250 | $0.95 | 45d | 1 | 0.73mi |
| 9704 Chariot Ave Fairhope, AL | 4.0 | 2.0 | 1813 | $2,000 | $1.10 | 22d | 1 | 1.46mi |
HOA detail
- Monthly dues
- $23 · $276/yr
- Likely covers
- gas
Listing history 20 events
-
2026-06-21days on market $349,000 Active 44 DOM
-
2026-06-19days on market $349,000 Active 42 DOM
-
2026-06-18days on market $349,000 Active 41 DOM
-
2026-06-17days on market $349,000 Active 40 DOM
-
2026-06-16days on market $349,000 Active 39 DOM
-
2026-06-15days on market $349,000 Active 38 DOM
-
2026-06-14days on market $349,000 Active 36 DOM
-
2026-06-13days on market $349,000 Active 35 DOM
-
2026-06-10days on market $349,000 Active 33 DOM
-
2026-06-09days on market $349,000 Active 32 DOM
-
2026-06-08days on market $349,000 Active 31 DOM
-
2026-06-07statusdays on market $349,000 Active 30 DOM
-
2026-06-05days on market $349,000 Active Under Contract 27 DOM
-
2026-06-03days on market $349,000 Active Under Contract 26 DOM
-
2026-06-03status $349,000 Active Under Contract 25 DOM
-
2026-06-02days on market $349,000 Active 25 DOM
-
2026-06-01days on market $349,000 Active 24 DOM
-
2026-05-31days on market $349,000 Active 23 DOM
-
2026-05-30days on market $349,000 Active 22 DOM
-
2026-05-01$349,000 Active 1719-char remark
ⓘ Source: listings_history table (triggers on properties + properties_extension) + one-shot
backfill from property_details.listing_events for pre-trigger history.
Tax reassessment forecast AL · Resets to sale price
- Current annual tax
- $1,053 · $88/mo
- Projected year-2 tax
- $1,431 · $119/mo
- Expected delta
- +$378/yr (+$32/mo · 35.9%)
ⓘ Screening estimate from a state-policy table — verify with the county assessor before closing.
Climate risk First Street
- Flood 1/10 Low FEMA zone X (unshaded) · 0% chance over 30 yrs
- Wildfire 4/10 Moderate
- Heat 10/10 Extreme 7 d/yr ≥106°F today · 23 d/yr by 30 yrs out
- Wind 9/10 Extreme 99% chance of damaging wind over 30 yrs
- Air quality 4/10 Moderate 3 unhealthy d/yr today · 5 by 30 yrs out
Nearby sold comps map
Loading sold comps map…
Walkable amenities ~0.75 mi
Loading nearby amenities…
Taxation est. · year 1
- Rental income
- $29,426
- − Mortgage interest
- −$19,549
- − Property taxes
- −$1,053
- − Insurance
- −$1,745
- − Repairs & maintenance
- −$2,354
- − Management
- −$2,354
- − HOA
- −$276
- − Depreciation
- −$10,153
- Taxable loss
- −$8,058
- Est. tax savings @ 24.0%
- +$1,934
- After-tax cash flow
- $144/yr
For passive investors: Depreciation is non-cash, so a rental often shows a tax loss while cash-flowing — sheltering income. Rental losses are passive: they offset passive income freely, and up to $25,000/yr can offset ordinary (W-2) income if you actively participate and your MAGI is under $100k (phasing out to $0 by $150k); unused losses carry forward. On sale, claimed depreciation is recaptured at up to 25%, and gains may owe capital-gains tax (a 1031 exchange can defer both). Figures are a year-1 estimate at your 24.0% rate — not tax advice; consult a CPA.
Schools (NCES district)
- District
- Baldwin County
- NCES district ID
- 0100270
- Math proficiency
- 33% ▼ -26.00%
- Reading proficiency
- 57% ▲ 1.00%
- Median HH income
- $50,677
- Composite
- 38.61/100
- National rank
- #4157
- State rank
- #18 of 129 in AL
Livability — Fairhope
- Score
- 76/100
- State rank
- #15
- US rank
- #3577
Category grades
Schools grade is shown separately in the Schools card above.
Census & demographics
- Census place
- Fairhope, AL
- County
- Baldwin County · 181,514 people
- City population
- 38,108
- Metro
- Daphne-Fairhope-Foley, AL
- Population (ZIP)
- 38,108
- Household income
- $89,694
- Rent vs Own
- Severe rent burden
- 665.0
Population outlook (Baldwin County) Hauer SSP2
- Today (2025)
- 248,264 people
- By 2030
- 270,315 · +8.9%
- By 2040
- 312,967 · +26.1%
- By 2050
- 352,262 · +41.9%
- By 2075
- 438,841 · +76.8%
- By 2100
- 487,736 · +96.5%
Race, ethnicity, and origin ACS 2023
- Neighborhood character
- Predominantly White (87%)
- Race & ethnicity
- White 87% Hispanic / Latino 6% Black 4% Two or more races 4%
- Hispanic origin (detail)
- Mexican 2%
- Common ancestry
- Serbian 4% Slovak 3% Lithuanian 3%
- Foreign-born
- 3% · Canada
- Languages at home
- 95% English-only · Spanish 3% Other Indo-European 1%
Political lean MEDSL · Baldwin
- 2024 margin
- Solid R (+58.2) · D 20.5% · R 78.7%
- 2008→2024 swing
- -6.7pp toward R · 2008: -51.5pp · 2024: -58.2pp
- All cycles
- 2024: R+58.2 2020: R+53.8 2016: R+57.8 2012: R+55.8 2008: R+51.5
Not yet ingested
- Civics
- —
Market trends
- HPI YoY
- ▼ -175.08%
- Current HPI
- 299.6643
- Rent YoY
- ▲ 2.95%
- Metro
- Daphne-Fairhope-Foley, AL
- State GDP YoY
- ▲ 2.94%
- F500 in state
- 4
Industry mix (Fortune 500 HQ in AL)
| Industry | F500 HQs | Revenue |
|---|---|---|
| Financial Services | 1 | $8B |
|
||
| Healthcare | 1 | $5B |
|
||
Price history
4 events — show timeline
- 2026-06-06 Relisted — BCAR
- 2026-06-02 Contingent — BCAR
- 2026-06-02 Pending — BCAR
- 2026-05-01 Listed $349,000 BCAR
Property tax history
+4.5%/yrLatest (2019): $1,053 · +17.2% YoY. Source: county tax records.
Cash-flow waterfall
monthlySold comps — $/sqft
last 12 mo · ≤1 miLoading sold comps…