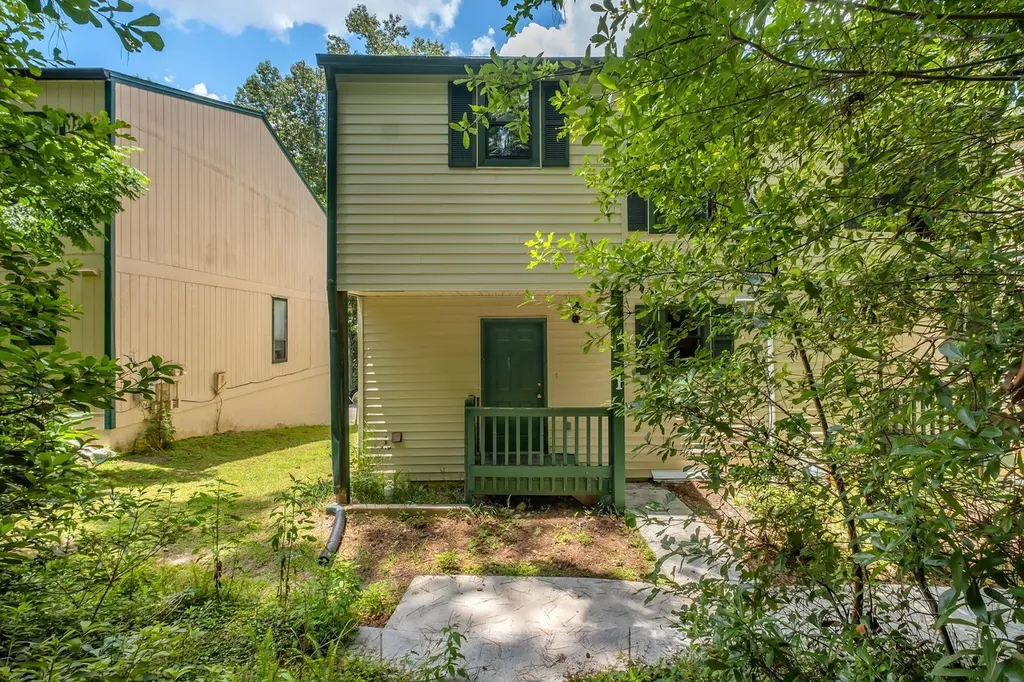
1208 Cross Creek Way #1 · Tallahassee, FL
Flood risk 1/10 · Minimal
- FEMA flood zone
- X (unshaded)
- Chance of flooding over 30 yrs
- 0.0%
- Est. flood insurance / yr
- $507 – $1,088
Fire risk 3/10 · Minor
- Est. fire insurance / yr
- $947 – $1,759
Heat risk 8/10 · Major
- Hot days now (above 108°F)
- 7 days/yr
- Hot days in 30 yrs
- 20 days/yr
Wind risk 9/10 · Severe
- Chance of severe wind over 30 yrs
- 99.0%
Air-quality risk 4/10 · Minor
- Unhealthy air days now
- 6 days/yr
- Unhealthy air days in 30 yrs
- 7 days/yr
Risk factors via First Street. Map © Google.
Why this score? — see what drove the D grade
The composite is a weighted blend of 9 inputs, each scored 0–100. Each bar is that input's sub-score; the figure is the points it added to the 100-point composite (weight × sub-score).
- Cash flow +11.3/30.0
- ARV discount +7.6/15.0
- Schools +4.3/10.0
- Livability +4.3/5.0
- Rent growth +3.5/5.0
- 1% rule +3.4/10.0
- DSCR +3.3/10.0
- Condition / age +2.5/5.0
- Appreciation +0.0/10.0
$202,900
🖨 Deal sheet 📄 Offer letter ✓ Due diligence
Listing remarks
Discover this awesome 3 Bed/2.5 Bath end-unit townhouse with a garage on Tallahassee’s East side! This home features tile flooring throughout, a spacious U-shaped kitchen with great cabinet space, and a stunning stone fireplace that serves as the centerpiece of the living area. Enjoy stylish touches like a decorative backsplash and paint, plus a large laundry room for added convenience. The primary suite offers a walk-in closet and direct access to a newly redone balcony. Major updates include a 2020 roof, 2024 HVAC, and replaced siding around 2017 so it's totally move-in ready with peace of mind for big ticket items! Tucked away on a private street with a serene greenspace view, this
Key facts
- Walk-in closet
- Large laundry room
- End-unit townhouse
Tags
Property features AI
Finance
- Financial info: For sale
Exterior
- Parking: 1-car garage
- Home design: 2 stories; Vinyl siding
- Construction: Vinyl siding construction
- Exterior features: Paved road access; Has view
Interior
- Kitchen: Dishwasher; Disposal; Oven; Range; Refrigerator
- Bedrooms: Bedroom 2 (8x10); Bedroom 3 (12x9); Upper-level primary bedroom
- Flooring: Tile
- Bathrooms: 2 full bathrooms; 1 half bathroom
- Heating & cooling: Central heating; Wood heating; Central air conditioning; Ceiling fan(s)
- Interior features: End unit; Upper-level primary; Tile flooring; Has view
- Laundry & utility: Utility room
Neighborhood map
What this means for you Summary
Snapshot
- This is a 3-bed/2.5-bath townhouse listed at $203k.
Deal economics
- At list price, monthly cash flow is $-74 ($-892/yr) — negative.
- To cash-flow at today's rent, offer at most $190k (6.5% below list).
- To meet the 1% rule (rent ≥ 1% of price), the offer needs to be $169k (16.5% below list).
- Recommended offer: $169k (16.5% below list) — sets the bar for 1% rule.
- Cap rate 5.9% vs local median 4.2% in Tallahassee — top-decile yield for the area; either an underpriced asset or a hidden risk that comps aren't pricing in. Stress-test before assuming the spread holds.
Location & tenants
- Location reads 86/100 on livability (#19 in FL, #429 nationally) — a professional / high-income tenant draw. Strengths: amenities A+, commute A+, health & safety A+; Watch: employment D.
- Leon (urban): math 48% / reading 53% proficiency, ranked #33 of 73 in FL (top 45%) — acceptable for families but not a draw, mixed tenant base, ~2y average lease.
- Market conditions: Rents rising fast (+4.2%/yr); 121 active listings in the ZIP; 26 comparable units currently listed for rent nearby; rentals at typical pace (median 21d on market — plan ~3-4 weeks tenant-placement turnaround); 1,765 units permitted in Leon County in 2024 (975 in 5+ unit buildings).
- This rent runs 40% of the median local income ($51k/yr) — at the standard rent-burdened threshold; future hikes will face affordability resistance.
Forward outlook
- Local home prices are declining (-3.0%/yr); year-one equity from $1k of loan paydown is wiped out by about $6k of value loss. Plan a longer hold.
- Leon County population projected at +23% by 2050 — long-run rental-demand tailwind backs the buy-and-hold thesis.
Negotiation context
- It's been on market 49 days — a 3% lower offer ($197k) is reasonable based on typical stale-listing flexibility.
- 5 sale attempts since 3y ago with the ask held roughly flat each time — persistent listings suggest the price (not the market) is what's stuck; bring a comps-based counter.
- Current owner paid $56k; list at $203k implies a 259% gain — meaningful room to come down on a strong offer.
Risks & watch-outs
- Climate carrying-cost: severe wind risk, 99% chance of damaging wind over 30y; extreme-heat days projected 7→20/yr by 2055 (HVAC capex compounding) — expect insurance premiums to compound above CPI over the hold.
Questions for the listing agent
- What do current leases actually rent for vs. the listed asking? Can we see a recent rent roll and the last 12 months of T-12 income?
- It's been on market 49 days. Have you received any prior offers? Is the seller open to a 16% concession, seller financing, or rate buy-down credit?
- Is there a deadline driving the sale (1031 exchange, divorce, estate, relocation)? That informs how much negotiation room exists.
- Schools are B-rated — typically a magnet for longer-tenancy family renters. What's the average tenant stay here, and is there a school-zone premium baked into asking?
- The area grade is low — what's the realistic commute time and amenity access for the typical tenant pool here? Any planned neighborhood developments (good or bad) we should know about?
- What's the average days-on-market for RENTAL listings here right now (not sales)? A rising rental-DOM trend means longer vacancies and softer asking-rent achievability than the comps imply.
- What's the recent tenant-quality profile in this submarket — average credit score on applications, eviction rate, late-payment / NSF rate, and stable-employment percentage? A property-management company in the area should have these aggregated.
- How much new for-sale + rental construction is in the pipeline within 1–3 miles? Heavy new supply typically softens prices + rents 12–24 months out; constrained supply supports both.
Investment metrics
- 1% rule
- 0.84% ✗
- Cap rate
- 5.85%
- Cash-on-cash
- -1.57%
- DSCR
- 0.93
- GRM
- 10.0
CMA / ARV
- ARV (on-the-fly)
- $203,184
- Comps found
- 12
Show comp detail 12 sales within ~0.75 mi
| Address | Dist | Beds/Ba | Sqft | Sold | Price | $/sf | Match |
|---|---|---|---|---|---|---|---|
| 2924 Cross Creek Ct | 0.16mi | 3/2.0 | 1,270 (-4%) | 3mo | $223,000 | $176 | 81 |
| 2904 Cross Creek Ct | 0.13mi | 2/2.0 (-1) | 1,288 (-3%) | 1mo | $200,000 | $155 | 81 |
| 2910 Cross Creek Ct | 0.13mi | 2/2.0 (-1) | 1,288 (-3%) | 9mo | $215,000 | $167 | 74 |
| 3097 Camelliawood Cir | 0.33mi | 2/2.0 (-1) | 1,316 (-1%) | 4mo | $225,000 | $171 | 73 |
| 1288 Cross Creek Cir | 0.17mi | 2/2.0 (-1) | 1,382 (+4%) | 10mo | $184,000 | $133 | 70 |
| 2308 Tina Dr | 0.45mi | 3/2.0 | 1,242 (-6%) | 2mo | $190,000 | $153 | 65 |
| 2992 Woodrich Dr #2 | 0.26mi | 3/2.0 | 1,203 (-9%) | 10mo | $167,500 | $139 | 62 |
| 1305 Cross Creek Cir | 0.22mi | 2/1.5 (-1) | 1,408 (+6%) | 11mo | $200,000 | $142 | 62 |
| 671 Chicopee Ct | 0.60mi | 2/2.0 (-1) | 1,290 (-3%) | 1mo | $220,000 | $171 | 59 |
| 1362 Castelnau Ct Unit 3-C | 0.65mi | 3/2.0 | 1,242 (-6%) | 6mo | $185,000 | $149 | 51 |
| 1363 Castelnau Ct Unit A | 0.64mi | 3/2.0 | 1,224 (-8%) | 7mo | $148,000 | $121 | 49 |
| 1483 Live Oak Dr | 0.64mi | 2/2.0 (-1) | 1,144 (-14%) | 9mo | $139,500 | $122 | 32 |
Match score weights: distance 35% · size 25% · config 20% · recency 20%. Top-matched comps best support the ARV.
Projected returns pro-forma
-3.0% appreciation · 4.16% rent growth · sell at horizon
- IRR
- -17.6%
- Equity multiple
- 0.37×
- Total profit
- $-35,579
- Equity at exit
- $30,253
- IRR
- -7.6%
- Equity multiple
- 0.50×
- Total profit
- $-28,540
- Equity at exit
- $17,543
Cash invested: $56,812 (down + closing). Projections, not guarantees.
Landlord ↔ Tenant lean methodology
- Overall (STATE)
- 87 Strongly Landlord-Friendly
- State Florida
- 87 Strongly Landlord-Friendly · R+3
- County
- — inherits STATE
- City
- — inherits STATE
ZIP-level market 32301
- Rents YoY
- 4.2%
- Active inventory
- 121
- Price-to-rent
- 10.0×
Monthly cashflow live
- Estimated rent
- $1,695 high interval (Pro) →
- Mortgage (P&I)
- −$1,064
- Tax from tax record
- −$265 /mo · $3,175/yr
- Insurance
- −$85
- HOA
- −$0
- Vacancy / Maint / Mgmt
- −$356
- Net cashflow
- $-74
Break-even live
UW: 25.0% down · 7.5% · 30yr · 1.5% tax · 5.0% vac · 8.0% maint · 8.0% mgmt
Financing live
Cash to close
- Down payment
- $50,725
- Closing costs
- $6,087
- Reserves months
- —
- Total cash needed
- —
Loan-product check · same deal, 3 products live
Conventional
25% down · 7.5% · 30yr
- Down + closing
- —
- Monthly P&I
- —
- Monthly cashflow
- —
- DSCR
- —
- Eligible?
- —
Personal DTI + credit; lowest rate.
DSCR
20% down · 8.5% · 30yr
- Down + closing
- —
- Monthly P&I
- —
- Monthly cashflow
- —
- DSCR
- —
- Eligible?
- —
No personal income docs; deal must DSCR.
Hard money
10% down · 12.0% · 12mo
- Down + closing
- —
- Monthly P&I
- —
- Monthly cashflow
- —
- DSCR
- —
- Eligible?
- —
Short-term bridge; refi at stabilization.
Rent comps 26 comps
| Address | Beds | Baths | Sqft | Rent | $/sqft | DOM | Units | Dist |
|---|---|---|---|---|---|---|---|---|
| 2902 Battle Mountain Rd Tallahassee, FL | 2.0 | 2.0 | 1160 | $1,324 | $1.14 | 21d | 4 | 0.10mi |
| 430 Grail Ct Tallahassee, FL | 3.0 | 2.0 | 1252 | $2,300 | $1.84 | 21d | 1 | 0.24mi |
| 432 Merlin Way Tallahassee, FL | 3.0 | 2.0 | 1453 | $2,150 | $1.48 | 21d | 1 | 0.29mi |
| 1320 Hendrix Rd #301 Tallahassee, FL | 3.0 | 2.5 | 1554 | $1,695 | $1.09 | 21d | 1 | 0.51mi |
| 501 S Blair Stone Rd Tallahassee, FL | 1.0–3.0 | 1.0–2.0 | 1080 | $1,605 | $1.49 | 21d | 1 | 0.55mi |
| 599 Chicopee Ct Unit D Tallahassee, FL | 2.0 | 1.0 | 900 | $1,095 | $1.22 | 21d | 1 | 0.55mi |
| 581 Holyoke Ct Apt C Tallahassee, FL | 2.0 | 1.0 | 995 | $1,125 | $1.13 | 21d | 1 | 0.57mi |
| 410 Victory Garden Dr Tallahassee, FL | 1.0–3.0 | 1.0–2.5 | 1183 | $1,695 | $1.43 | 21d | 1 | 0.61mi |
| 2750 Old Saint Augustine Rd Tallahassee, FL | 1.0–3.0 | 1.0–2.0 | 1230 | $1,739 | $1.41 | 21d | 2 | 0.75mi |
| 3148 Dick Wilson Blvd Tallahassee, FL | 1.0–3.0 | 1.0–2.0 | 1536 | $1,940 | $1.26 | 13d | 14 | 0.79mi |
| 2001 Old Saint Augustine Rd Tallahassee, FL | 1.0–2.0 | 1.0–2.0 | 875 | $1,436 | $1.64 | 13d | 11 | 0.80mi |
| 2912 Capital Park Dr Tallahassee, FL | 3.0 | 2.0 | 1236 | $1,650 | $1.33 | 13d | 1 | 0.81mi |
| 1736 Augustine Pl Tallahassee, FL | 3.0 | 2.0 | 1400 | $2,000 | $1.43 | 21d | 1 | 0.81mi |
| 1515 Paul Russell Rd #85 Tallahassee, FL | 3.0 | 2.5 | 1482 | $1,400 | $0.94 | 21d | 1 | 0.83mi |
| 1572 Keily Run Unit 1572 Tallahassee, FL | 2.0 | 2.0 | 1200 | $1,250 | $1.04 | 21d | 1 | 0.88mi |
| 2729 Blair stone Ln Unit 1 Tallahassee, FL | 3.0 | 1.5 | 1280 | $1,550 | $1.21 | 21d | 1 | 0.96mi |
| 1575 Paul Russell Rd Tallahassee, FL | 3.0 | 2.5 | 1705 | $1,700 | $1.00 | 21d | 1 | 1.07mi |
| 2074 Midyette Rd Tallahassee, FL | 2.0–3.0 | 2.0 | 1033 | $1,346 | $1.30 | 13d | 1 | 1.10mi |
| 1942 Darryl Dr Unit 1 Tallahassee, FL | 2.0 | 2.0 | 1200 | $2,300 | $1.92 | 21d | 1 | 1.10mi |
| 1872 Darryl Dr Tallahassee, FL | 2.0 | 2.0 | 1062 | $1,500 | $1.41 | 21d | 1 | 1.11mi |
| 2250 Bluff Oak Way Tallahassee, FL | 1.0–3.0 | 1.0–2.0 | 1538 | $1,978 | $1.29 | 13d | 17 | 1.15mi |
| 3373 Apalachee Pkwy Tallahassee, FL | 1.0–2.0 | 1.0–2.0 | 779 | $1,258 | $1.61 | 13d | 1 | 1.21mi |
| 2779 Blair Stone Ct Tallahassee, FL | 3.0 | 2.5 | 1751 | $2,200 | $1.26 | 13d | 1 | 1.23mi |
| 900 Riggins Rd Tallahassee, FL | 1.0–3.0 | 1.0–2.0 | 997 | $2,060 | $2.07 | 13d | 39 | 1.45mi |
| 1411 Lazy Brk Unit D Tallahassee, FL | 2.0 | 1.0 | 950 | $1,150 | $1.21 | 21d | 1 | 1.47mi |
| 1412 Ramble Brk Unit C Tallahassee, FL | 2.0 | 1.0 | 950 | $1,050 | $1.11 | 21d | 1 | 1.48mi |
Listing history 25 events
-
2026-06-18days on market $202,900 Active 49 DOM
-
2026-06-17days on market $202,900 Active 48 DOM
-
2026-06-16days on market $202,900 Active 47 DOM
-
2026-06-15days on market $202,900 Active 46 DOM
-
2026-06-14days on market $202,900 Active 44 DOM
-
2026-06-10days on market $202,900 Active 41 DOM
-
2026-06-09days on market $202,900 Active 40 DOM
-
2026-06-08days on market $202,900 Active 39 DOM
-
2026-06-07days on market $202,900 Active 38 DOM
-
2026-06-05days on market $202,900 Active 35 DOM
-
2026-06-03days on market $202,900 Active 34 DOM
-
2026-06-02days on market $202,900 Active 33 DOM
-
2026-06-01days on market $202,900 Active 32 DOM
-
2026-05-31days on market $202,900 Active 31 DOM
-
2026-05-30days on market $202,900 Active 30 DOM
-
2026-05-15status Active
-
2026-05-14historical
-
2026-04-29$202,900 Active
-
2026-04-29historical
-
2025-07-30$215,000 Active
-
2023-09-05historical
-
2023-07-14status Active
-
2023-07-13$199,900 Active
-
2023-07-13historical
-
1981-10-01soldstatus $56,500
ⓘ Source: listings_history table (triggers on properties + properties_extension) + one-shot
backfill from property_details.listing_events for pre-trigger history.
Tax reassessment forecast FL · Resets to sale price
- Current annual tax
- $3,175 · $265/mo
- Projected year-2 tax
- $3,175 · $265/mo
- Expected delta
- $0/yr ($0/mo · -0.0%)
ⓘ Screening estimate from a state-policy table — verify with the county assessor before closing.
Climate risk First Street
- Flood 1/10 Low FEMA zone X (unshaded) · 0% chance over 30 yrs
- Wildfire 3/10 Moderate
- Heat 8/10 Severe 7 d/yr ≥108°F today · 20 d/yr by 30 yrs out
- Wind 9/10 Extreme 99% chance of damaging wind over 30 yrs
- Air quality 4/10 Moderate 6 unhealthy d/yr today · 7 by 30 yrs out
Nearby sold comps map
Loading sold comps map…
Walkable amenities ~0.75 mi
Loading nearby amenities…
Taxation est. · year 1
- Rental income
- $20,336
- − Mortgage interest
- −$11,366
- − Property taxes
- −$3,175
- − Insurance
- −$1,014
- − Repairs & maintenance
- −$1,627
- − Management
- −$1,627
- − Depreciation
- −$5,903
- Taxable loss
- −$4,375
- Est. tax savings @ 24.0%
- +$1,050
- After-tax cash flow
- $158/yr
For passive investors: Depreciation is non-cash, so a rental often shows a tax loss while cash-flowing — sheltering income. Rental losses are passive: they offset passive income freely, and up to $25,000/yr can offset ordinary (W-2) income if you actively participate and your MAGI is under $100k (phasing out to $0 by $150k); unused losses carry forward. On sale, claimed depreciation is recaptured at up to 25%, and gains may owe capital-gains tax (a 1031 exchange can defer both). Figures are a year-1 estimate at your 24.0% rate — not tax advice; consult a CPA.
Schools (NCES district)
- District
- Leon
- NCES district ID
- 1201110
- Math proficiency
- 48% ▼ -13.00%
- Reading proficiency
- 53% ▼ -5.00%
- Median HH income
- $46,339
- Composite
- 42.84/100
- National rank
- #3131
- State rank
- #33 of 73 in FL
Livability — Tallahassee
- Score
- 86/100
- State rank
- #19
- US rank
- #429
Category grades
Schools grade is shown separately in the Schools card above.
Census & demographics
- Census place
- Tallahassee, FL
- County
- Leon County · 294,472 people
- City population
- 294,472
- Metro
- Tallahassee, FL
- Population (ZIP)
- 32,017
- Household income
- $50,942
- Rent vs Own
- Severe rent burden
- 2625.0
Population outlook (Leon County) Hauer SSP2
- Today (2025)
- 315,507 people
- By 2030
- 330,677 · +4.8%
- By 2040
- 358,465 · +13.6%
- By 2050
- 386,804 · +22.6%
- By 2075
- 465,480 · +47.5%
- By 2100
- 519,959 · +64.8%
Race, ethnicity, and origin ACS 2023
- Neighborhood character
- Diverse neighborhood (Simpson 0.61)
- Race & ethnicity
- Black 49% White 38% Hispanic / Latino 6% Two or more races 6% Asian 3%
- Hispanic origin (detail)
- Puerto Rican 1% Cuban 1%
- Common ancestry
- Slovak 2% Romanian 1% Lithuanian 1%
- Foreign-born
- 7% · Canada, China, Vietnam
- Languages at home
- 91% English-only · Spanish 4% Other Indo-European 1% French/Haitian/Cajun 1%
Political lean MEDSL · Leon
- 2024 margin
- Strong D (+21.8) · D 60.3% · R 38.5% · Other 1.2%
- 2008→2024 swing
- -2.5pp toward R · 2008: 24.3pp · 2024: 21.8pp
- All cycles
- 2024: D+21.8 2020: D+28.3 2016: D+25.1 2012: D+23.6 2008: D+24.3
Not yet ingested
- Civics
- —
Market trends
- HPI YoY
- ▼ -231.50%
- Current HPI
- 231.103
- Rent YoY
- ▲ 4.16%
- Metro
- Tallahassee, FL
- State GDP YoY
- ▲ 3.28%
- F500 in state
- 36
Industry mix (Fortune 500 HQ in FL)
| Industry | F500 HQs | Revenue |
|---|---|---|
| Industrial Technology | 2 | $29B |
|
||
| Insurance | 2 | $17B |
|
||
| Retail | 1 | $60B |
|
||
| Technology Distribution | 1 | $58B |
|
||
| Homebuilding | 1 | $35B |
|
||
| Technology Manufacturing | 1 | $35B |
|
||
Price history
+259.1% since first listed10 events — show timeline
- 2026-05-15 Relisted — CATRS
- 2026-05-14 Listing Removed — CATRS
- 2026-04-29 Listing Removed — CATRS
- 2026-04-29 Listed $202,900 CATRS
- 2025-07-30 Listed $215,000 CATRS
- 2023-09-05 Listing Removed — CATRS
- 2023-07-14 Relisted — CATRS
- 2023-07-13 Listing Removed — CATRS
- 2023-07-13 Listed $199,900 CATRS
- 1981-10-01 Sold (Public Records) $56,500 Public Records
Property tax history
+6.9%/yrLatest (2025): $3,175 · +10.3% YoY. Source: county tax records.
Cash-flow waterfall
monthlySold comps — $/sqft
last 12 mo · ≤1 miLoading sold comps…