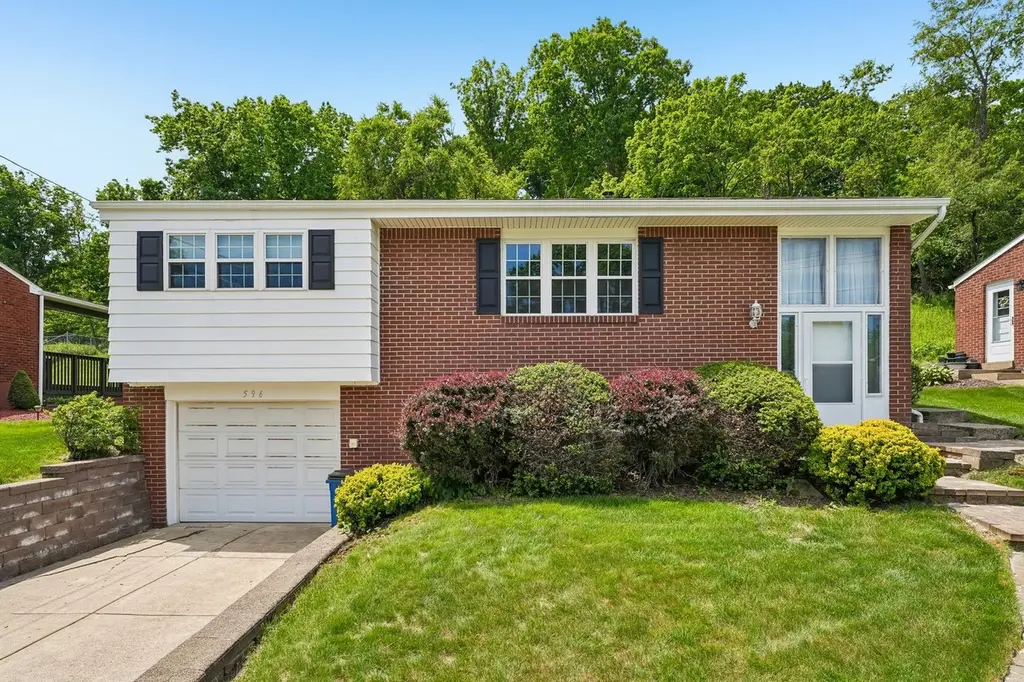
596 Anderson Ave · Plum, PA
Flood risk 1/10 · Minimal
- FEMA flood zone
- X (unshaded)
- Chance of flooding over 30 yrs
- 0.0%
- Est. flood insurance / yr
- $473 – $860
Fire risk 1/10 · Minimal
- Est. fire insurance / yr
- $511 – $949
Heat risk 4/10 · Minor
- Hot days now (above 96°F)
- 7 days/yr
- Hot days in 30 yrs
- 17 days/yr
Wind risk 2/10 · Minimal
- Chance of severe wind over 30 yrs
- 0.0%
Air-quality risk 4/10 · Minor
- Unhealthy air days now
- 5 days/yr
- Unhealthy air days in 30 yrs
- 7 days/yr
Risk factors via First Street. Map © Google.
Why this score? — see what drove the D+ grade
The composite is a weighted blend of 9 inputs, each scored 0–100. Each bar is that input's sub-score; the figure is the points it added to the 100-point composite (weight × sub-score).
- Cash flow +13.7/30.0
- ARV discount +11.2/15.0
- Schools +4.9/10.0
- DSCR +4.1/10.0
- 1% rule +3.7/10.0
- Livability +3.6/5.0
- Rent growth +2.5/5.0
- Condition / age +2.5/5.0
- Appreciation +0.0/10.0
$225,000
🖨 Deal sheet (PDF) 📄 Offer letter ✓ Due diligence
Listing remarks
Welcome to 596 Anderson Avenue in Plum Borough! This well-maintained brick raised ranch offers the perfect blend of comfort, flexibility, and location. Featuring 3 bedrooms, beautiful hardwood floors in the living room, and solid craftsmanship throughout, this move-in-ready home delivers the space today's buyers are looking for with room to grow tomorrow. One of the home's standout features is the beautifully finished lower level, providing valuable additional living space with endless possibilities. Create the ultimate game-day gathering room, home office, fitness area, guest suite, playroom, or multi-generational living space. With its open layout and generous footprint, this level offers
Key facts
- Commuter convenience
- Finished lower level
- 0.27 acre lot
Tags
Property features AI
Finance
- HOA & community: Public transportation access (community feature)
Exterior
- Parking: Attached garage; Built-in parking
- Utilities: Public water; Public sewer
- Home design: Brick construction
- Construction: Asphalt roof; Brick exterior; Home warranty included
- Exterior features: Lot dimensions approximately 62 x 181 x 60 x 205; Public transportation nearby; Property listed as resale
Interior
- Kitchen: Stove; Refrigerator; Some gas appliances
- Bedrooms: Main level bedrooms (two listed): 12x9 and 11x9
- Flooring: Hardwood; Carpet
- Bathrooms: 1 full bathroom
- Heating & cooling: Forced air gas heating; Central air conditioning
- Interior features: Window treatments; Finished basement with walk-out access; Total of 8 rooms
- Laundry & utility: Washer; Dryer; Lower-level laundry room (16x12)
Neighborhood map
What this means for you Summary
Snapshot
- This is a 3-bed/1.0-bath single-family listed at $225k.
Deal economics
- At list price, monthly cash flow is $16 ($189/yr) — positive.
- The deal already cash-flows at list — no discount required.
- To meet the 1% rule (rent ≥ 1% of price), the offer needs to be $196k (12.7% below list).
- Recommended offer: $196k (12.7% below list) — sets the bar for 1% rule.
- Cap rate 6.4% vs local median 4.0% in Plum — top-decile yield for the area; either an underpriced asset or a hidden risk that comps aren't pricing in. Stress-test before assuming the spread holds.
Location & tenants
- Location reads 71/100 on livability (#730 in PA) — a middle-class / working-renter tenant base. Strengths: crime A+, employment A+, cost of living A+; Watch: amenities F, commute F, health & safety F.
- Plum Borough SD (suburban): math 48% / reading 63% proficiency, ranked #91 of 539 in PA (top 17%) — acceptable for families but not a draw, mixed tenant base, ~2y average lease; only 17% free/reduced lunch — higher-income household profile.
- Zoned schools: Plum Shs (math 72%, 1,226 students, 21% FRL) — zoned schools at 21% FRL track the district average.
- Market conditions: 84 active listings in the ZIP; 4 comparable units currently listed for rent nearby; rentals lingering (median 46d on market — plan ~5-8 weeks vacancy on turnover, expect pricing pressure); 50% of comp listings sitting > 30 days — soft ceiling on asking rent; 2,996 units permitted in Allegheny County in 2024 (1,588 in 5+ unit buildings).
Forward outlook
- Local home prices are declining (-3.0%/yr); year-one equity from $2k of loan paydown is wiped out by about $7k of value loss. Plan a longer hold.
Negotiation context
- It's been on market 17 days — a 2% lower offer ($222k) is reasonable based on typical stale-listing flexibility.
Questions for the listing agent
- Built in 1966 — when were the roof, HVAC, electrical panel, plumbing, and water heater last replaced?
- Is there a deadline driving the sale (1031 exchange, divorce, estate, relocation)? That informs how much negotiation room exists.
- Schools are A-rated — typically a magnet for longer-tenancy family renters. What's the average tenant stay here, and is there a school-zone premium baked into asking?
- The area grade is low — what's the realistic commute time and amenity access for the typical tenant pool here? Any planned neighborhood developments (good or bad) we should know about?
- What's the average days-on-market for RENTAL listings here right now (not sales)? A rising rental-DOM trend means longer vacancies and softer asking-rent achievability than the comps imply.
- What's the recent tenant-quality profile in this submarket — average credit score on applications, eviction rate, late-payment / NSF rate, and stable-employment percentage? A property-management company in the area should have these aggregated.
- How much new for-sale + rental construction is in the pipeline within 1–3 miles? Heavy new supply typically softens prices + rents 12–24 months out; constrained supply supports both.
Investment metrics
- 1% rule
- 0.87% ✗
- Cap rate
- 6.38%
- Cash-on-cash
- 0.30%
- DSCR
- 1.01
- GRM
- 9.5
CMA / ARV
- ARV (on-the-fly)
- $245,322
- Comps found
- 12
Show comp detail 12 sales within ~0.75 mi
| Address | Dist | Beds/Ba | Sqft | Sold | Price | $/sf | Match |
|---|---|---|---|---|---|---|---|
| 546 Millers Ln | 0.15mi | 3/1.5 | 1,288 (-7%) | 1mo | $203,000 | $158 | 79 |
| 699 Regency Dr | 0.36mi | 3/1.5 | 1,372 (-1%) | 6mo | $258,000 | $188 | 75 |
| 510 Crestview Dr | 0.30mi | 3/2.0 | 1,375 (-1%) | 8mo | $268,000 | $195 | 74 |
| 536 Anderson Ave | 0.18mi | 4/2.0 (+1) | 1,442 (+4%) | 7mo | $201,000 | $139 | 70 |
| 212 Old Leechburg Rd | 0.40mi | 3/1.5 | 1,302 (-6%) | 4mo | $249,000 | $191 | 66 |
| 3324 Cassius St | 0.54mi | 3/2.0 | 1,438 (+4%) | 0mo | $248,000 | $172 | 64 |
| 304 Sherrie Dr | 0.58mi | 3/2.0 | 1,371 (-1%) | 7mo | $228,000 | $166 | 61 |
| 675 Regency Dr | 0.40mi | 3/1.5 | 1,572 (+13%) | 1mo | $265,000 | $169 | 56 |
| 300 Sherrie Dr | 0.57mi | 3/2.0 | 1,286 (-7%) | 3mo | $228,000 | $177 | 55 |
| 400 Vale Dr | 0.60mi | 3/1.0 | 1,250 (-10%) | 2mo | $247,000 | $198 | 54 |
| 842 Garlow Blvd | 0.58mi | 3/2.0 | 1,231 (-11%) | 3mo | $260,000 | $211 | 48 |
| 209 Cypress Hill Dr | 0.68mi | 4/2.0 (+1) | 1,484 (+7%) | 1mo | $230,000 | $155 | 46 |
Match score weights: distance 35% · size 25% · config 20% · recency 20%. Top-matched comps best support the ARV.
Projected returns pro-forma
-3.0% appreciation · 3.0% rent growth · sell at horizon
- IRR
- -15.8%
- Equity multiple
- 0.44×
- Total profit
- $-35,440
- Equity at exit
- $33,548
- IRR
- -7.4%
- Equity multiple
- 0.53×
- Total profit
- $-29,498
- Equity at exit
- $19,454
Cash invested: $63,000 (down + closing). Projections, not guarantees.
Landlord ↔ Tenant lean methodology
- Overall (STATE)
- 62 Landlord-Friendly
- State Pennsylvania
- 62 Landlord-Friendly · EVEN
- County
- — inherits STATE
- City
- — inherits STATE
ZIP-level market 15239
- Active inventory
- 84
- Price-to-rent
- 9.5×
Monthly cashflow live
- Estimated rent
- $1,964 medium interval (Pro) →
- Mortgage (P&I)
- −$1,180
- Tax from tax record
- −$263 /mo · $3,150/yr
- Insurance
- −$94
- HOA
- −$0
- Vacancy / Maint / Mgmt
- −$413
- Net cashflow
- $16
Break-even live
Sensitivity live
| Price | -10% $143 | -5% $79 | +0% $16 | +5% $-48 | +10% $-112 |
|---|---|---|---|---|---|
| Rent | -10% $-139 | -5% $-62 | +0% $16 | +5% $93 | +10% $171 |
| Rate | -1.0pp $129 | -0.5pp $73 | base $16 | +0.5pp $-43 | +1.0pp $-102 |
UW: 25.0% down · 7.5% · 30yr · 1.5% tax · 5.0% vac · 8.0% maint · 8.0% mgmt
Financing live
Cash to close
- Down payment
- $56,250
- Closing costs
- $6,750
- Reserves months
- —
- Total cash needed
- —
Loan-product check · same deal, 3 products live
Conventional
25% down · 7.5% · 30yr
- Down + closing
- —
- Monthly P&I
- —
- Monthly cashflow
- —
- DSCR
- —
- Eligible?
- —
Personal DTI + credit; lowest rate.
DSCR
20% down · 8.5% · 30yr
- Down + closing
- —
- Monthly P&I
- —
- Monthly cashflow
- —
- DSCR
- —
- Eligible?
- —
No personal income docs; deal must DSCR.
Hard money
10% down · 12.0% · 12mo
- Down + closing
- —
- Monthly P&I
- —
- Monthly cashflow
- —
- DSCR
- —
- Eligible?
- —
Short-term bridge; refi at stabilization.
Rent comps 4 comps
| Address | Beds | Baths | Sqft | Rent | $/sqft | DOM | Units | Dist |
|---|---|---|---|---|---|---|---|---|
| 439 Crestview Dr Pittsburgh, PA | 3.0 | 2.5 | 1688 | $2,300 | $1.36 | 3d | 1 | 0.49mi |
| 1911 Nash Ave Pittsburgh, PA | 3.0 | 1.5 | 910 | $1,595 | $1.75 | 45d | 1 | 1.19mi |
| 127 Saint Croix Dr Pittsburgh, PA | 3.0 | 1.5 | 1573 | $1,695 | $1.08 | 5d | 1 | 1.31mi |
| 213 Tilford Rd Pittsburgh, PA | 4.0 | 1.5 | 1000 | $1,640 | $1.64 | 45d | 1 | 1.34mi |
Listing history 12 events
-
2026-06-21days on market $225,000 Active 17 DOM
-
2026-06-18days on market $225,000 Active 14 DOM
-
2026-06-17days on market $225,000 Active 13 DOM
-
2026-06-16days on market $225,000 Active 12 DOM
-
2026-06-15days on market $225,000 Active 11 DOM
-
2026-06-13days on market $225,000 Active 9 DOM
-
2026-06-13days on market $225,000 Active 8 DOM
-
2026-06-09days on market $225,000 Active 5 DOM
-
2026-06-08days on market $225,000 Active 4 DOM
-
2026-06-07days on market $225,000 Active 3 DOM
-
2026-06-05remarks 699-char remark
-
2026-06-05$225,000 Active 1 DOM
ⓘ Source: listings_history table (triggers on properties + properties_extension) + one-shot
backfill from property_details.listing_events for pre-trigger history.
Tax reassessment forecast PA · Partial reset (capped growth)
- Current annual tax
- $3,150 · $263/mo
- Projected year-2 tax
- $3,353 · $279/mo
- Expected delta
- +$202/yr (+$17/mo · 6.4%)
ⓘ Screening estimate from a state-policy table — verify with the county assessor before closing.
Climate risk First Street
- Flood 1/10 Low FEMA zone X (unshaded) · 0% chance over 30 yrs
- Wildfire 1/10 Low
- Heat 4/10 Moderate 7 d/yr ≥96°F today · 17 d/yr by 30 yrs out
- Wind 2/10 Low 0% chance of damaging wind over 30 yrs
- Air quality 4/10 Moderate 5 unhealthy d/yr today · 7 by 30 yrs out
Nearby sold comps map
Loading sold comps map…
Walkable amenities ~0.75 mi
Loading nearby amenities…
Taxation est. · year 1
- Rental income
- $23,574
- − Mortgage interest
- −$12,603
- − Property taxes
- −$3,150
- − Insurance
- −$1,125
- − Repairs & maintenance
- −$1,886
- − Management
- −$1,886
- − Depreciation
- −$6,545
- Taxable loss
- −$3,623
- Est. tax savings @ 24.0%
- +$869
- After-tax cash flow
- $1,058/yr
For passive investors: Depreciation is non-cash, so a rental often shows a tax loss while cash-flowing — sheltering income. Rental losses are passive: they offset passive income freely, and up to $25,000/yr can offset ordinary (W-2) income if you actively participate and your MAGI is under $100k (phasing out to $0 by $150k); unused losses carry forward. On sale, claimed depreciation is recaptured at up to 25%, and gains may owe capital-gains tax (a 1031 exchange can defer both). Figures are a year-1 estimate at your 24.0% rate — not tax advice; consult a CPA.
Schools (NCES district)
- District
- Plum Borough SD
- NCES district ID
- 4219350
- Math proficiency
- 48% ▼ -13.00%
- Reading proficiency
- 63% ▼ -16.00%
- Median HH income
- $67,665
- Composite
- 48.98/100
- National rank
- #2073
- State rank
- #91 of 539 in PA
Livability — Plum
- Score
- 71/100
- State rank
- #730
- US rank
- #7292
Category grades
Schools grade is shown separately in the Schools card above.
Census & demographics
- Census place
- Plum, PA
- City population
- 21,414
- Population (ZIP)
- 21,414
Population outlook (Allegheny County) Hauer SSP2
- Today (2025)
- 1,250,282 people
- By 2030
- 1,256,482 · +0.5%
- By 2040
- 1,256,318 · +0.5%
- By 2050
- 1,244,169 · -0.5%
- By 2075
- 1,197,693 · -4.2%
- By 2100
- 1,093,187 · -12.6%
Race, ethnicity, and origin ACS 2023
- Neighborhood character
- Predominantly White (91%)
- Race & ethnicity
- White 91% Black 3% Two or more races 3% Asian 1% Hispanic / Latino 1%
- Common ancestry
- Romanian 7% Slovak 2% Serbian 2%
- Foreign-born
- 2% · Canada
- Languages at home
- 98% English-only · Other Indo-European 1% Spanish 1%
Political lean MEDSL · Allegheny
- 2024 margin
- Strong D (+20.3) · D 59.7% · R 39.4%
- 2008→2024 swing
- +4.8pp toward D · 2008: 15.5pp · 2024: 20.3pp
- All cycles
- 2024: D+20.3 2020: D+20.4 2016: D+16.4 2012: D+14.4 2008: D+15.5
Not yet ingested
- Civics
- —
Market trends
- HPI YoY
- ▼ -182.05%
- Current HPI
- 236.4886
- Rent YoY
- —
- Metro
- —
- State GDP YoY
- ▲ 1.68%
- F500 in state
- 34
Industry mix (Fortune 500 HQ in PA)
| Industry | F500 HQs | Revenue |
|---|---|---|
| Healthcare | 2 | $309B |
|
||
| Insurance | 2 | $27B |
|
||
| Telecommunications / Media | 1 | $124B |
|
||
| Industrial Distribution | 1 | $22B |
|
||
| Financial Services | 1 | $20B |
|
||
| Chemicals / Materials | 1 | $18B |
|
||
Price history
1 event — show timeline
- 2026-06-04 Listed $225,000 West Penn MLS
Property tax history
+2.5%/yrLatest (2026): $3,150 · +1.4% YoY. Source: county tax records.
Cash-flow waterfall
monthlySold comps — $/sqft
last 12 mo · ≤1 miLoading sold comps…