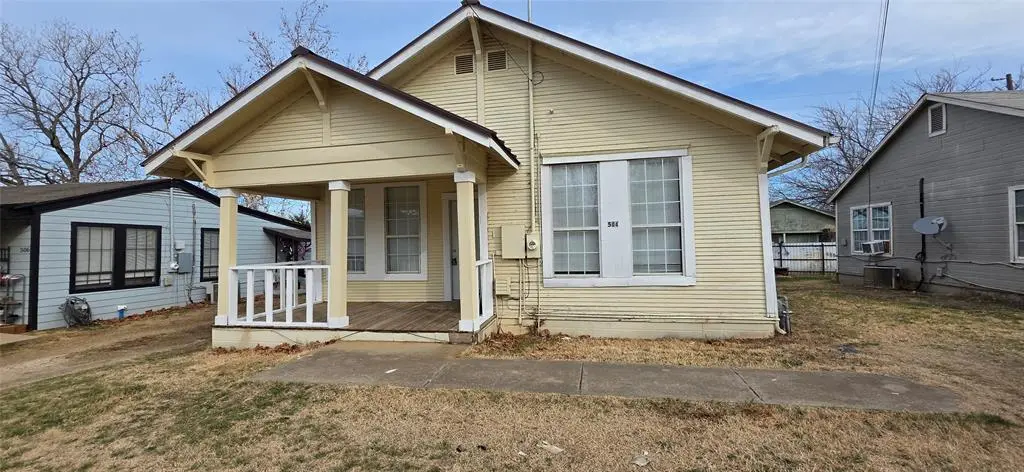
504 Bluebonnet St · Aubrey, TX
Flood risk 1/10 · Minimal
- FEMA flood zone
- X (unshaded)
- Chance of flooding over 30 yrs
- 0.0%
- Est. flood insurance / yr
- $507 – $1,088
Fire risk 6/10 · Moderate
- Est. fire insurance / yr
- $1,222 – $2,270
Heat risk 7/10 · Major
- Hot days now (above 109°F)
- 7 days/yr
- Hot days in 30 yrs
- 22 days/yr
Wind risk 5/10 · Moderate
- Chance of severe wind over 30 yrs
- 26.0%
Air-quality risk 3/10 · Minor
- Unhealthy air days now
- 3 days/yr
- Unhealthy air days in 30 yrs
- 4 days/yr
Risk factors via First Street. Map © Google.
Why this score? — see what drove the B- grade
The composite is a weighted blend of 9 inputs, each scored 0–100. Each bar is that input's sub-score; the figure is the points it added to the 100-point composite (weight × sub-score).
- Cash flow +26.1/30.0
- ARV discount +15.0/15.0
- DSCR +8.8/10.0
- 1% rule +6.1/10.0
- Schools +4.6/10.0
- Livability +3.6/5.0
- Condition / age +2.5/5.0
- Rent growth +2.0/5.0
- Appreciation +0.0/10.0
$169,000
🖨 Deal sheet 📄 Offer letter ✓ Due diligence
Listing remarks MLS
Cute three bedroom one bath home, metal roof, new carpet, updated windows. Aubrey ISD.
Key facts
- Metal roof
- New carpet
- Updated windows
Tags
Neighborhood map
What this means for you Summary
Snapshot
- This is a 3-bed/1.0-bath single-family listed at $169k.
Deal economics
- At list price, monthly cash flow is $427 ($5k/yr) — positive.
- The deal already cash-flows at list — no discount required.
- Meets the 1% rule at list price ($2k rent vs $169k).
- Recommended offer: $149k (12.0% below list) — sets the bar for market timing.
- Cap rate 9.3% vs local median 3.4% in Aubrey — top-decile yield for the area; either an underpriced asset or a hidden risk that comps aren't pricing in. Stress-test before assuming the spread holds.
Location & tenants
- Location reads 71/100 on livability (#332 in TX) — a middle-class / working-renter tenant base. Strengths: cost of living A+, housing A+, employment B; Watch: crime C-, amenities F, commute F.
- Aubrey ISD (rural): math 50% / reading 52% proficiency, ranked #119 of 826 in TX (top 14%) — acceptable for families but not a draw, mixed tenant base, ~2y average lease.
- Market conditions: Rents soft (-1.9%/yr); 1885 active listings in the ZIP; 11 comparable units currently listed for rent nearby; rentals at typical pace (median 25d on market — plan ~3-4 weeks tenant-placement turnaround); 45% of comp listings sitting > 30 days — soft ceiling on asking rent; high-income renter base; 10,531 units permitted in Denton County in 2024 (2,713 in 5+ unit buildings).
Forward outlook
- Local home prices are declining (-3.0%/yr); year-one equity from $1k of loan paydown is wiped out by about $5k of value loss. Plan a longer hold.
- Denton County population projected at +66% by 2050 — long-run rental-demand tailwind backs the buy-and-hold thesis.
Negotiation context
- It's been on market 127 days — a 12% lower offer ($149k) is reasonable based on typical stale-listing flexibility.
- 2 sale attempts since 18y ago; this cycle's ask has dropped $20k (11%) from the opening price — seller is motivated, your offer sets the floor, not the list.
Risks & watch-outs
- Watch-outs: built in 1950 — expect roof / HVAC / electrical / plumbing capex.
- Climate carrying-cost: moderate wind risk, 26% chance of damaging wind over 30y; major wildfire risk; extreme-heat days projected 7→22/yr by 2055 (HVAC capex compounding) — expect insurance premiums to compound above CPI over the hold.
Questions for the listing agent
- It's been on market 127 days. Have you received any prior offers? Is the seller open to a 12% concession, seller financing, or rate buy-down credit?
- Built in 1950 — when were the roof, HVAC, electrical panel, plumbing, and water heater last replaced?
- Why hasn't it sold? Are there any deal-killer items the seller is aware of (foundation, flood, title, zoning, code violations)?
- Is there a deadline driving the sale (1031 exchange, divorce, estate, relocation)? That informs how much negotiation room exists.
- What's the average days-on-market for RENTAL listings here right now (not sales)? A rising rental-DOM trend means longer vacancies and softer asking-rent achievability than the comps imply.
- What's the recent tenant-quality profile in this submarket — average credit score on applications, eviction rate, late-payment / NSF rate, and stable-employment percentage? A property-management company in the area should have these aggregated.
- How much new for-sale + rental construction is in the pipeline within 1–3 miles? Heavy new supply typically softens prices + rents 12–24 months out; constrained supply supports both.
Investment metrics
- 1% rule
- 1.11% ✓
- Cap rate
- 9.33%
- Cash-on-cash
- 10.83%
- DSCR
- 1.48
- GRM
- 7.5
CMA / ARV
- ARV (median comp)
- $262,448
- List price
- $169,000
- Delta
- -35.61%
- Verdict
- UNDERPRICED
- Comps
- 20 within 1.0 mi
Show comp detail 12 sales within ~0.75 mi
| Address | Dist | Beds/Ba | Sqft | Sold | Price | $/sf | Match |
|---|---|---|---|---|---|---|---|
| 707 Caddell St | 0.09mi | 3/1.0 | 1,089 (-3%) | 7mo | $235,000 | $216 | 85 |
| 803 Chestnut St | 0.35mi | 3/1.0 | 1,080 (-4%) | 14mo | $200,000 | $185 | 66 |
| 103 W Plum St | 0.31mi | 3/2.0 | 1,176 (+5%) | 10mo | $265,000 | $225 | 65 |
| 408 S Magnolia St | 0.38mi | 2/1.0 (-1) | 1,094 (-2%) | 15mo | $245,000 | $224 | 61 |
| 309 W Pecan St | 0.16mi | 3/2.0 | 1,224 (+9%) | 16mo | $282,000 | $230 | 60 |
| 301 E Pecan St | 0.36mi | 3/1.0 | 1,176 (+5%) | 24mo | $145,000 | $123 | 55 |
| 105 E North St | 0.69mi | 2/1.0 (-1) | 1,144 (+2%) | 5mo | $232,500 | $203 | 55 |
| 122 Highmeadow Rd | 0.46mi | 3/2.0 | 1,153 (+3%) | 18mo | $280,000 | $243 | 54 |
| 600 Mary St | 0.26mi | 2/1.0 (-1) | 972 (-13%) | 20mo | $158,000 | $163 | 44 |
| 305 Mimosa St | 0.68mi | 3/1.0 | 1,073 (-4%) | 22mo | $250,000 | $233 | 44 |
| 410 Tisdell Ln | 0.67mi | 2/2.0 (-1) | 1,120 (0%) | 23mo | $200,000 | $179 | 41 |
| 408 Demoye Ln | 0.60mi | 3/2.0 | 1,196 (+7%) | 23mo | $300,000 | $251 | 37 |
Match score weights: distance 35% · size 25% · config 20% · recency 20%. Top-matched comps best support the ARV.
Projected returns pro-forma
-3.0% appreciation · 0.0% rent growth · sell at horizon
- IRR
- -3.3%
- Equity multiple
- 0.88×
- Total profit
- $-5,709
- Equity at exit
- $25,198
- IRR
- 2.9%
- Equity multiple
- 1.18×
- Total profit
- $8,693
- Equity at exit
- $14,612
Cash invested: $47,320 (down + closing). Projections, not guarantees.
Landlord ↔ Tenant lean methodology
- Overall (STATE)
- 87 Strongly Landlord-Friendly
- State Texas
- 87 Strongly Landlord-Friendly · R+5
- County
- — inherits STATE
- City
- — inherits STATE
ZIP-level market 76227
- Home prices YoY
- -19.0%
- Rents YoY
- -1.9%
- Active inventory
- 1885
- Price-to-rent
- 7.5×
Monthly cashflow live
- Estimated rent
- $1,871 high interval (Pro) →
- Mortgage (P&I)
- −$886
- Tax from tax record
- −$94 /mo · $1,127/yr
- Insurance
- −$70
- HOA
- −$0
- Vacancy / Maint / Mgmt
- −$393
- Net cashflow
- $427
Break-even live
UW: 25.0% down · 7.5% · 30yr · 1.5% tax · 5.0% vac · 8.0% maint · 8.0% mgmt
Financing live
Cash to close
- Down payment
- $42,250
- Closing costs
- $5,070
- Reserves months
- —
- Total cash needed
- —
Loan-product check · same deal, 3 products live
Conventional
25% down · 7.5% · 30yr
- Down + closing
- —
- Monthly P&I
- —
- Monthly cashflow
- —
- DSCR
- —
- Eligible?
- —
Personal DTI + credit; lowest rate.
DSCR
20% down · 8.5% · 30yr
- Down + closing
- —
- Monthly P&I
- —
- Monthly cashflow
- —
- DSCR
- —
- Eligible?
- —
No personal income docs; deal must DSCR.
Hard money
10% down · 12.0% · 12mo
- Down + closing
- —
- Monthly P&I
- —
- Monthly cashflow
- —
- DSCR
- —
- Eligible?
- —
Short-term bridge; refi at stabilization.
Rent comps 11 comps
| Address | Beds | Baths | Sqft | Rent | $/sqft | DOM | Units | Dist |
|---|---|---|---|---|---|---|---|---|
| 601 Countryside Dr Aubrey, TX | 3.0 | 2.0 | 1500 | $1,700 | $1.13 | 4d | 1 | 0.27mi |
| 213 S Magnolia St Aubrey, TX | 2.0 | 2.5 | 1261 | $1,395 | $1.11 | 43d | 1 | 0.49mi |
| 215 Linda St Aubrey, TX | 3.0 | 2.0 | 1350 | $1,795 | $1.33 | 5d | 1 | 0.49mi |
| 215 Linda St Aubrey, TX | 3.0 | 2.0 | 1350 | $1,825 | $1.35 | 44d | 1 | 0.49mi |
| 229 Irick Ct Aubrey, TX | 3.0 | 2.5 | 1346 | $2,000 | $1.49 | 3d | 1 | 0.55mi |
| 502 Brumley Rd Krugerville, TX | 3.0 | 2.0 | 1470 | $1,895 | $1.29 | 43d | 1 | 0.95mi |
| 717 Presidio St Aubrey, TX | 3.0 | 2.0 | 1498 | $2,100 | $1.40 | 18d | 1 | 0.98mi |
| 2020 Belgian Dr Aubrey, TX | 3.0 | 2.0 | 1311 | $1,900 | $1.45 | 24d | 1 | 1.03mi |
| 933 King St Aubrey, TX | 3.0 | 2.0 | 1452 | $2,100 | $1.45 | 43d | 1 | 1.05mi |
| 2024 Sulky Ln Aubrey, TX | 3.0 | 2.0 | 1461 | $2,046 | $1.40 | 12d | 1 | 1.08mi |
| 2028 Sulky Ln Aubrey, TX | 3.0 | 2.0 | 1311 | $1,900 | $1.45 | 43d | 1 | 1.09mi |
Listing history 20 events
-
2026-06-18days on market $169,000 Active 127 DOM
-
2026-06-17days on market $169,000 Active 126 DOM
-
2026-06-16days on market $169,000 Active 125 DOM
-
2026-06-15days on market $169,000 Active 124 DOM
-
2026-06-13days on market $169,000 Active 122 DOM
-
2026-06-13days on market $169,000 Active 121 DOM
-
2026-06-09days on market $169,000 Active 118 DOM
-
2026-06-08days on market $169,000 Active 117 DOM
-
2026-06-07days on market $169,000 Active 116 DOM
-
2026-06-04days on market $169,000 Active 113 DOM
-
2026-06-03days on market $169,000 Active 112 DOM
-
2026-06-02days on market $169,000 Active 111 DOM
-
2026-06-01days on market $169,000 Active 110 DOM
-
2026-05-31days on market $169,000 Active 109 DOM
-
2026-05-05price $179,000 86-char remark
Show marketing remark (86 chars)
Cute three bedroom one bath home, metal roof, new carpet, updated windows. Aubrey ISD.
-
2026-04-14price $188,000 86-char remark
Show marketing remark (86 chars)
Cute three bedroom one bath home, metal roof, new carpet, updated windows. Aubrey ISD.
-
2026-02-11$189,000 Active 86-char remark
Show marketing remark (86 chars)
Cute three bedroom one bath home, metal roof, new carpet, updated windows. Aubrey ISD.
-
2008-11-24soldstatus 252-char remark
Show marketing remark (252 chars)
Very cute home in quiet neighborhood. Exterior newly painted, 3 bedrooms, 1 full bath, large kitchen with breakfast room, full size washer dryer connections in newly added laundry room. SOLD AS IS, NO WARRANTIES OR OPTION PERIOD, NO SELLERS DISCLOSURE.
-
2008-11-12historical 252-char remark
Show marketing remark (252 chars)
Very cute home in quiet neighborhood. Exterior newly painted, 3 bedrooms, 1 full bath, large kitchen with breakfast room, full size washer dryer connections in newly added laundry room. SOLD AS IS, NO WARRANTIES OR OPTION PERIOD, NO SELLERS DISCLOSURE.
-
2008-09-10$35,000 252-char remark
Show marketing remark (252 chars)
Very cute home in quiet neighborhood. Exterior newly painted, 3 bedrooms, 1 full bath, large kitchen with breakfast room, full size washer dryer connections in newly added laundry room. SOLD AS IS, NO WARRANTIES OR OPTION PERIOD, NO SELLERS DISCLOSURE.
ⓘ Source: listings_history table (triggers on properties + properties_extension) + one-shot
backfill from property_details.listing_events for pre-trigger history.
Tax reassessment forecast TX · Resets to sale price
- Current annual tax
- $1,127 · $94/mo
- Projected year-2 tax
- $3,093 · $258/mo
- Expected delta
- +$1,965/yr (+$164/mo · 174.3%)
ⓘ Screening estimate from a state-policy table — verify with the county assessor before closing.
Climate risk First Street
- Flood 1/10 Low FEMA zone X (unshaded) · 0% chance over 30 yrs
- Wildfire 6/10 Major
- Heat 7/10 Severe 7 d/yr ≥109°F today · 22 d/yr by 30 yrs out
- Wind 5/10 Major 26% chance of damaging wind over 30 yrs
- Air quality 3/10 Moderate 3 unhealthy d/yr today · 4 by 30 yrs out
Nearby sold comps map
Loading sold comps map…
Walkable amenities ~0.75 mi
Loading nearby amenities…
Taxation est. · year 1
- Rental income
- $22,446
- − Mortgage interest
- −$9,467
- − Property taxes
- −$1,127
- − Insurance
- −$845
- − Repairs & maintenance
- −$1,796
- − Management
- −$1,796
- − Depreciation
- −$4,916
- Taxable income
- $2,500
- Est. tax owed @ 24.0%
- −$600
- After-tax cash flow
- $4,525/yr
For passive investors: Depreciation is non-cash, so a rental often shows a tax loss while cash-flowing — sheltering income. Rental losses are passive: they offset passive income freely, and up to $25,000/yr can offset ordinary (W-2) income if you actively participate and your MAGI is under $100k (phasing out to $0 by $150k); unused losses carry forward. On sale, claimed depreciation is recaptured at up to 25%, and gains may owe capital-gains tax (a 1031 exchange can defer both). Figures are a year-1 estimate at your 24.0% rate — not tax advice; consult a CPA.
Schools (NCES district)
- District
- Aubrey ISD
- NCES district ID
- 4808910
- Math proficiency
- 50% ▼ -9.00%
- Reading proficiency
- 52% ▼ -3.00%
- Median HH income
- $77,154
- Composite
- 46.21/100
- National rank
- #2492
- State rank
- #119 of 826 in TX
Livability — Aubrey
- Score
- 71/100
- State rank
- #332
- US rank
- #7241
Category grades
Schools grade is shown separately in the Schools card above.
Census & demographics
- Census place
- Aubrey, TX
- County
- Denton County · 901,654 people
- City population
- 62,127
- Metro
- Dallas-Fort Worth-Arlington, TX
- Population (ZIP)
- 62,127
- Household income
- $111,402
- Rent vs Own
- Severe rent burden
- 959.0
Population outlook (Denton County) Hauer SSP2
- Today (2025)
- 1,053,010 people
- By 2030
- 1,192,269 · +13.2%
- By 2040
- 1,472,920 · +39.9%
- By 2050
- 1,746,506 · +65.9%
- By 2075
- 2,358,497 · +124.0%
- By 2100
- 2,779,183 · +163.9%
Race, ethnicity, and origin ACS 2023
- Neighborhood character
- Diverse neighborhood (Simpson 0.63)
- Race & ethnicity
- White 55% Black 19% Hispanic / Latino 17% Two or more races 13% Asian 4%
- Hispanic origin (detail)
- Mexican 12% Puerto Rican 1%
- Common ancestry
- Lithuanian 4% Slovak 2% Italian 1%
- Foreign-born
- 11% · Canada, Jamaica
- Languages at home
- 82% English-only · Spanish 10% Other Indo-European 2% Other Asian/Pacific 2%
Political lean MEDSL · Denton
- 2024 margin
- R (+13.2) · D 42.7% · R 55.8% · Other 1.5%
- 2008→2024 swing
- +11.0pp toward D · 2008: -24.2pp · 2024: -13.2pp
- All cycles
- 2024: R+13.2 2020: R+8.1 2016: R+20.2 2012: R+31.7 2008: R+24.2
Not yet ingested
- Civics
- —
Market trends
- HPI YoY
- ▼ -59.76%
- Current HPI
- 254.2895
- Rent YoY
- ▼ -1.88%
- Metro
- Dallas-Fort Worth-Arlington, TX
- State GDP YoY
- ▲ 3.95%
- F500 in state
- 110
Industry mix (Fortune 500 HQ in TX)
| Industry | F500 HQs | Revenue |
|---|---|---|
| Energy | 16 | $1,198B |
|
||
| Technology | 5 | $198B |
|
||
| Engineering / Construction | 4 | $72B |
|
||
| Energy Services | 3 | $60B |
|
||
| Utilities | 3 | $41B |
|
||
| Healthcare | 2 | $330B |
|
||
Price history
+411.4% since first listed6 events — show timeline
- 2026-05-05 Price Changed $179,000 NTREIS
- 2026-04-14 Price Changed $188,000 NTREIS
- 2026-02-11 Listed $189,000 NTREIS
- 2008-11-24 Sold (MLS) — NTREIS
- 2008-11-12 Listing Removed — NTREIS
- 2008-09-10 Listed $35,000 NTREIS
Property tax history
+3.7%/yrLatest (2025): $1,127 · -1.8% YoY. Source: county tax records.
Cash-flow waterfall
monthlySold comps — $/sqft
last 12 mo · ≤1 miLoading sold comps…