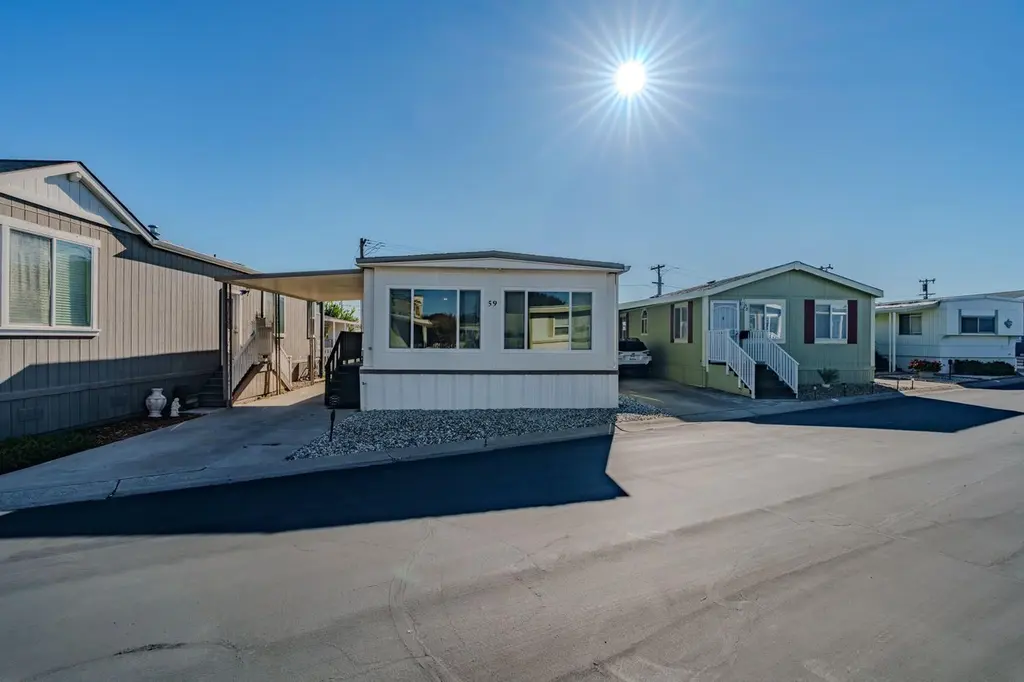
59 Oneida St · Oakley, CA
Flood risk 4/10 · Minor
- FEMA flood zone
- X (unshaded)
- Chance of flooding over 30 yrs
- 0.22%
- Est. flood insurance / yr
- $507 – $1,088
Fire risk 5/10 · Moderate
- Est. fire insurance / yr
- $659 – $1,223
Heat risk 6/10 · Moderate
- Hot days now (above 101°F)
- 7 days/yr
- Hot days in 30 yrs
- 14 days/yr
Wind risk 1/10 · Minimal
- Chance of severe wind over 30 yrs
- —
Air-quality risk 9/10 · Severe
- Unhealthy air days now
- 17 days/yr
- Unhealthy air days in 30 yrs
- 18 days/yr
Risk factors via First Street. Map © Google.
Why this score? — see what drove the C+ grade
The composite is a weighted blend of 9 inputs, each scored 0–100. Each bar is that input's sub-score; the figure is the points it added to the 100-point composite (weight × sub-score).
- Cash flow +30.0/30.0
- 1% rule +10.0/10.0
- DSCR +10.0/10.0
- Condition / age +4.0/5.0
- Schools +3.8/10.0
- Rent growth +3.4/5.0
- Livability +3.0/5.0
- ARV discount +0.0/15.0
- Appreciation +0.0/10.0
$139,000
🖨 Deal sheet (PDF) 📄 Offer letter ✓ Due diligence
Listing remarks
Immaculate Home in Desirable Eagle City Mobile Home Park (55+ Community)Step into this beautifully updated 2-bedroom, 2-bath home perfectly situated on a prime lot in one of the park's most sought-after locations. This home has been thoughtfully remodeled to combine modern finishes with comfortable living spaces. The kitchen is a true standout completely renovated with new easy to clean solid surface countertops, stainless steel appliances, custom cabinetry, and a spacious breakfast bar that opens to the main living area. The open layout offers excellent flow between the kitchen, dining, and family, enhanced by an abundance of natural light. Throughout the home, you'll find brand-new vinyl
Key facts
- Custom cabinetry
- Open layout
- Updated kitchen
Tags
Neighborhood map
What this means for you Summary
Snapshot
- This is a 2-bed/2.0-bath manufactured listed at $139k. Condition is rated good.
Deal economics
- At list price, monthly cash flow is $912 ($11k/yr) — positive.
- The deal already cash-flows at list — no discount required.
- Meets the 1% rule at list price ($2k rent vs $139k).
- Recommended offer: $122k (12.0% below list) — sets the bar for market timing.
- Cap rate 14.2% vs local median 3.3% in Oakley — top-decile yield for the area; either an underpriced asset or a hidden risk that comps aren't pricing in. Stress-test before assuming the spread holds.
Location & tenants
- Location reads 60/100 on livability (#608 in CA) — a middle-class / working-renter tenant base. Strengths: employment A+, housing A+, crime A; Watch: amenities F, commute F, cost of living F.
- Antioch Unified (suburban): math 29% / reading 55% proficiency, ranked #200 of 517 in CA (top 39%) — families likely to look elsewhere, expect single-tenant / working-renter base with shorter leases.
- Zoned schools: Orchard Park (716 students, 67% FRL); Deer Valley High (math 32% / reading 52%, grade F, #472 of 1,170 statewide, top 42%, 1,851 students, 71% FRL).
- Market conditions: Rents rising (+3.7%/yr); 243 active listings in the ZIP; 5 comparable units currently listed for rent nearby; rentals leasing fast (median 0d on market — plan ~1-2 weeks tenant-placement turnaround); high-income renter base; 2,169 units permitted in Contra Costa County in 2024 (896 in 5+ unit buildings).
Forward outlook
- Local home prices are declining (-3.0%/yr); year-one equity from $961 of loan paydown is wiped out by about $4k of value loss. Plan a longer hold.
- Contra Costa County population projected at +26% by 2050 — long-run rental-demand tailwind backs the buy-and-hold thesis.
- At projected returns (-3.0% appreciation + 3.7% rent growth), your $39k cash investment doubles in ~5 years — after that, you're playing with house money.
Negotiation context
- It's been on market 246 days — a 12% lower offer ($122k) is reasonable based on typical stale-listing flexibility.
Risks & watch-outs
- Climate carrying-cost: moderate wildfire risk; extreme-heat days projected 7→14/yr by 2055 (HVAC capex compounding) — expect insurance premiums to compound above CPI over the hold.
Questions for the listing agent
- It's been on market 246 days. Have you received any prior offers? Is the seller open to a 12% concession, seller financing, or rate buy-down credit?
- Built in 1968 — when were the roof, HVAC, electrical panel, plumbing, and water heater last replaced?
- Why hasn't it sold? Are there any deal-killer items the seller is aware of (foundation, flood, title, zoning, code violations)?
- Is there a deadline driving the sale (1031 exchange, divorce, estate, relocation)? That informs how much negotiation room exists.
- Schools are D-rated, which usually means shorter tenancies and higher turnover. Who's the typical renter profile here, and what's been the actual vacancy rate?
- What's the average days-on-market for RENTAL listings here right now (not sales)? A rising rental-DOM trend means longer vacancies and softer asking-rent achievability than the comps imply.
- What's the recent tenant-quality profile in this submarket — average credit score on applications, eviction rate, late-payment / NSF rate, and stable-employment percentage? A property-management company in the area should have these aggregated.
- How much new for-sale + rental construction is in the pipeline within 1–3 miles? Heavy new supply typically softens prices + rents 12–24 months out; constrained supply supports both.
Investment metrics
- 1% rule
- 1.71% ✓
- Cap rate
- 14.17%
- Cash-on-cash
- 28.12%
- DSCR
- 2.25
- GRM
- 4.9
CMA / ARV
- ARV (median comp)
- $110,000
- List price
- $139,000
- Delta
- 26.36%
- Verdict
- OVERPRICED
- Comps
- 7 within 1.0 mi
Show comp detail 4 sales within ~0.75 mi
| Address | Dist | Beds/Ba | Sqft | Sold | Price | $/sf | Match |
|---|---|---|---|---|---|---|---|
| 14 Geneseo St | 0.07mi | 2/2.0 | 1,020 (+8%) | 6mo | $184,950 | $181 | 78 |
| 69 Oneida St | 0.05mi | 2/2.0 | 960 (+2%) | 21mo | $180,000 | $188 | 77 |
| 24 Otsego St | 0.06mi | 2/2.0 | 1,080 (+15%) | 11mo | $199,500 | $185 | 63 |
| 105 Ontario St | 0.07mi | 3/2.0 (+1) | 1,040 (+11%) | 24mo | $190,000 | $183 | 54 |
Match score weights: distance 35% · size 25% · config 20% · recency 20%. Top-matched comps best support the ARV.
Projected returns pro-forma
-3.0% appreciation · 3.68% rent growth · sell at horizon
- IRR
- 23.1%
- Equity multiple
- 1.96×
- Total profit
- $37,230
- Equity at exit
- $20,725
- IRR
- 31.5%
- Equity multiple
- 3.93×
- Total profit
- $114,153
- Equity at exit
- $12,018
Cash invested: $38,920 (down + closing). Projections, not guarantees.
Landlord ↔ Tenant lean methodology
- Overall (STATE)
- 18 Strongly Tenant-Friendly
- State California
- 18 Strongly Tenant-Friendly · D+13
- County
- — inherits STATE
- City
- — inherits STATE
ZIP-level market 94561
- Rents YoY
- 3.7%
- Active inventory
- 243
- Price-to-rent
- 4.9×
Monthly cashflow live
- Estimated rent
- $2,370 high interval (Pro) →
- Mortgage (P&I)
- −$729
- Tax est. 1.5%
- −$174 /mo · $2,085/yr
- Insurance
- −$58
- HOA
- −$0
- Vacancy / Maint / Mgmt
- −$498
- Net cashflow
- $912
Break-even live
Sensitivity live
| Price | -10% $1,008 | -5% $960 | +0% $912 | +5% $864 | +10% $816 |
|---|---|---|---|---|---|
| Rent | -10% $725 | -5% $818 | +0% $912 | +5% $1,006 | +10% $1,099 |
| Rate | -1.0pp $982 | -0.5pp $947 | base $912 | +0.5pp $876 | +1.0pp $839 |
UW: 25.0% down · 7.5% · 30yr · 1.5% tax · 5.0% vac · 8.0% maint · 8.0% mgmt
Financing live
Cash to close
- Down payment
- $34,750
- Closing costs
- $4,170
- Reserves months
- —
- Total cash needed
- —
Loan-product check · same deal, 3 products live
Conventional
25% down · 7.5% · 30yr
- Down + closing
- —
- Monthly P&I
- —
- Monthly cashflow
- —
- DSCR
- —
- Eligible?
- —
Personal DTI + credit; lowest rate.
DSCR
20% down · 8.5% · 30yr
- Down + closing
- —
- Monthly P&I
- —
- Monthly cashflow
- —
- DSCR
- —
- Eligible?
- —
No personal income docs; deal must DSCR.
Hard money
10% down · 12.0% · 12mo
- Down + closing
- —
- Monthly P&I
- —
- Monthly cashflow
- —
- DSCR
- —
- Eligible?
- —
Short-term bridge; refi at stabilization.
Rent comps 5 comps
| Address | Beds | Baths | Sqft | Rent | $/sqft | DOM | Units | Dist |
|---|---|---|---|---|---|---|---|---|
| 49 Carol Ln Oakley, CA | 1.0–3.0 | 1.0–2.0 | 686 | $2,134 | $3.11 | 0d | 1 | 0.22mi |
| 69 Carol Ln Oakley, CA | 1.0–3.0 | 1.0–2.0 | 802 | $1,813 | $2.26 | 0d | 9 | 0.24mi |
| 4290 Mehaffey Way Oakley, CA | 2.0 | 2.0 | 750 | $2,295 | $3.06 | 3d | 1 | 0.95mi |
| 3560 E 18th St Antioch, CA | 1.0–3.0 | 1.0–2.0 | 828 | $1,954 | $2.36 | 5d | 1 | 1.28mi |
| 3560 E 18th St Antioch, CA | 1.0–3.0 | 1.0–2.0 | 828 | $1,772 | $2.14 | 0d | 9 | 1.28mi |
Listing history 15 events
-
2026-06-21days on market $139,000 Active 246 DOM
-
2026-06-18days on market $139,000 Active 243 DOM
-
2026-06-17days on market $139,000 Active 242 DOM
-
2026-06-16days on market $139,000 Active 241 DOM
-
2026-06-15days on market $139,000 Active 240 DOM
-
2026-06-13days on market $139,000 Active 238 DOM
-
2026-06-13days on market $139,000 Active 237 DOM
-
2026-06-09days on market $139,000 Active 234 DOM
-
2026-06-08days on market $139,000 Active 233 DOM
-
2026-06-07days on market $139,000 Active 232 DOM
-
2026-06-04days on market $139,000 Active 229 DOM
-
2026-06-03days on market $139,000 Active 228 DOM
-
2026-06-02days on market $139,000 Active 227 DOM
-
2026-06-01days on market $139,000 Active 226 DOM
-
2026-05-31days on market $139,000 Active 225 DOM
ⓘ Source: listings_history table (triggers on properties + properties_extension) + one-shot
backfill from property_details.listing_events for pre-trigger history.
Climate risk First Street
- Flood 4/10 Moderate FEMA zone X (unshaded) · 22% chance over 30 yrs
- Wildfire 5/10 Major
- Heat 6/10 Major 7 d/yr ≥101°F today · 14 d/yr by 30 yrs out
- Wind 1/10 Low
- Air quality 9/10 Extreme 17 unhealthy d/yr today · 18 by 30 yrs out
Nearby sold comps map
Loading sold comps map…
Walkable amenities ~0.75 mi
Loading nearby amenities…
Taxation est. · year 1
- Rental income
- $28,445
- − Mortgage interest
- −$7,786
- − Property taxes
- −$2,085
- − Insurance
- −$695
- − Repairs & maintenance
- −$2,276
- − Management
- −$2,276
- − Depreciation
- −$4,044
- Taxable income
- $9,284
- Est. tax owed @ 24.0%
- −$2,228
- After-tax cash flow
- $8,716/yr
For passive investors: Depreciation is non-cash, so a rental often shows a tax loss while cash-flowing — sheltering income. Rental losses are passive: they offset passive income freely, and up to $25,000/yr can offset ordinary (W-2) income if you actively participate and your MAGI is under $100k (phasing out to $0 by $150k); unused losses carry forward. On sale, claimed depreciation is recaptured at up to 25%, and gains may owe capital-gains tax (a 1031 exchange can defer both). Figures are a year-1 estimate at your 24.0% rate — not tax advice; consult a CPA.
Condition & rehab AI · 12 photos
This well-maintained and updated manufactured home in a desirable park offers a good investment opportunity with minimal repairs needed.
Value-add opportunities
- Both Painting exterior and interior — Enhances curb appeal and interior aesthetics.
- Both Landscaping improvements — Enhances curb appeal and adds value.
- Resale New flooring in bathrooms — Improves the look and feel of the bathrooms.
Renovation cost estimate screening
Value-add ROI direction
- Both Painting exterior and interior — Enhances curb appeal and interior aesthetics. ↑
- Both Landscaping improvements — Enhances curb appeal and adds value. ↑
- Resale New flooring in bathrooms — Improves the look and feel of the bathrooms. ↑
ⓘ Cost ranges are severity-bucket heuristics (US national rule-of-thumb). Get contractor quotes + a written scope before underwriting a rehab budget.
Schools (NCES district)
- District
- Antioch Unified
- NCES district ID
- 0602850
- Math proficiency
- 29% ▲ 12.00%
- Reading proficiency
- 55% ▲ 25.00%
- Median HH income
- $65,935
- Composite
- 37.57/100
- National rank
- #4386
- State rank
- #200 of 517 in CA
Livability — Oakley
- Score
- 60/100
- State rank
- #608
- US rank
- #19421
Category grades
Schools grade is shown separately in the Schools card above.
Census & demographics
- Census place
- Oakley, CA
- County
- Contra Costa County · 1,059,880 people
- City population
- 46,368
- Metro
- San Francisco-Oakland-Berkeley, CA
- Population (ZIP)
- 46,368
- Household income
- $134,678
- Rent vs Own
- Severe rent burden
- 614.0
Population outlook (Contra Costa County) Hauer SSP2
- Today (2025)
- 1,287,720 people
- By 2030
- 1,364,937 · +6.0%
- By 2040
- 1,506,209 · +17.0%
- By 2050
- 1,624,373 · +26.1%
- By 2075
- 1,853,193 · +43.9%
- By 2100
- 1,901,231 · +47.6%
Race, ethnicity, and origin ACS 2023
- Neighborhood character
- Diverse neighborhood (Simpson 0.69)
- Race & ethnicity
- White 43% Hispanic / Latino 34% Two or more races 15% Asian 9% Black 9%
- Hispanic origin (detail)
- Mexican 25% Puerto Rican 1%
- Common ancestry
- Italian 2% Russian 2% Slovak 2%
- Foreign-born
- 18% · Canada, China
- Languages at home
- 70% English-only · Spanish 21% Tagalog/Filipino 4% Other Indo-European 3%
Political lean MEDSL · Contra Costa
- 2024 margin
- Solid D (+38.0) · D 67.3% · R 29.4% · Other 3.3%
- 2008→2024 swing
- +0.2pp no change · 2008: 37.8pp · 2024: 38.0pp
- All cycles
- 2024: D+38.0 2020: D+45.3 2016: D+43.5 2012: D+33.7 2008: D+37.8
Not yet ingested
- Civics
- —
Market trends
- HPI YoY
- ▼ -249.42%
- Current HPI
- 301.9916
- Rent YoY
- ▲ 3.68%
- Metro
- San Francisco-Oakland-Berkeley, CA
- State GDP YoY
- ▲ 3.21%
- F500 in state
- 116
Industry mix (Fortune 500 HQ in CA)
| Industry | F500 HQs | Revenue |
|---|---|---|
| Technology | 27 | $1,492B |
|
||
| Financial Services | 3 | $174B |
|
||
| Retail | 3 | $44B |
|
||
| Insurance | 3 | $26B |
|
||
| Media / Entertainment | 2 | $115B |
|
||
| Pharmaceuticals / Biotech | 2 | $62B |
|
||
Cash-flow waterfall
monthlySold comps — $/sqft
last 12 mo · ≤1 miLoading sold comps…