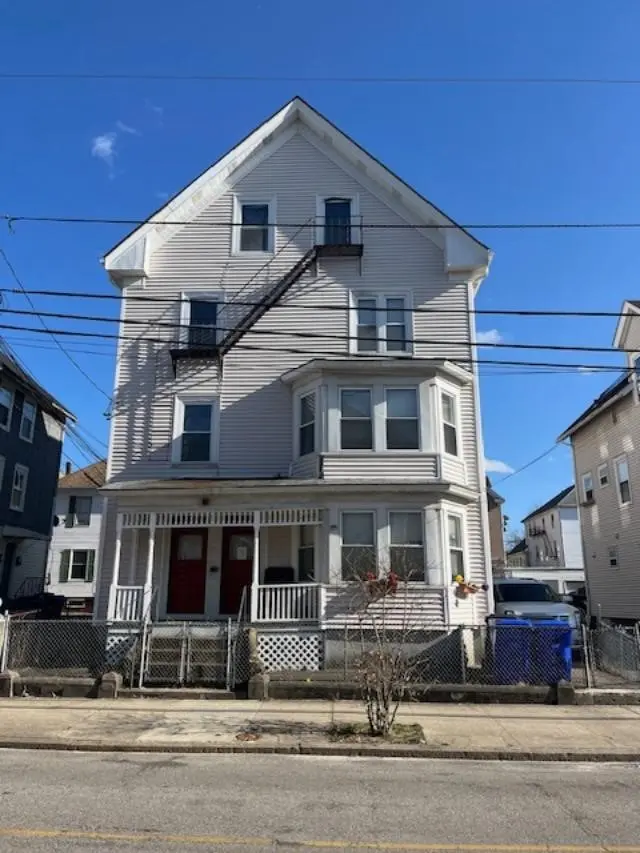
 Fourplex
128 130 Summer St · Central Falls, RI
Flood risk 5/10 · Moderate
- FEMA flood zone
- X (unshaded)
- Chance of flooding over 30 yrs
- 0.53%
- Est. flood insurance / yr
- $473 – $860
Fire risk 1/10 · Minimal
- Est. fire insurance / yr
- $835 – $1,551
Heat risk 6/10 · Moderate
- Hot days now (above 96°F)
- 7 days/yr
- Hot days in 30 yrs
- 15 days/yr
Wind risk 6/10 · Moderate
- Chance of severe wind over 30 yrs
- 70.0%
Air-quality risk 2/10 · Minimal
- Unhealthy air days now
- 1 days/yr
- Unhealthy air days in 30 yrs
- 2 days/yr
Risk factors via First Street. Map © Google.
Why this score? — see what drove the C- grade
The composite is a weighted blend of 9 inputs, each scored 0–100. Each bar is that input's sub-score; the figure is the points it added to the 100-point composite (weight × sub-score).
- Cash flow +20.8/30.0
- Appreciation +7.3/10.0
- DSCR +6.6/10.0
- ARV discount +6.3/15.0
- 1% rule +5.5/10.0
- Livability +3.3/5.0
- Rent growth +2.5/5.0
- Condition / age +2.2/5.0
- Schools +0.4/10.0
$749,000
🖨 Deal sheet 📄 Offer letter ✓ Due diligence
Multi-family units
County records classify this as Multi-Family (2-4 Unit). Listing-text estimate: 4 units. confirmed
Listing remarks MLS
REMARKABLE 4 FAMILY HOUSE WITH 3 BEDS EACH FLOOR, VINYL SIDING , REPLACEMENT WINDOWS, ALL FIRE CODED, PARKING SPACES FOR 7 OR 8 CARS, ROOF ONLY 9-10 YRS YOUNG.
Key facts
- Separate utilities
- New hardwood floors
- Parking for ten cars
Tags
Neighborhood map
What this means for you Summary
Snapshot
- This is a 4 × 3-bed/1.0-bath units multifamily listed at $749k. Condition is rated fair.
Deal economics
- At list price, monthly cash flow is $1k ($12k/yr) — positive. Per door: $258/mo.
- The deal already cash-flows at list — no discount required.
- Meets the 1% rule at list price ($8k rent vs $749k).
- Cap rate 7.9% vs local median 5.2% in Central Falls — top-decile yield for the area; either an underpriced asset or a hidden risk that comps aren't pricing in. Stress-test before assuming the spread holds.
Location & tenants
- Location reads 66/100 on livability (#21 in RI) — a middle-class / working-renter tenant base. Strengths: health & safety A+, cost of living A, housing B; Watch: schools F, amenities F, commute F.
- Central Falls (suburban): math 2% / reading 8% proficiency, ranked #38 of 39 in RI (top 97%) — low school quality limits family demand, transient renter base, plan for 1-2y turnover; 78% free/reduced lunch — lower-income household profile, screen leases tightly.
- Market conditions: 33 active listings in the ZIP; 776 units permitted in Providence County in 2024 (229 in 5+ unit buildings).
- At $7,859/mo this rent would consume 191% of the median local household income ($49k/yr) (locally 1380% of renters already pay >50% of income on rent) — very limited rent-growth headroom before tenants either downsize or default.
Forward outlook
- In year one you build about $39k of equity ($5k loan paydown + $34k appreciation (4.6% local appreciation)).
- Providence County population projected at +5% by 2050 — modest demand growth; plan on rents tracking national, not racing it.
- At projected returns (4.6% appreciation + 3.0% rent growth), your $210k cash investment doubles in ~4 years — after that, you're playing with house money.
- By year 2, paydown + projected appreciation supports a ~$63k cash-out refi (75% LTV) — recoverable capital for the next deal without selling this one.
Negotiation context
- Only 12 days on market — expect competitive offers; lowballing is unlikely to land.
- 2 sale attempts since 24y ago with the ask held roughly flat each time — persistent listings suggest the price (not the market) is what's stuck; bring a comps-based counter.
- Current owner paid $215k; list at $749k implies a 248% gain — meaningful room to come down on a strong offer.
Risks & watch-outs
- Watch-outs: built in 1900 — expect roof / HVAC / electrical / plumbing capex.
- Climate carrying-cost: moderate flood risk; major wind risk, 70% chance of damaging wind over 30y; extreme-heat days projected 7→15/yr by 2055 (HVAC capex compounding) — expect insurance premiums to compound above CPI over the hold.
Questions for the listing agent
- Can we see the unit-by-unit rent roll, current vacancy, and any below-market leases? What's the average tenancy length?
- What capital expenditures (roof, boiler, parking lot, exteriors) have been made in the last 5 years, and what's planned in the next 2?
- Have any recent inspections been done? Can we get a copy of the seller's disclosures and any deferred-maintenance estimates?
- Built in 1900 — when were the roof, HVAC, electrical panel, plumbing, and water heater last replaced?
- Is there a deadline driving the sale (1031 exchange, divorce, estate, relocation)? That informs how much negotiation room exists.
- Schools are F-rated, which usually means shorter tenancies and higher turnover. Who's the typical renter profile here, and what's been the actual vacancy rate?
- What's the average days-on-market for RENTAL listings here right now (not sales)? A rising rental-DOM trend means longer vacancies and softer asking-rent achievability than the comps imply.
- What's the recent tenant-quality profile in this submarket — average credit score on applications, eviction rate, late-payment / NSF rate, and stable-employment percentage? A property-management company in the area should have these aggregated.
- How much new apartment / multifamily construction is in the pipeline within 1–3 miles? Heavy new supply (>2% of stock underway) typically softens rents 12–24 months out; light construction supports rent growth.
Investment metrics
- 1% rule
- 1.05% ✓
- Cap rate
- 7.95%
- Cash-on-cash
- 5.91%
- DSCR
- 1.26
- GRM
- 7.9
CMA / ARV
- ARV (on-the-fly)
- $729,472
- Comps found
- 3
Show comp detail 3 sales within ~0.75 mi
| Address | Dist | Beds/Ba | Sqft | Sold | Price | $/sf | Match |
|---|---|---|---|---|---|---|---|
| 128 130 Summer St | 0.00mi | 12/4.0 | 4,448 (0%) | 1mo | $750,000 | $169 | 100 |
| 145 147 Hedley Ave | 0.25mi | 12/4.5 | 4,740 (+7%) | 15mo | $626,000 | $132 | 63 |
| 678 High St | 0.57mi | 11/5.0 (-1) | 4,116 (-8%) | 20mo | $675,000 | $164 | 35 |
Match score weights: distance 35% · size 25% · config 20% · recency 20%. Top-matched comps best support the ARV.
Projected returns pro-forma
4.58% appreciation · 3.0% rent growth · sell at horizon
- IRR
- 16.9%
- Equity multiple
- 2.05×
- Total profit
- $220,449
- Equity at exit
- $405,236
- IRR
- 17.4%
- Equity multiple
- 3.95×
- Total profit
- $618,906
- Equity at exit
- $683,990
Cash invested: $209,720 (down + closing). Projections, not guarantees.
Landlord ↔ Tenant lean methodology
- Overall (STATE)
- 31 Tenant-Leaning
- State Rhode Island
- 31 Tenant-Leaning · D+8
- County
- — inherits STATE
- City
- — inherits STATE
ZIP-level market 02863
- Home prices YoY
- 1.2%
- Active inventory
- 33
- Price-to-rent
- 31.8×
Monthly cashflow live
- Estimated rent
- $7,859 high interval (Pro) →
- Mortgage (P&I)
- −$3,928
- Tax est. 1.5%
- −$936 /mo · $11,235/yr
- Insurance
- −$312
- HOA
- −$0
- Vacancy / Maint / Mgmt
- −$1,650
- Net cashflow
- $1,032
Break-even live
4-unit breakdown (identical units grouped — click to expand)
| Units | Beds | Baths | Est. rent |
|---|---|---|---|
| 4× units | 3 | 1 | $7,860 |
| #1 | 3 | 1 | $1,965 |
| #2 | 3 | 1 | $1,965 |
| #3 | 3 | 1 | $1,965 |
| #4 | 3 | 1 | $1,965 |
| Total (4 units) | $7,859 | ||
UW: 25.0% down · 7.5% · 30yr · 1.5% tax · 5.0% vac · 8.0% maint · 8.0% mgmt
Financing live
Cash to close
- Down payment
- $187,250
- Closing costs
- $22,470
- Reserves months
- —
- Total cash needed
- —
Loan-product check · same deal, 3 products live
Conventional
25% down · 7.5% · 30yr
- Down + closing
- —
- Monthly P&I
- —
- Monthly cashflow
- —
- DSCR
- —
- Eligible?
- —
Personal DTI + credit; lowest rate.
DSCR
20% down · 8.5% · 30yr
- Down + closing
- —
- Monthly P&I
- —
- Monthly cashflow
- —
- DSCR
- —
- Eligible?
- —
No personal income docs; deal must DSCR.
Hard money
10% down · 12.0% · 12mo
- Down + closing
- —
- Monthly P&I
- —
- Monthly cashflow
- —
- DSCR
- —
- Eligible?
- —
Short-term bridge; refi at stabilization.
Listing history 5 events
-
2026-04-13status Pending
-
2026-04-01$749,000 Active
-
2002-07-31soldstatus $215,000 159-char remark
Show marketing remark (159 chars)
REMARKABLE 4 FAMILY HOUSE WITH 3 BEDS EACH FLOOR, VINYL SIDING , REPLACEMENT WINDOWS, ALL FIRE CODED, PARKING SPACES FOR 7 OR 8 CARS, ROOF ONLY 9-10 YRS YOUNG.
-
2002-06-04historical 159-char remark
Show marketing remark (159 chars)
REMARKABLE 4 FAMILY HOUSE WITH 3 BEDS EACH FLOOR, VINYL SIDING , REPLACEMENT WINDOWS, ALL FIRE CODED, PARKING SPACES FOR 7 OR 8 CARS, ROOF ONLY 9-10 YRS YOUNG.
-
2002-05-29$225,000 159-char remark
Show marketing remark (159 chars)
REMARKABLE 4 FAMILY HOUSE WITH 3 BEDS EACH FLOOR, VINYL SIDING , REPLACEMENT WINDOWS, ALL FIRE CODED, PARKING SPACES FOR 7 OR 8 CARS, ROOF ONLY 9-10 YRS YOUNG.
ⓘ Source: listings_history table (triggers on properties + properties_extension) + one-shot
backfill from property_details.listing_events for pre-trigger history.
Climate risk First Street
- Flood 5/10 Major FEMA zone X (unshaded) · 53% chance over 30 yrs
- Wildfire 1/10 Low
- Heat 6/10 Major 7 d/yr ≥96°F today · 15 d/yr by 30 yrs out
- Wind 6/10 Major 70% chance of damaging wind over 30 yrs
- Air quality 2/10 Low 1 unhealthy d/yr today · 2 by 30 yrs out
Nearby sold comps map
Loading sold comps map…
Walkable amenities ~0.75 mi
Loading nearby amenities…
Taxation est. · year 1
- Rental income
- $94,308
- − Mortgage interest
- −$41,956
- − Property taxes
- −$11,235
- − Insurance
- −$3,745
- − Repairs & maintenance
- −$7,545
- − Management
- −$7,545
- − Depreciation
- −$21,789
- Taxable income
- $494
- Est. tax owed @ 24.0%
- −$119
- After-tax cash flow
- $12,271/yr
For passive investors: Depreciation is non-cash, so a rental often shows a tax loss while cash-flowing — sheltering income. Rental losses are passive: they offset passive income freely, and up to $25,000/yr can offset ordinary (W-2) income if you actively participate and your MAGI is under $100k (phasing out to $0 by $150k); unused losses carry forward. On sale, claimed depreciation is recaptured at up to 25%, and gains may owe capital-gains tax (a 1031 exchange can defer both). Figures are a year-1 estimate at your 24.0% rate — not tax advice; consult a CPA.
Condition & rehab AI · 14 photos
The property is a four-family home in fair condition with moderate repairs and maintenance needed. Painting the exterior siding and interior walls, replacing the HVAC filters, and updating the kitchen and bathroom fixtures would significantly increase its resale and rental value.
Repairs flagged
- Minor Kitchen cabinets — The cabinets show signs of wear and tear, but are still functional.
- Minor Bathroom fixtures — The fixtures show signs of wear and tear, but are still functional.
- Minor Exterior paint — The paint on the exterior siding shows signs of wear and tear, but is still functional.
- Minor Interior paint — The paint on the interior walls shows signs of wear and tear, but is still functional.
- Minor Windows — The windows show signs of wear and tear, but are still functional.
- Minor HVAC filters — The HVAC filters need to be replaced to ensure proper functioning.
Value-add opportunities
- Resale Painting the exterior siding — Painting the exterior siding can improve the curb appeal and increase the home's resale value.
- Resale Painting the interior walls — Painting the interior walls can improve the home's appearance and increase the resale value.
- Rental Replacing the HVAC filters — Replacing the HVAC filters can improve the home's air quality and increase its rental value.
- Resale Replacing the kitchen cabinets — Replacing the kitchen cabinets can improve the home's appearance and increase the resale value.
- Resale Replacing the bathroom fixtures — Replacing the bathroom fixtures can improve the home's appearance and increase the resale value.
Renovation cost estimate screening
| Repair item | Severity | Est. cost |
|---|---|---|
| Kitchen cabinets · The cabinets show signs of wear and tear, but are still functional. | Minor | $500–3,000 |
| Bathroom fixtures · The fixtures show signs of wear and tear, but are still functional. | Minor | $500–3,000 |
| Exterior paint · The paint on the exterior siding shows signs of wear and tear, but is still functional. | Minor | $500–3,000 |
| Interior paint · The paint on the interior walls shows signs of wear and tear, but is still functional. | Minor | $500–3,000 |
| Windows · The windows show signs of wear and tear, but are still functional. | Minor | $500–3,000 |
| HVAC filters · The HVAC filters need to be replaced to ensure proper functioning. | Minor | $500–3,000 |
| Total estimated repair cost · 6 items | $3,000–18,000 |
Value-add ROI direction
- Resale Painting the exterior siding — Painting the exterior siding can improve the curb appeal and increase the home's resale value. ↑
- Resale Painting the interior walls — Painting the interior walls can improve the home's appearance and increase the resale value. ↑
- Rental Replacing the HVAC filters — Replacing the HVAC filters can improve the home's air quality and increase its rental value. ↑
- Resale Replacing the kitchen cabinets — Replacing the kitchen cabinets can improve the home's appearance and increase the resale value. ↑
- Resale Replacing the bathroom fixtures — Replacing the bathroom fixtures can improve the home's appearance and increase the resale value. ↑
ⓘ Cost ranges are severity-bucket heuristics (US national rule-of-thumb). Get contractor quotes + a written scope before underwriting a rehab budget.
Schools (NCES district)
- District
- Central Falls
- NCES district ID
- 4400120
- Math proficiency
- 2% ▼ -6.00%
- Reading proficiency
- 8% ▼ -5.00%
- Median HH income
- $30,478
- Composite
- 3.59/100
- National rank
- #10071
- State rank
- #38 of 39 in RI
Livability — Central Falls
- Score
- 66/100
- State rank
- #21
- US rank
- #11321
Category grades
Schools grade is shown separately in the Schools card above.
Census & demographics
- Census place
- Central Falls, RI
- County
- Providence County · 548,917 people
- City population
- 22,701
- Metro
- Providence-Warwick, RI-MA
- Population (ZIP)
- 22,701
- Household income
- $49,285
- Rent vs Own
- Severe rent burden
- 1380.0
Population outlook (Providence County) Hauer SSP2
- Today (2025)
- 653,469 people
- By 2030
- 660,819 · +1.1%
- By 2040
- 672,747 · +3.0%
- By 2050
- 683,741 · +4.6%
- By 2075
- 720,435 · +10.2%
- By 2100
- 741,582 · +13.5%
Race, ethnicity, and origin ACS 2023
- Neighborhood character
- Predominantly Hispanic (69%)
- Race & ethnicity
- Hispanic / Latino 69% Two or more races 29% White 16% Black 8%
- Hispanic origin (detail)
- Mexican 6% Puerto Rican 15% Dominican 7%
- Common ancestry
- Lithuanian 4% Russian 4% Romanian 1%
- Foreign-born
- 40% · Canada, Jamaica
- Languages at home
- 29% English-only · Spanish 62% Other Indo-European 5% French/Haitian/Cajun 3%
Political lean MEDSL · Providence
- 2024 margin
- D (+14.4) · D 56.1% · R 41.7% · Other 2.2%
- 2008→2024 swing
- -20.0pp toward R · 2008: 34.4pp · 2024: 14.4pp
- All cycles
- 2024: D+14.4 2020: D+22.9 2016: D+21.2 2012: D+34.9 2008: D+34.4
Not yet ingested
- Civics
- —
Market trends
- HPI YoY
- ▲ 4.58%
- Current HPI
- 373.2598
- Rent YoY
- —
- Metro
- Providence-Warwick, RI-MA
- State GDP YoY
- ▲ 2.25%
- F500 in state
- 10
Industry mix (Fortune 500 HQ in RI)
| Industry | F500 HQs | Revenue |
|---|---|---|
| Healthcare | 1 | $373B |
|
||
| Food Distribution | 1 | $31B |
|
||
| Aerospace / Defense | 1 | $14B |
|
||
| Financial Services | 1 | $8B |
|
||
| Consumer Goods | 1 | $4B |
|
||
Price history
+232.9% since first listed5 events — show timeline
- 2026-04-13 Pending — RIS
- 2026-04-01 Listed $749,000 RIS
- 2002-07-31 Sold (MLS) $215,000 RIS
- 2002-06-04 Listing Removed — RIS
- 2002-05-29 Listed $225,000 RIS
Cash-flow waterfall
monthlySold comps — $/sqft
last 12 mo · ≤1 miLoading sold comps…