 Triplex
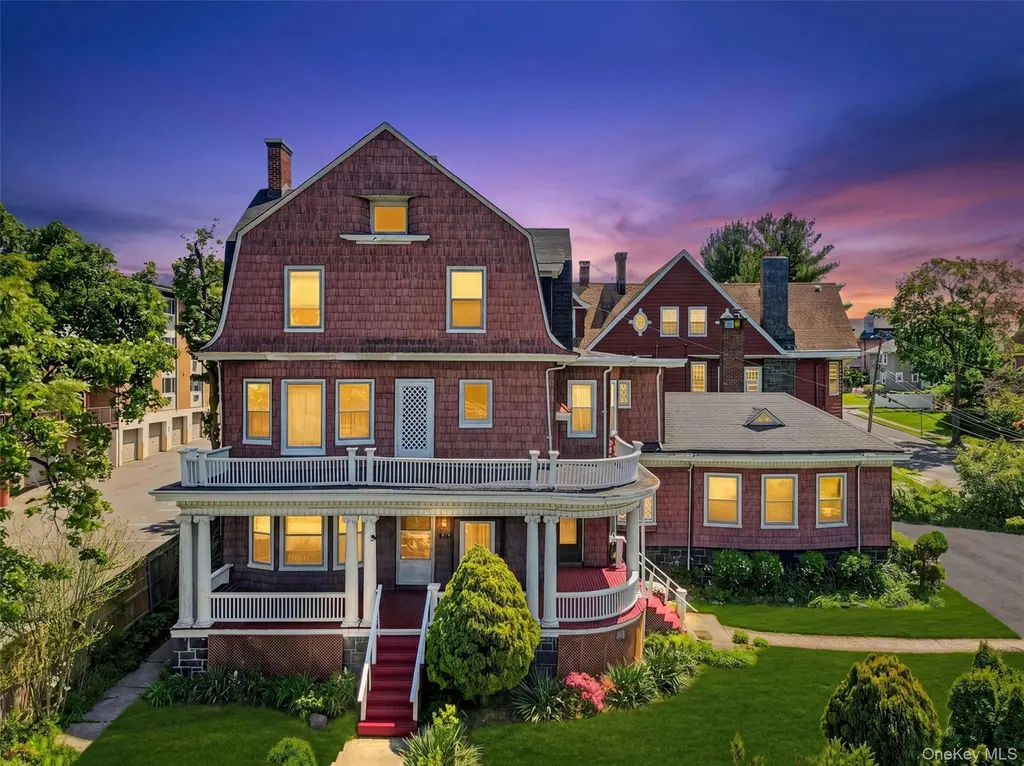
354 Palisade Ave · Yonkers, NY
Flood risk 1/10 · Minimal
- FEMA flood zone
- X (unshaded)
- Chance of flooding over 30 yrs
- 0.0%
- Est. flood insurance / yr
- $507 – $1,088
Fire risk 1/10 · Minimal
- Est. fire insurance / yr
- $691 – $1,283
Heat risk 6/10 · Moderate
- Hot days now (above 101°F)
- 7 days/yr
- Hot days in 30 yrs
- 15 days/yr
Wind risk 6/10 · Moderate
- Chance of severe wind over 30 yrs
- 27.0%
Air-quality risk 3/10 · Minor
- Unhealthy air days now
- 3 days/yr
- Unhealthy air days in 30 yrs
- 4 days/yr
Risk factors via First Street. Map © Google.
Why this score? — see what drove the B- grade
The composite is a weighted blend of 9 inputs, each scored 0–100. Each bar is that input's sub-score; the figure is the points it added to the 100-point composite (weight × sub-score).
- Cash flow +26.2/30.0
- ARV discount +15.0/15.0
- DSCR +8.9/10.0
- 1% rule +5.6/10.0
- Schools +4.1/10.0
- Livability +3.4/5.0
- Rent growth +2.5/5.0
- Condition / age +2.5/5.0
- Appreciation +0.0/10.0
$950,000
🖨 Deal sheet (PDF) 📄 Offer letter ✓ Due diligence
Multi-family units
County records classify this as Multi-Family (2-4 Unit). Listing-text estimate: 3 units. confirmed
Listing remarks
Step into this property with unmatched scale and Architectural character at 354 Palisade Avenue. Built in 1898, this grand triplex is a rare find in today’s market, offering the perfect blend of historic "old world charm" and incredible investment upside for the buyer. Space You Can’t Find in Modern Builds The defining feature of this property is the sheer size of its living spaces. Each unit is designed with exceptionally large rooms and high ceilings, focusing on expansive 3-bedroom layouts. From the original woodwork to the classic proportions typical of the late 19th century, the "old world" architectural details provide a sturdy and elegant foundation
Key facts
- Expansive layouts
- Large rooms
- High ceilings
Tags
Property features AI
Exterior
- Parking: Driveway; 6 off-street parking spaces
- Utilities: Con-Edison electric; Public sewer; Electricity connected; Water connected; Public trash collection
- Home design: Triplex
- Construction: Frame construction; Full unfinished basement with walk-out access and storage space
- Exterior features: Frame construction; Not waterfront
Interior
- Kitchen: Eat-in kitchen
- Bedrooms: 3 bedrooms
- Flooring: Carpet; Wood
- Bathrooms: 3 full bathrooms
- Heating & cooling: Steam heating; No central cooling
- Interior features: First-floor bedroom; First-floor full bathroom; Beamed ceilings; Cathedral ceilings; Crown molding; Eat-in kitchen; High ceilings; Natural woodwork; Original details; Washer/dryer hookup
- Laundry & utility: Laundry in basement; Washer/dryer hookup
Neighborhood map
What this means for you Summary
Snapshot
- This is a 3 × 3-bed/1.0-bath units multifamily listed at $950k.
Deal economics
- At list price, monthly cash flow is $2k ($29k/yr) — positive. Per door: $807/mo.
- The deal already cash-flows at list — no discount required.
- Meets the 1% rule at list price ($10k rent vs $950k).
- Cap rate 9.4% vs local median 5.4% in Yonkers — top-decile yield for the area; either an underpriced asset or a hidden risk that comps aren't pricing in. Stress-test before assuming the spread holds.
Location & tenants
- Location reads 68/100 on livability (#528 in NY) — a middle-class / working-renter tenant base. Strengths: employment A, commute B; Watch: amenities F, cost of living F.
- Yonkers City School District (suburban): math 41% / reading 54% proficiency, ranked #413 of 590 in NY (top 70%) — families likely to look elsewhere, expect single-tenant / working-renter base with shorter leases; 64% free/reduced lunch — lower-income household profile, screen leases tightly.
- Zoned schools: Yonkers Early Childhood Academy (327 students, 72% FRL); Yonkers Middle School (math 17% / reading 37%, grade F, #587 of 729 statewide, top 81%, 601 students, 88% FRL); Yonkers High School (math 92% / reading 88%, grade A+, #238 of 1,100 statewide, top 23%, 1,060 students, 76% FRL) — zoned schools average 79% FRL vs 64% district-wide (15 pts higher); higher-poverty schools than district average — tighter screening recommended.
- Market conditions: 77 active listings in the ZIP; solid renter incomes; 954 units permitted in Westchester County in 2024 (649 in 5+ unit buildings).
- At $10,117/mo this rent would consume 135% of the median local household income ($90k/yr) (locally 1216% of renters already pay >50% of income on rent) — very limited rent-growth headroom before tenants either downsize or default.
Forward outlook
- Local home prices are declining (-3.0%/yr); year-one equity from $7k of loan paydown is wiped out by about $28k of value loss. Plan a longer hold.
- Westchester County population projected at +10% by 2050 — modest demand growth; plan on rents tracking national, not racing it.
- At projected returns (-3.0% appreciation + 3.0% rent growth), your $266k cash investment doubles in ~10 years — after that, you're playing with house money.
Negotiation context
- Only 4 days on market — expect competitive offers; lowballing is unlikely to land.
- Current owner paid $155k; list at $950k implies a 513% gain — meaningful room to come down on a strong offer.
Risks & watch-outs
- Watch-outs: built in 1898 — expect roof / HVAC / electrical / plumbing capex.
- Climate carrying-cost: major wind risk, 27% chance of damaging wind over 30y; extreme-heat days projected 7→15/yr by 2055 (HVAC capex compounding) — expect insurance premiums to compound above CPI over the hold.
Questions for the listing agent
- Can we see the unit-by-unit rent roll, current vacancy, and any below-market leases? What's the average tenancy length?
- What capital expenditures (roof, boiler, parking lot, exteriors) have been made in the last 5 years, and what's planned in the next 2?
- Built in 1898 — when were the roof, HVAC, electrical panel, plumbing, and water heater last replaced?
- Is there a deadline driving the sale (1031 exchange, divorce, estate, relocation)? That informs how much negotiation room exists.
- What's the average days-on-market for RENTAL listings here right now (not sales)? A rising rental-DOM trend means longer vacancies and softer asking-rent achievability than the comps imply.
- What's the recent tenant-quality profile in this submarket — average credit score on applications, eviction rate, late-payment / NSF rate, and stable-employment percentage? A property-management company in the area should have these aggregated.
- How much new apartment / multifamily construction is in the pipeline within 1–3 miles? Heavy new supply (>2% of stock underway) typically softens rents 12–24 months out; light construction supports rent growth.
Investment metrics
- 1% rule
- 1.06% ✓
- Cap rate
- 9.35%
- Cash-on-cash
- 10.92%
- DSCR
- 1.49
- GRM
- 7.8
CMA / ARV
- ARV (median comp)
- $1,556,623
- List price
- $950,000
- Delta
- -38.97%
- Verdict
- UNDERPRICED
- Comps
- 20 within 1.0 mi
Show comp detail 2 sales within ~0.75 mi
| Address | Dist | Beds/Ba | Sqft | Sold | Price | $/sf | Match |
|---|---|---|---|---|---|---|---|
| 141 Vineyard Ave | 0.31mi | 8/5.0 (-1) | 3,328 (-15%) | 4mo | $1,050,000 | $316 | 44 |
| 32 Yonkers Ave | 0.71mi | 8/4.0 (-1) | 4,300 (+10%) | 4mo | $860,000 | $200 | 38 |
Match score weights: distance 35% · size 25% · config 20% · recency 20%. Top-matched comps best support the ARV.
Projected returns pro-forma
-3.0% appreciation · 3.0% rent growth · sell at horizon
- IRR
- -0.0%
- Equity multiple
- 1.00×
- Total profit
- $-191
- Equity at exit
- $141,648
- IRR
- 9.6%
- Equity multiple
- 1.74×
- Total profit
- $196,540
- Equity at exit
- $82,139
Cash invested: $266,000 (down + closing). Projections, not guarantees.
Landlord ↔ Tenant lean methodology
- Overall (CITY)
- 5 Strongly Tenant-Friendly
- State New York
- 15 Strongly Tenant-Friendly · D+10
- County
- — inherits STATE
- City Yonkers
- 5 Strongly Tenant-Friendly · D+20
ZIP-level market 10703
- Home prices YoY
- -13.2%
- Active inventory
- 77
- Price-to-rent
- 23.5×
Monthly cashflow live
- Estimated rent
- $10,117 high interval (Pro) →
- Mortgage (P&I)
- −$4,982
- Tax from tax record
- −$193 /mo · $2,322/yr
- Insurance
- −$396
- HOA
- −$0
- Lot rent
- −$0
- Vacancy / Maint / Mgmt
- −$2,125
- Net cashflow
- $2,421
Break-even live
Sensitivity live
| Price | -10% $2,959 | -5% $2,690 | +0% $2,421 | +5% $2,152 | +10% $1,883 |
|---|---|---|---|---|---|
| Rent | -10% $1,622 | -5% $2,022 | +0% $2,421 | +5% $2,821 | +10% $3,220 |
| Rate | -1.0pp $2,900 | -0.5pp $2,663 | base $2,421 | +0.5pp $2,175 | +1.0pp $1,925 |
3-unit breakdown (identical units grouped — click to expand)
| Units | Beds | Baths | Est. rent |
|---|---|---|---|
| 3× units | 3 | 1 | $10,116 |
| #1 | 3 | 1 | $3,372 |
| #2 | 3 | 1 | $3,372 |
| #3 | 3 | 1 | $3,372 |
| Total (3 units) | $10,117 | ||
UW: 25.0% down · 7.5% · 30yr · 1.5% tax · 5.0% vac · 8.0% maint · 8.0% mgmt
Financing live
Cash to close
- Down payment
- $237,500
- Closing costs
- $28,500
- Reserves months
- —
- Total cash needed
- —
Loan-product check · same deal, 3 products live
Conventional
25% down · 7.5% · 30yr
- Down + closing
- —
- Monthly P&I
- —
- Monthly cashflow
- —
- DSCR
- —
- Eligible?
- —
Personal DTI + credit; lowest rate.
DSCR
20% down · 8.5% · 30yr
- Down + closing
- —
- Monthly P&I
- —
- Monthly cashflow
- —
- DSCR
- —
- Eligible?
- —
No personal income docs; deal must DSCR.
Hard money
10% down · 12.0% · 12mo
- Down + closing
- —
- Monthly P&I
- —
- Monthly cashflow
- —
- DSCR
- —
- Eligible?
- —
Short-term bridge; refi at stabilization.
Listing history 4 events
-
2026-06-07statusdays on market $950,000 Pending 4 DOM
-
2026-05-15$950,000 Active 1130-char remark
-
1998-10-26soldstatus $155,000
-
1985-12-05soldstatus $90,000
ⓘ Source: listings_history table (triggers on properties + properties_extension) + one-shot
backfill from property_details.listing_events for pre-trigger history.
Tax reassessment forecast NY · Partial reset (capped growth)
- Current annual tax
- $2,322 · $193/mo
- Projected year-2 tax
- $9,188 · $766/mo
- Expected delta
- +$6,867/yr (+$572/mo · 295.7%)
ⓘ Screening estimate from a state-policy table — verify with the county assessor before closing.
Climate risk First Street
- Flood 1/10 Low FEMA zone X (unshaded) · 0% chance over 30 yrs
- Wildfire 1/10 Low
- Heat 6/10 Major 7 d/yr ≥101°F today · 15 d/yr by 30 yrs out
- Wind 6/10 Major 27% chance of damaging wind over 30 yrs
- Air quality 3/10 Moderate 3 unhealthy d/yr today · 4 by 30 yrs out
Nearby sold comps map
Loading sold comps map…
Walkable amenities ~0.75 mi
Loading nearby amenities…
Taxation est. · year 1
- Rental income
- $121,404
- − Mortgage interest
- −$53,215
- − Property taxes
- −$2,322
- − Insurance
- −$4,750
- − Repairs & maintenance
- −$9,712
- − Management
- −$9,712
- − Depreciation
- −$27,636
- Taxable income
- $14,056
- Est. tax owed @ 24.0%
- −$3,374
- After-tax cash flow
- $25,681/yr
For passive investors: Depreciation is non-cash, so a rental often shows a tax loss while cash-flowing — sheltering income. Rental losses are passive: they offset passive income freely, and up to $25,000/yr can offset ordinary (W-2) income if you actively participate and your MAGI is under $100k (phasing out to $0 by $150k); unused losses carry forward. On sale, claimed depreciation is recaptured at up to 25%, and gains may owe capital-gains tax (a 1031 exchange can defer both). Figures are a year-1 estimate at your 24.0% rate — not tax advice; consult a CPA.
Schools (NCES district)
- District
- Yonkers City School District
- NCES district ID
- 3631920
- Math proficiency
- 41% ▼ -1.00%
- Reading proficiency
- 54% ▲ 14.00%
- Median HH income
- $58,042
- Composite
- 41.43/100
- National rank
- #3471
- State rank
- #413 of 590 in NY
Livability — Yonkers
- Score
- 68/100
- State rank
- #528
- US rank
- #9394
Category grades
Schools grade is shown separately in the Schools card above.
Census & demographics
- Census place
- Yonkers, NY
- County
- Westchester County · 709,332 people
- City population
- 212,407
- Metro
- New York-Newark-Jersey City, NY-NJ-PA
- Population (ZIP)
- 22,586
- Household income
- $89,773
- Rent vs Own
- Severe rent burden
- 1216.0
Population outlook (Westchester County) Hauer SSP2
- Today (2025)
- 1,028,035 people
- By 2030
- 1,051,636 · +2.3%
- By 2040
- 1,098,520 · +6.9%
- By 2050
- 1,136,044 · +10.5%
- By 2075
- 1,196,925 · +16.4%
- By 2100
- 1,175,147 · +14.3%
Race, ethnicity, and origin ACS 2023
- Neighborhood character
- Diverse neighborhood (Simpson 0.69)
- Race & ethnicity
- Hispanic / Latino 43% White 30% Black 19% Two or more races 16% Asian 5%
- Hispanic origin (detail)
- Mexican 5% Puerto Rican 9% Dominican 13%
- Common ancestry
- Romanian 4% Russian 2% Subsaharan African 1%
- Foreign-born
- 32% · Canada, Jamaica, China
- Languages at home
- 50% English-only · Spanish 37% Other Indo-European 5% Russian/Polish/Slavic 2%
Political lean MEDSL · Westchester
- 2024 margin
- Strong D (+26.3) · D 63.1% · R 36.9%
- 2008→2024 swing
- -1.3pp toward R · 2008: 27.6pp · 2024: 26.3pp
- All cycles
- 2024: D+26.3 2020: D+36.3 2016: D+32.8 2012: D+22.2 2008: D+27.6
Not yet ingested
- Civics
- —
Market trends
- HPI YoY
- ▼ -47.22%
- Current HPI
- 311.0396
- Rent YoY
- —
- Metro
- New York-Newark-Jersey City, NY-NJ-PA
- State GDP YoY
- ▲ 2.60%
- F500 in state
- 92
Industry mix (Fortune 500 HQ in NY)
| Industry | F500 HQs | Revenue |
|---|---|---|
| Financial Services | 10 | $950B |
|
||
| Consumer Goods | 9 | $162B |
|
||
| Insurance | 4 | $225B |
|
||
| Telecommunications | 2 | $144B |
|
||
| Pharmaceuticals | 2 | $112B |
|
||
| Media / Entertainment | 2 | $69B |
|
||
Price history
+955.6% since first listed4 events — show timeline
- 2026-06-05 Pending — OneKey® MLS as Distributed by MLS Grid
- 2026-05-15 Listed $950,000 OneKey® MLS as Distributed by MLS Grid
- 1998-10-26 Sold (Public Records) $155,000 Public Records
- 1985-12-05 Sold (Public Records) $90,000 Public Records
Property tax history
-23.3%/yrLatest (2025): $2,322 · -0.3% YoY. Source: county tax records.
Cash-flow waterfall
monthlySold comps — $/sqft
last 12 mo · ≤1 miLoading sold comps…