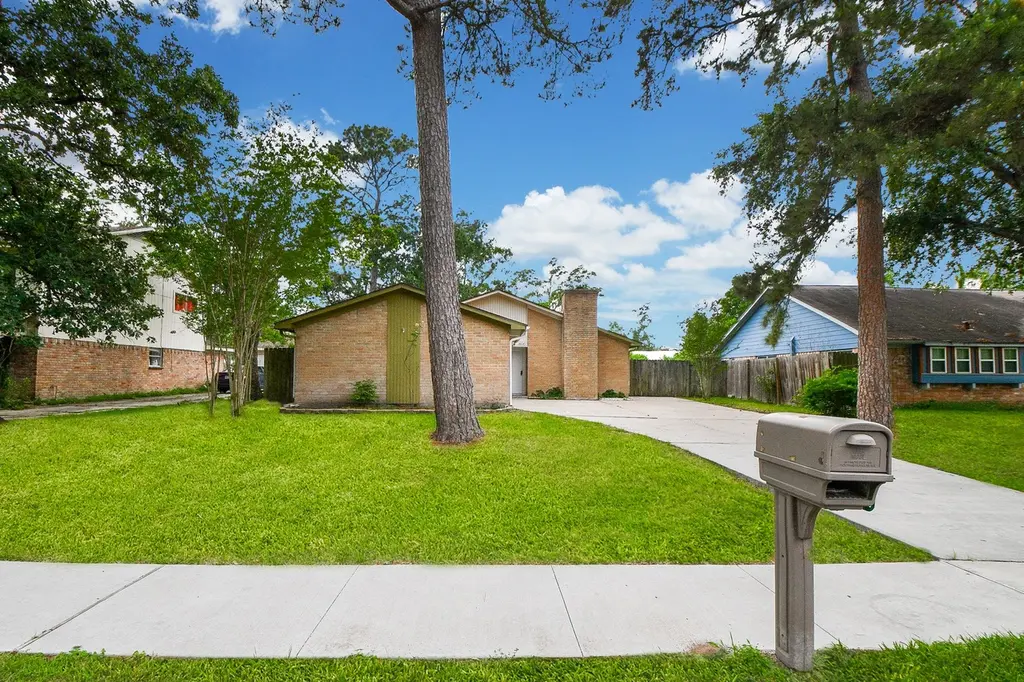
17058 Gleneagle Dr S · The Woodlands, TX
Flood risk 1/10 · Minimal
- FEMA flood zone
- X (unshaded)
- Chance of flooding over 30 yrs
- 0.0%
- Est. flood insurance / yr
- $507 – $1,088
Fire risk 4/10 · Minor
- Est. fire insurance / yr
- $1,222 – $2,270
Heat risk 9/10 · Severe
- Hot days now (above 111°F)
- 7 days/yr
- Hot days in 30 yrs
- 25 days/yr
Wind risk 8/10 · Major
- Chance of severe wind over 30 yrs
- 99.0%
Air-quality risk 3/10 · Minor
- Unhealthy air days now
- 2 days/yr
- Unhealthy air days in 30 yrs
- 3 days/yr
Risk factors via First Street. Map © Google.
Why this score? — see what drove the C- grade
The composite is a weighted blend of 9 inputs, each scored 0–100. Each bar is that input's sub-score; the figure is the points it added to the 100-point composite (weight × sub-score).
- Cash flow +13.9/30.0
- ARV discount +12.5/15.0
- Schools +5.1/10.0
- Livability +4.5/5.0
- DSCR +4.2/10.0
- 1% rule +4.1/10.0
- Rent growth +3.5/5.0
- Condition / age +2.5/5.0
- Appreciation +0.0/10.0
$250,000
🖨 Deal sheet 📄 Offer letter ✓ Due diligence
Listing remarks MLS
A great opportunity to enjoy comfort, convenience, and value in a well located home. Conveniently located near I-45 and SH 242, with quick access to shopping, dinning, medical facilities, and the main amenities of The Woodlands area. 17058 Gleneagles Dr S features tile flooring throughout, offering durability and easy maintenance, a bright open living area with abundant natural light and a wet bar, and a generous back yard for outdoor activities, gardening, or future enhancements.
Key facts
- 9,278 sq ft lot
- 2 garage spots
- Built 1978
Neighborhood map
What this means for you Summary
Snapshot
- This is a 3-bed/2.0-bath single-family listed at $250k.
Deal economics
- At list price, monthly cash flow is $28 ($336/yr) — positive.
- The deal already cash-flows at list — no discount required.
- To meet the 1% rule (rent ≥ 1% of price), the offer needs to be $228k (8.9% below list).
- Recommended offer: $228k (8.9% below list) — sets the bar for 1% rule.
- Cap rate 6.4% vs local median 2.3% in The Woodlands — top-decile yield for the area; either an underpriced asset or a hidden risk that comps aren't pricing in. Stress-test before assuming the spread holds.
Location & tenants
- Location reads 91/100 on livability (#1 in TX, #47 nationally) — a professional / high-income tenant draw. Strengths: schools A+, amenities A+, commute A+; Watch: cost of living D-.
- Conroe ISD (other): math 57% / reading 57% proficiency, ranked #69 of 826 in TX (top 8%) — acceptable for families but not a draw, mixed tenant base, ~2y average lease.
- Market conditions: Rents rising (+3.9%/yr); 316 active listings in the ZIP; 15 comparable units currently listed for rent nearby; rentals leasing fast (median 14d on market — plan ~1-2 weeks tenant-placement turnaround); high-income renter base; 13,259 units permitted in Montgomery County in 2024 (1,402 in 5+ unit buildings).
Forward outlook
- Local home prices are declining (-3.0%/yr); year-one equity from $2k of loan paydown is wiped out by about $8k of value loss. Plan a longer hold.
- Montgomery County population projected at +65% by 2050 — long-run rental-demand tailwind backs the buy-and-hold thesis.
Negotiation context
- It's been on market 55 days — a 3% lower offer ($242k) is reasonable based on typical stale-listing flexibility.
- 5 sale attempts since 7y ago with the ask held roughly flat each time — persistent listings suggest the price (not the market) is what's stuck; bring a comps-based counter.
Risks & watch-outs
- Climate carrying-cost: severe wind risk, 99% chance of damaging wind over 30y; extreme-heat days projected 7→25/yr by 2055 (HVAC capex compounding) — expect insurance premiums to compound above CPI over the hold.
Questions for the listing agent
- It's been on market 55 days. Have you received any prior offers? Is the seller open to a 9% concession, seller financing, or rate buy-down credit?
- Built in 1978 — when were the roof, HVAC, electrical panel, plumbing, and water heater last replaced?
- Is there a deadline driving the sale (1031 exchange, divorce, estate, relocation)? That informs how much negotiation room exists.
- Schools are A-rated — typically a magnet for longer-tenancy family renters. What's the average tenant stay here, and is there a school-zone premium baked into asking?
- What's the average days-on-market for RENTAL listings here right now (not sales)? A rising rental-DOM trend means longer vacancies and softer asking-rent achievability than the comps imply.
- What's the recent tenant-quality profile in this submarket — average credit score on applications, eviction rate, late-payment / NSF rate, and stable-employment percentage? A property-management company in the area should have these aggregated.
- How much new for-sale + rental construction is in the pipeline within 1–3 miles? Heavy new supply typically softens prices + rents 12–24 months out; constrained supply supports both.
Investment metrics
- 1% rule
- 0.91% ✗
- Cap rate
- 6.43%
- Cash-on-cash
- 0.48%
- DSCR
- 1.02
- GRM
- 9.1
CMA / ARV
- ARV (median comp)
- $281,283
- List price
- $250,000
- Delta
- -11.12%
- Verdict
- UNDERPRICED
- Comps
- 20 within 1.0 mi
Show comp detail 12 sales within ~0.75 mi
| Address | Dist | Beds/Ba | Sqft | Sold | Price | $/sf | Match |
|---|---|---|---|---|---|---|---|
| 9863 Swan Ct | 0.07mi | 3/1.5 | 1,810 (-4%) | 3mo | $265,000 | $146 | 86 |
| 17119 Spindle Oaks Dr | 0.11mi | 4/2.5 (+1) | 1,819 (-3%) | 4mo | $360,000 | $198 | 79 |
| 9257 Inland Leather Ln | 0.43mi | 3/2.0 | 1,687 (-10%) | 0mo | $337,000 | $200 | 62 |
| 17015 Ash Leaf Way | 0.66mi | 4/2.0 (+1) | 1,915 (+2%) | 3mo | $360,000 | $188 | 59 |
| 17027 Shy Leaf Ct | 0.67mi | 4/2.0 (+1) | 1,935 (+3%) | 6mo | $360,000 | $186 | 54 |
| 17254 Rookery Ct | 0.53mi | 3/2.0 | 2,118 (+12%) | 2mo | $375,000 | $177 | 53 |
| 123 Genesee Ridge Dr | 0.69mi | 4/2.0 (+1) | 1,942 (+3%) | 7mo | $399,000 | $205 | 52 |
| 1410 Glenoaks Dr | 0.46mi | 3/2.5 | 1,646 (-12%) | 4mo | $274,900 | $167 | 52 |
| 16875 Pink Wintergreen Dr | 0.54mi | 3/2.5 | 2,132 (+13%) | 1mo | $305,000 | $143 | 50 |
| 16817 Pink Wintergreen Dr | 0.45mi | 4/2.5 (+1) | 2,122 (+13%) | 4mo | $319,990 | $151 | 48 |
| 17105 Upland Bent Ct | 0.45mi | 4/2.5 (+1) | 2,107 (+12%) | 5mo | $349,000 | $166 | 48 |
| 17169 Upland Bent Ct | 0.56mi | 4/2.5 (+1) | 2,161 (+15%) | 2mo | $369,999 | $171 | 40 |
Match score weights: distance 35% · size 25% · config 20% · recency 20%. Top-matched comps best support the ARV.
Projected returns pro-forma
-3.0% appreciation · 3.88% rent growth · sell at horizon
- IRR
- -14.5%
- Equity multiple
- 0.48×
- Total profit
- $-36,634
- Equity at exit
- $37,276
- IRR
- -4.3%
- Equity multiple
- 0.70×
- Total profit
- $-20,858
- Equity at exit
- $21,615
Cash invested: $70,000 (down + closing). Projections, not guarantees.
Landlord ↔ Tenant lean methodology
- Overall (STATE)
- 87 Strongly Landlord-Friendly
- State Texas
- 87 Strongly Landlord-Friendly · R+5
- County
- — inherits STATE
- City
- — inherits STATE
ZIP-level market 77385
- Home prices YoY
- -27.5%
- Rents YoY
- 3.9%
- Active inventory
- 316
- Price-to-rent
- 9.1×
Monthly cashflow live
- Estimated rent
- $2,278 high interval (Pro) →
- Mortgage (P&I)
- −$1,311
- Tax from tax record
- −$356 /mo · $4,277/yr
- Insurance
- −$104
- HOA
- −$0
- Vacancy / Maint / Mgmt
- −$478
- Net cashflow
- $28
Break-even live
UW: 25.0% down · 7.5% · 30yr · 1.5% tax · 5.0% vac · 8.0% maint · 8.0% mgmt
Financing live
Cash to close
- Down payment
- $62,500
- Closing costs
- $7,500
- Reserves months
- —
- Total cash needed
- —
Loan-product check · same deal, 3 products live
Conventional
25% down · 7.5% · 30yr
- Down + closing
- —
- Monthly P&I
- —
- Monthly cashflow
- —
- DSCR
- —
- Eligible?
- —
Personal DTI + credit; lowest rate.
DSCR
20% down · 8.5% · 30yr
- Down + closing
- —
- Monthly P&I
- —
- Monthly cashflow
- —
- DSCR
- —
- Eligible?
- —
No personal income docs; deal must DSCR.
Hard money
10% down · 12.0% · 12mo
- Down + closing
- —
- Monthly P&I
- —
- Monthly cashflow
- —
- DSCR
- —
- Eligible?
- —
Short-term bridge; refi at stabilization.
Rent comps 15 comps
| Address | Beds | Baths | Sqft | Rent | $/sqft | DOM | Units | Dist |
|---|---|---|---|---|---|---|---|---|
| 17116 Harpers Trce Conroe, TX | 1.0–3.0 | 1.0–2.0 | 1083 | $1,948 | $1.80 | 1d | 28 | 0.32mi |
| 9295 Inland Leather Ln Conroe, TX | 4.0 | 2.5 | 2497 | $2,400 | $0.96 | 2d | 1 | 0.44mi |
| 9819 Kiwi Ln Conroe, TX | 4.0 | 2.0 | 1434 | $1,826 | $1.27 | 7d | 1 | 0.59mi |
| 17706 Sea Rosemary Ct Conroe, TX | 4.0 | 4.0 | 2425 | $2,895 | $1.19 | 43d | 1 | 0.72mi |
| 373 N Centro Cir Conroe, TX | 3.0 | 2.5 | 1619 | $2,286 | $1.41 | 22d | 1 | 1.08mi |
| 16782 N Thrasher Dr Conroe, TX | 4.0 | 2.5 | 2137 | $2,065 | $0.97 | 13d | 1 | 1.09mi |
| 357 N Centro Cir Conroe, TX | 3.0 | 2.5 | 1619 | $2,436 | $1.50 | 7d | 1 | 1.09mi |
| 18624 Whimsic Aly Conroe, TX | 4.0 | 4.0 | 2013 | $2,416 | $1.20 | 43d | 1 | 1.11mi |
| 18403 Idyllic Aly Conroe, TX | 4.0 | 4.0 | 1619 | $1,931 | $1.19 | 43d | 1 | 1.14mi |
| 18415 Idyllic Aly Conroe, TX | 4.0 | 4.0 | 2013 | $2,256 | $1.12 | 7d | 1 | 1.15mi |
| 305 N Centro Cir Conroe, TX | 3.0 | 2.5 | 1487 | $2,481 | $1.67 | 5d | 1 | 1.15mi |
| 446 S Centro Cir Conroe, TX | 3.0 | 2.5 | 1619 | $2,451 | $1.51 | 22d | 1 | 1.15mi |
| 18419 Idyllic Aly Conroe, TX | 4.0 | 4.0 | 2013 | $2,341 | $1.16 | 7d | 1 | 1.15mi |
| 418 S Centro Cir Conroe, TX | 3.0 | 2.5 | 1461 | $1,876 | $1.28 | 22d | 1 | 1.18mi |
| 18334 W Centro Cir Conroe, TX | 3.0 | 2.5 | 1619 | $2,136 | $1.32 | 22d | 1 | 1.19mi |
Listing history 30 events
-
2026-06-18days on market $250,000 Active 55 DOM
-
2026-06-17days on market $250,000 Active 54 DOM
-
2026-06-16days on market $250,000 Active 53 DOM
-
2026-06-15days on market $250,000 Active 52 DOM
-
2026-06-13days on market $250,000 Active 50 DOM
-
2026-06-09days on market $250,000 Active 46 DOM
-
2026-06-08days on market $250,000 Active 45 DOM
-
2026-06-07days on market $250,000 Active 44 DOM
-
2026-06-04days on market $250,000 Active 41 DOM
-
2026-06-03days on market $250,000 Active 40 DOM
-
2026-06-02days on market $250,000 Active 39 DOM
-
2026-06-01days on market $250,000 Active 38 DOM
-
2026-05-31days on market $250,000 Active 37 DOM
-
2026-04-25status Active 485-char remark
Show marketing remark (485 chars)
A great opportunity to enjoy comfort, convenience, and value in a well located home. Conveniently located near I-45 and SH 242, with quick access to shopping, dinning, medical facilities, and the main amenities of The Woodlands area. 17058 Gleneagles Dr S features tile flooring throughout, offering durability and easy maintenance, a bright open living area with abundant natural light and a wet bar, and a generous back yard for outdoor activities, gardening, or future enhancements.
-
2026-04-16historical 485-char remark
Show marketing remark (485 chars)
A great opportunity to enjoy comfort, convenience, and value in a well located home. Conveniently located near I-45 and SH 242, with quick access to shopping, dinning, medical facilities, and the main amenities of The Woodlands area. 17058 Gleneagles Dr S features tile flooring throughout, offering durability and easy maintenance, a bright open living area with abundant natural light and a wet bar, and a generous back yard for outdoor activities, gardening, or future enhancements.
-
2026-04-16historical $250,000 485-char remark
Show marketing remark (485 chars)
A great opportunity to enjoy comfort, convenience, and value in a well located home. Conveniently located near I-45 and SH 242, with quick access to shopping, dinning, medical facilities, and the main amenities of The Woodlands area. 17058 Gleneagles Dr S features tile flooring throughout, offering durability and easy maintenance, a bright open living area with abundant natural light and a wet bar, and a generous back yard for outdoor activities, gardening, or future enhancements.
-
2026-02-17historical
-
2025-12-24status Active
-
2025-12-14status Pending
-
2025-11-06$250,000 Active
-
2019-03-28soldstatus Sold
-
2019-03-28soldstatus
-
2019-03-26status Pending
-
2019-03-21status Option Pending
-
2019-03-01status Active
-
2019-01-31status Pending
-
2019-01-29price $130,000
-
2019-01-23$145,000 Active
-
2006-12-01soldstatus
-
1999-10-29soldstatus
ⓘ Source: listings_history table (triggers on properties + properties_extension) + one-shot
backfill from property_details.listing_events for pre-trigger history.
Tax reassessment forecast TX · Resets to sale price
- Current annual tax
- $4,277 · $356/mo
- Projected year-2 tax
- $4,575 · $381/mo
- Expected delta
- +$298/yr (+$25/mo · 7.0%)
ⓘ Screening estimate from a state-policy table — verify with the county assessor before closing.
Climate risk First Street
- Flood 1/10 Low FEMA zone X (unshaded) · 0% chance over 30 yrs
- Wildfire 4/10 Moderate
- Heat 9/10 Extreme 7 d/yr ≥111°F today · 25 d/yr by 30 yrs out
- Wind 8/10 Severe 99% chance of damaging wind over 30 yrs
- Air quality 3/10 Moderate 2 unhealthy d/yr today · 3 by 30 yrs out
Nearby sold comps map
Loading sold comps map…
Walkable amenities ~0.75 mi
Loading nearby amenities…
Taxation est. · year 1
- Rental income
- $27,335
- − Mortgage interest
- −$14,004
- − Property taxes
- −$4,277
- − Insurance
- −$1,250
- − Repairs & maintenance
- −$2,187
- − Management
- −$2,187
- − Depreciation
- −$7,273
- Taxable loss
- −$3,842
- Est. tax savings @ 24.0%
- +$922
- After-tax cash flow
- $1,258/yr
For passive investors: Depreciation is non-cash, so a rental often shows a tax loss while cash-flowing — sheltering income. Rental losses are passive: they offset passive income freely, and up to $25,000/yr can offset ordinary (W-2) income if you actively participate and your MAGI is under $100k (phasing out to $0 by $150k); unused losses carry forward. On sale, claimed depreciation is recaptured at up to 25%, and gains may owe capital-gains tax (a 1031 exchange can defer both). Figures are a year-1 estimate at your 24.0% rate — not tax advice; consult a CPA.
Schools (NCES district)
- District
- Conroe ISD
- NCES district ID
- 4815000
- Math proficiency
- 57% ▼ -6.00%
- Reading proficiency
- 57% ▼ -1.00%
- Median HH income
- $71,541
- Composite
- 50.65/100
- National rank
- #1833
- State rank
- #69 of 826 in TX
Livability — The Woodlands
- Score
- 91/100
- State rank
- #1
- US rank
- #47
Category grades
Schools grade is shown separately in the Schools card above.
Census & demographics
- County
- Montgomery County · 663,713 people
- City population
- 106,505
- Metro
- Houston-The Woodlands-Sugar Land, TX
- Population (ZIP)
- 28,156
- Household income
- $117,118
- Rent vs Own
- Severe rent burden
- 471.0
Population outlook (Montgomery County) Hauer SSP2
- Today (2025)
- 713,896 people
- By 2030
- 805,263 · +12.8%
- By 2040
- 992,708 · +39.1%
- By 2050
- 1,179,590 · +65.2%
- By 2075
- 1,628,084 · +128.1%
- By 2100
- 1,937,880 · +171.5%
Race, ethnicity, and origin ACS 2023
- Neighborhood character
- Diverse neighborhood (Simpson 0.63)
- Race & ethnicity
- White 53% Hispanic / Latino 27% Two or more races 16% Black 11% Asian 5%
- Hispanic origin (detail)
- Mexican 15% Puerto Rican 2% Cuban 1%
- Common ancestry
- Slovak 3% Romanian 2% Italian 2%
- Foreign-born
- 15% · Canada, Jamaica, Vietnam
- Languages at home
- 76% English-only · Spanish 16% Other Indo-European 2% Other Asian/Pacific 1%
Political lean MEDSL · Montgomery
- 2024 margin
- Solid R (+45.5) · D 26.8% · R 72.3%
- 2008→2024 swing
- +7.2pp toward D · 2008: -52.7pp · 2024: -45.5pp
- All cycles
- 2024: R+45.5 2020: R+43.8 2016: R+51.4 2012: R+60.7 2008: R+52.7
Not yet ingested
- Civics
- —
Market trends
- HPI YoY
- ▼ -91.09%
- Current HPI
- 239.9434
- Rent YoY
- ▲ 3.88%
- Metro
- Houston-The Woodlands-Sugar Land, TX
- State GDP YoY
- ▲ 3.95%
- F500 in state
- 110
Industry mix (Fortune 500 HQ in TX)
| Industry | F500 HQs | Revenue |
|---|---|---|
| Energy | 16 | $1,198B |
|
||
| Technology | 5 | $198B |
|
||
| Engineering / Construction | 4 | $72B |
|
||
| Energy Services | 3 | $60B |
|
||
| Utilities | 3 | $41B |
|
||
| Healthcare | 2 | $330B |
|
||
Price history
+72.4% since first listed17 events — show timeline
- 2026-04-25 Relisted — HARMLS
- 2026-04-16 Listing Removed — HARMLS
- 2026-04-16 Coming Soon $250,000 HARMLS
- 2026-02-17 Listing Removed — HARMLS
- 2025-12-24 Relisted — HARMLS
- 2025-12-14 Pending — HARMLS
- 2025-11-06 Listed $250,000 HARMLS
- 2019-03-28 Sold (Public Records) — Public Records
- 2019-03-28 Sold (MLS) — HARMLS
- 2019-03-26 Pending — HARMLS
- 2019-03-21 Pending — HARMLS
- 2019-03-01 Relisted — HARMLS
- 2019-01-31 Pending — HARMLS
- 2019-01-29 Price Changed $130,000 HARMLS
- 2019-01-23 Listed $145,000 HARMLS
- 2006-12-01 Sold (Public Records) — Public Records
- 1999-10-29 Sold (Public Records) — Public Records
Property tax history
+1.8%/yrLatest (2025): $4,277 · +18.7% YoY. Source: county tax records.
Cash-flow waterfall
monthlySold comps — $/sqft
last 12 mo · ≤1 miLoading sold comps…