75 3RD Shannon St NE · Shannon, GA
Flood risk 1/10 · Minimal
- FEMA flood zone
- X (unshaded)
- Chance of flooding over 30 yrs
- 0.0%
- Est. flood insurance / yr
- $507 – $1,088
Fire risk 5/10 · Moderate
- Est. fire insurance / yr
- $963 – $1,789
Heat risk 6/10 · Moderate
- Hot days now (above 103°F)
- 7 days/yr
- Hot days in 30 yrs
- 19 days/yr
Wind risk 4/10 · Minor
- Chance of severe wind over 30 yrs
- 15.0%
Air-quality risk 3/10 · Minor
- Unhealthy air days now
- 3 days/yr
- Unhealthy air days in 30 yrs
- 4 days/yr
Risk factors via First Street. Map © Google.
Why this score? — see what drove the C grade
The composite is a weighted blend of 9 inputs, each scored 0–100. Each bar is that input's sub-score; the figure is the points it added to the 100-point composite (weight × sub-score).
- Cash flow +17.2/30.0
- ARV discount +13.4/15.0
- DSCR +5.3/10.0
- 1% rule +4.6/10.0
- Rent growth +4.1/5.0
- Condition / age +4.0/5.0
- Schools +3.5/10.0
- Livability +3.2/5.0
- Appreciation +0.0/10.0
$174,900
🖨 Deal sheet (PDF) 📄 Offer letter ✓ Due diligence
Listing remarks
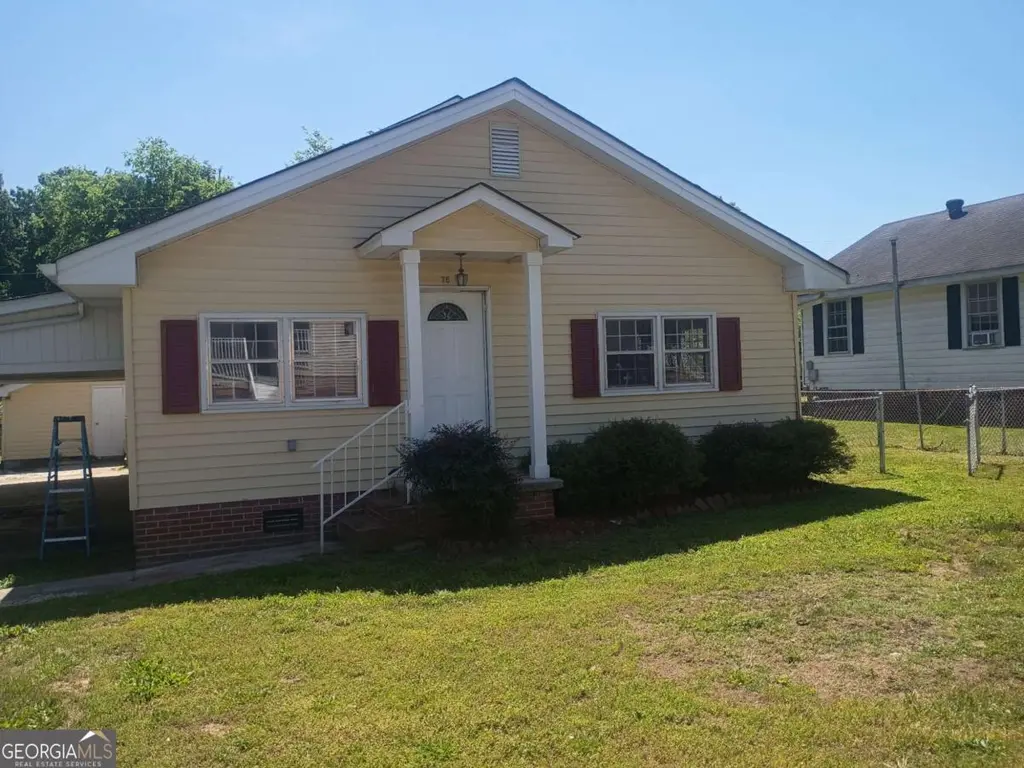
Welcome to this beautifully renovated 3-bedroom, 1-bath home that's move-in ready and waiting for its new owners. Step inside to find brand-new flooring throughout and fresh paint in a crisp, neutral palette that lets you make the space your own. The updated kitchen features new appliances and is ready for everything from weeknight dinners to weekend entertaining. Updated electrical gives you peace of mind and ensures the home is ready for today's needs. Location is everything, and this home delivers-enjoy quick access to the park for morning walks or afternoon adventures, plus convenient proximity to I-75 for easy commuting in any direction. Don't miss your chance to own this turn-key gem.
Key facts
- Quick access to park
- Updated electrical
- Renovated
Tags
Property features AI
Finance
- Other: Listing terms: Cash, Conventional, FHA, Lease Purchase; Special listing condition: Agent/Seller Relationship
- HOA & community: No HOA
Exterior
- Parking: Carport; Off-street parking
- Utilities: Public water; Public sewer (connected); Electric service 220 volts; Cable and phone available
- Home design: Single-family house (residential); Built in 1940; Resale property
- Construction: Vinyl siding; Composition roof; Crawl space foundation
- Exterior features: Level lot; Back yard with chain link fence; Park nearby (community feature)
Interior
- Kitchen: Dishwasher; Microwave; Refrigerator; Electric water heater
- Bedrooms: 3 bedrooms on the main level
- Flooring: Laminate flooring
- Bathrooms: 1 full bathroom (main level)
- Heating & cooling: Central heating (electric); Central air; Ceiling fan(s)
- Interior features: One-level living; Public-record living area 1392; Crawl space basement; Outbuilding on property
- Laundry & utility: Laundry in kitchen; Laundry closet
Neighborhood map
What this means for you Summary
Snapshot
- This is a 3-bed/1.0-bath single-family listed at $175k. Condition is rated good.
Deal economics
- At list price, monthly cash flow is $123 ($1k/yr) — positive.
- The deal already cash-flows at list — no discount required.
- To meet the 1% rule (rent ≥ 1% of price), the offer needs to be $169k (3.6% below list).
- Recommended offer: $169k (3.6% below list) — sets the bar for 1% rule.
- Cap rate 7.1% vs local median 4.1% in Shannon — top-decile yield for the area; either an underpriced asset or a hidden risk that comps aren't pricing in. Stress-test before assuming the spread holds.
Location & tenants
- Location reads 64/100 on livability (#264 in GA) — a middle-class / working-renter tenant base. Strengths: crime A+, cost of living A+, housing A+; Watch: employment D, amenities F, commute F.
- Floyd County (rural): math 41% / reading 40% proficiency, ranked #45 of 174 in GA (top 26%) — families likely to look elsewhere, expect single-tenant / working-renter base with shorter leases.
- Zoned schools: Model Elementary School (math 50% / reading 48%, grade D, #280 of 1,228 statewide, top 23%, 489 students, 56% FRL); Model Middle School (math 47% / reading 53%, grade C, #68 of 470 statewide, top 15%, 519 students, 41% FRL); Model High (math 36% / reading 43%, grade F, #57 of 424 statewide, top 13%, 912 students, 32% FRL).
- Market conditions: Rents rising fast (+6.3%/yr); 412 active listings in the ZIP; 2 comparable units currently listed for rent nearby; 355 units permitted in Floyd County in 2024 (0 in 5+ unit buildings).
- This rent runs 33% of the median local income ($62k/yr) — at the standard rent-burdened threshold; future hikes will face affordability resistance.
Forward outlook
- Local home prices are declining (-3.0%/yr); year-one equity from $1k of loan paydown is wiped out by about $5k of value loss. Plan a longer hold.
- Floyd County population projected to shrink 6% by 2050 — rents likely to lag national; underwrite the cash flow, not the appreciation.
Negotiation context
- It's been on market 45 days — a 3% lower offer ($170k) is reasonable based on typical stale-listing flexibility.
- 3 sale attempts with the ask held roughly flat each time — persistent listings suggest the price (not the market) is what's stuck; bring a comps-based counter.
Risks & watch-outs
- Watch-outs: built in 1940 — expect roof / HVAC / electrical / plumbing capex.
- Climate carrying-cost: moderate wildfire risk; extreme-heat days projected 7→19/yr by 2055 (HVAC capex compounding) — expect insurance premiums to compound above CPI over the hold.
Questions for the listing agent
- It's been on market 45 days. Have you received any prior offers? Is the seller open to a 4% concession, seller financing, or rate buy-down credit?
- Built in 1940 — when were the roof, HVAC, electrical panel, plumbing, and water heater last replaced?
- Is there a deadline driving the sale (1031 exchange, divorce, estate, relocation)? That informs how much negotiation room exists.
- Schools are F-rated, which usually means shorter tenancies and higher turnover. Who's the typical renter profile here, and what's been the actual vacancy rate?
- What's the average days-on-market for RENTAL listings here right now (not sales)? A rising rental-DOM trend means longer vacancies and softer asking-rent achievability than the comps imply.
- What's the recent tenant-quality profile in this submarket — average credit score on applications, eviction rate, late-payment / NSF rate, and stable-employment percentage? A property-management company in the area should have these aggregated.
- How much new for-sale + rental construction is in the pipeline within 1–3 miles? Heavy new supply typically softens prices + rents 12–24 months out; constrained supply supports both.
Investment metrics
- 1% rule
- 0.96% ✗
- Cap rate
- 7.14%
- Cash-on-cash
- 3.02%
- DSCR
- 1.13
- GRM
- 8.6
CMA / ARV
- ARV (median comp)
- $201,489
- List price
- $174,900
- Delta
- -13.20%
- Verdict
- UNDERPRICED
- Comps
- 20 within 1.0 mi
Show comp detail 8 sales within ~0.75 mi
| Address | Dist | Beds/Ba | Sqft | Sold | Price | $/sf | Match |
|---|---|---|---|---|---|---|---|
| 265 4th Shannon St | 0.18mi | 3/2.0 | 1,456 (+5%) | 16mo | $249,000 | $171 | 66 |
| 470 3rd St | 0.39mi | 2/2.0 (-1) | 1,336 (-4%) | 10mo | $220,360 | $165 | 57 |
| 435 4th Shannon St | 0.34mi | 2/1.0 (-1) | 1,244 (-11%) | 13mo | $190,000 | $153 | 51 |
| 14 Brighton Trl NE | 0.74mi | 3/2.0 | 1,495 (+7%) | 12mo | $295,000 | $197 | 39 |
| 830 Shannon Cir NE | 0.73mi | 3/2.0 | 1,276 (-8%) | 15mo | $265,000 | $208 | 35 |
| 695 Shannon Cir NE | 0.65mi | 3/2.0 | 1,507 (+8%) | 23mo | $280,000 | $186 | 33 |
| 845 Shannon Cir NE | 0.58mi | 4/3.0 (+1) | 1,591 (+14%) | 19mo | $290,000 | $182 | 20 |
| 7 Brighton Trl NE | 0.69mi | 4/2.0 (+1) | 1,561 (+12%) | 24mo | $309,900 | $199 | 19 |
Match score weights: distance 35% · size 25% · config 20% · recency 20%. Top-matched comps best support the ARV.
Projected returns pro-forma
-3.0% appreciation · 6.28% rent growth · sell at horizon
- IRR
- -7.9%
- Equity multiple
- 0.70×
- Total profit
- $-14,710
- Equity at exit
- $26,078
- IRR
- 5.4%
- Equity multiple
- 1.46×
- Total profit
- $22,644
- Equity at exit
- $15,122
Cash invested: $48,972 (down + closing). Projections, not guarantees.
Landlord ↔ Tenant lean methodology
- Overall (STATE)
- 90 Strongly Landlord-Friendly
- State Georgia
- 90 Strongly Landlord-Friendly · R+3
- County
- — inherits STATE
- City
- — inherits STATE
ZIP-level market 30161
- Rents YoY
- 6.3%
- Active inventory
- 412
- Price-to-rent
- 8.6×
Monthly cashflow live
- Estimated rent
- $1,686 medium interval (Pro) →
- Mortgage (P&I)
- −$917
- Tax est. 1.5%
- −$219 /mo · $2,624/yr
- Insurance
- −$73
- HOA
- −$0
- Vacancy / Maint / Mgmt
- −$354
- Net cashflow
- $123
Break-even live
Sensitivity live
| Price | -10% $244 | -5% $184 | +0% $123 | +5% $63 | +10% $3 |
|---|---|---|---|---|---|
| Rent | -10% $-10 | -5% $57 | +0% $123 | +5% $190 | +10% $257 |
| Rate | -1.0pp $211 | -0.5pp $168 | base $123 | +0.5pp $78 | +1.0pp $32 |
UW: 25.0% down · 7.5% · 30yr · 1.5% tax · 5.0% vac · 8.0% maint · 8.0% mgmt
Financing live
Cash to close
- Down payment
- $43,725
- Closing costs
- $5,247
- Reserves months
- —
- Total cash needed
- —
Loan-product check · same deal, 3 products live
Conventional
25% down · 7.5% · 30yr
- Down + closing
- —
- Monthly P&I
- —
- Monthly cashflow
- —
- DSCR
- —
- Eligible?
- —
Personal DTI + credit; lowest rate.
DSCR
20% down · 8.5% · 30yr
- Down + closing
- —
- Monthly P&I
- —
- Monthly cashflow
- —
- DSCR
- —
- Eligible?
- —
No personal income docs; deal must DSCR.
Hard money
10% down · 12.0% · 12mo
- Down + closing
- —
- Monthly P&I
- —
- Monthly cashflow
- —
- DSCR
- —
- Eligible?
- —
Short-term bridge; refi at stabilization.
Rent comps 2 comps
| Address | Beds | Baths | Sqft | Rent | $/sqft | DOM | Units | Dist |
|---|---|---|---|---|---|---|---|---|
| 129 Pierce Hill Rd NE Rome, GA | 3.0 | 2.0 | 1500 | $2,000 | $1.33 | 45d | 1 | 0.60mi |
| 439 Pinson Rd NE Rome, GA | 2.0 | 1.0 | 880 | $1,195 | $1.36 | 7d | 1 | 1.13mi |
Listing history 10 events
-
2026-06-07statusdays on market $174,900 Under Contract 45 DOM
-
2026-06-03days on market $174,900 Active 41 DOM
-
2026-06-02days on market $174,900 Active 40 DOM
-
2026-06-01days on market $174,900 Active 39 DOM
-
2026-05-31days on market $174,900 Active 38 DOM
-
2026-05-30days on market $174,900 Active 37 DOM
-
2026-05-18status Under Contract 817-char remark
-
2026-04-19$174,900 New 817-char remark
-
2026-04-07historical
-
2026-01-16$199,900 New
ⓘ Source: listings_history table (triggers on properties + properties_extension) + one-shot
backfill from property_details.listing_events for pre-trigger history.
Climate risk First Street
- Flood 1/10 Low FEMA zone X (unshaded) · 0% chance over 30 yrs
- Wildfire 5/10 Major
- Heat 6/10 Major 7 d/yr ≥103°F today · 19 d/yr by 30 yrs out
- Wind 4/10 Moderate 15% chance of damaging wind over 30 yrs
- Air quality 3/10 Moderate 3 unhealthy d/yr today · 4 by 30 yrs out
Nearby sold comps map
Loading sold comps map…
Walkable amenities ~0.75 mi
Loading nearby amenities…
Taxation est. · year 1
- Rental income
- $20,234
- − Mortgage interest
- −$9,797
- − Property taxes
- −$2,624
- − Insurance
- −$874
- − Repairs & maintenance
- −$1,619
- − Management
- −$1,619
- − Depreciation
- −$5,088
- Taxable loss
- −$1,387
- Est. tax savings @ 24.0%
- +$333
- After-tax cash flow
- $1,813/yr
For passive investors: Depreciation is non-cash, so a rental often shows a tax loss while cash-flowing — sheltering income. Rental losses are passive: they offset passive income freely, and up to $25,000/yr can offset ordinary (W-2) income if you actively participate and your MAGI is under $100k (phasing out to $0 by $150k); unused losses carry forward. On sale, claimed depreciation is recaptured at up to 25%, and gains may owe capital-gains tax (a 1031 exchange can defer both). Figures are a year-1 estimate at your 24.0% rate — not tax advice; consult a CPA.
Condition & rehab AI · 1 photo
This move-in ready, renovated home offers a fresh, updated interior with new flooring and appliances, and a well-maintained exterior. Minor landscaping and smart home upgrades could further enhance its value.
Value-add opportunities
- Both Landscaping improvements — Enhances curb appeal and adds value.
- Both Add a small patio or deck — Increases outdoor living space and adds value.
- Both Install smart home features — Improves convenience and adds modern appeal.
Renovation cost estimate screening
Value-add ROI direction
- Both Landscaping improvements — Enhances curb appeal and adds value. ↑
- Both Add a small patio or deck — Increases outdoor living space and adds value. ↑
- Both Install smart home features — Improves convenience and adds modern appeal. ↑
ⓘ Cost ranges are severity-bucket heuristics (US national rule-of-thumb). Get contractor quotes + a written scope before underwriting a rehab budget.
Schools (NCES district)
- District
- Floyd County
- NCES district ID
- 1302190
- Math proficiency
- 41% ▼ -5.00%
- Reading proficiency
- 40% ▼ -4.00%
- Median HH income
- $47,083
- Composite
- 34.64/100
- National rank
- #5143
- State rank
- #45 of 174 in GA
Livability — Shannon
- Score
- 64/100
- State rank
- #264
- US rank
- #14408
Category grades
Schools grade is shown separately in the Schools card above.
Census & demographics
- Census place
- Shannon, GA
- County
- Floyd County · 77,706 people
- Metro
- Rome, GA
- Population (ZIP)
- 34,705
- Household income
- $61,667
- Rent vs Own
- Severe rent burden
- 1104.0
Population outlook (Floyd County) Hauer SSP2
- Today (2025)
- 96,321 people
- By 2030
- 95,532 · -0.8%
- By 2040
- 93,332 · -3.1%
- By 2050
- 90,850 · -5.7%
- By 2075
- 84,989 · -11.8%
- By 2100
- 76,097 · -21.0%
Race, ethnicity, and origin ACS 2023
- Neighborhood character
- Predominantly White (68%)
- Race & ethnicity
- White 68% Black 20% Hispanic / Latino 7% Two or more races 6% Asian 1%
- Hispanic origin (detail)
- Mexican 2%
- Common ancestry
- Slovak 3% Serbian 2% Italian 2%
- Foreign-born
- 5% · Canada
- Languages at home
- 91% English-only · Spanish 5% Other Indo-European 1%
Political lean MEDSL · Floyd
- 2024 margin
- Solid R (+42.0) · D 28.8% · R 70.7%
- 2008→2024 swing
- -5.6pp toward R · 2008: -36.4pp · 2024: -42.0pp
- All cycles
- 2024: R+42.0 2020: R+41.1 2016: R+43.5 2012: R+39.9 2008: R+36.4
Not yet ingested
- Civics
- —
Market trends
- HPI YoY
- ▼ -186.06%
- Current HPI
- 257.8168
- Rent YoY
- ▲ 6.28%
- Metro
- Rome, GA
- State GDP YoY
- ▲ 2.66%
- F500 in state
- 28
Industry mix (Fortune 500 HQ in GA)
| Industry | F500 HQs | Revenue |
|---|---|---|
| Paper / Packaging | 2 | $29B |
|
||
| Retail | 1 | $160B |
|
||
| Transportation / Logistics | 1 | $91B |
|
||
| Airlines | 1 | $62B |
|
||
| Consumer Goods | 1 | $47B |
|
||
| Utilities | 1 | $25B |
|
||
Price history
-12.5% since first listed6 events — show timeline
- 2026-06-07 Pending — GAMLS
- 2026-05-21 Relisted — GAMLS
- 2026-05-18 Pending — GAMLS
- 2026-04-19 Listed $174,900 GAMLS
- 2026-04-07 Listing Removed — GAMLS
- 2026-01-16 Listed $199,900 GAMLS
Cash-flow waterfall
monthlySold comps — $/sqft
last 12 mo · ≤1 miLoading sold comps…