5766 Pony Express Trl #2 · Pollock Pines, CA
Flood risk 1/10 · Minimal
- FEMA flood zone
- X (unshaded)
- Chance of flooding over 30 yrs
- 0.0%
- Est. flood insurance / yr
- $507 – $1,088
Fire risk 8/10 · Major
- Est. fire insurance / yr
- $659 – $1,223
Heat risk 4/10 · Minor
- Hot days now (above 97°F)
- 7 days/yr
- Hot days in 30 yrs
- 15 days/yr
Wind risk 1/10 · Minimal
- Chance of severe wind over 30 yrs
- —
Air-quality risk 9/10 · Severe
- Unhealthy air days now
- 19 days/yr
- Unhealthy air days in 30 yrs
- 24 days/yr
Risk factors via First Street. Map © Google.
Why this score? — see what drove the C+ grade
The composite is a weighted blend of 9 inputs, each scored 0–100. Each bar is that input's sub-score; the figure is the points it added to the 100-point composite (weight × sub-score).
- Cash flow +30.0/30.0
- 1% rule +10.0/10.0
- DSCR +10.0/10.0
- Schools +3.0/10.0
- Livability +2.8/5.0
- Rent growth +2.5/5.0
- Condition / age +2.5/5.0
- ARV discount +0.0/15.0
- Appreciation +0.0/10.0
$70,000
🖨 Deal sheet (PDF) 📄 Offer letter ✓ Due diligence
Listing remarks
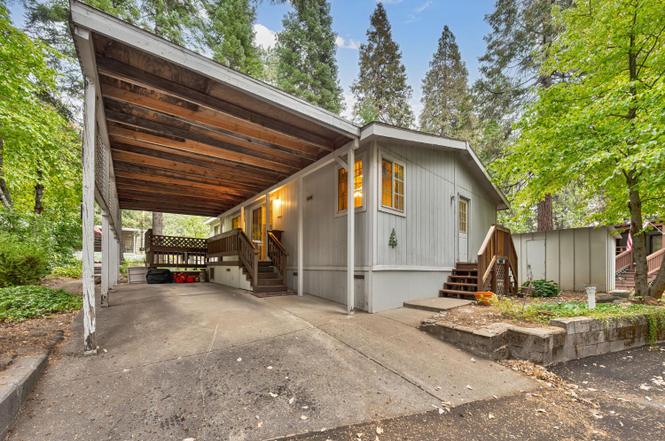
Tucked among the beautiful, mature trees of a highly sought-after 55+ Community in Pollock Pines, this charming double-wide offers comfort, convenience, and endless potential. The thoughtful floor plan provides a spacious and functional layout, while large windows bring in plenty of natural light and peaceful views of the surrounding greenery. With just some fresh paint and vision, this home could easily become the darling retreat you've been dreaming of. Enjoy relaxing on the covered front porch, keep your car sheltered under the covered parking area, and take advantage of the handy storage shed for your tools or hobbies. Located near local shops, restaurants, and public transportation, ev
Key facts
- Covered front porch
- Near restaurants
- Near local shops
Tags
Property features AI
Finance
- Other: Directions: Hwy 50 to Ridgeway Exit; Right onto Pony Express Trl; follow to Dogwood Mobile Home Park entrance on the right; unit #2 will be on the left
- Financial info: Land lease: No (land lease amount listed separately)
- HOA & community: No association; Senior community
Exterior
- Parking: Assigned parking; Attached covered parking; Guest parking available; No garage
- Utilities: Cable available; Propane; 220V in laundry; Generator; Septic system; Public water via water district
- Home design: Manufactured in-park double wide; Original condition; Built in 1993
- Construction: Wood skirting; Fleetwood manufactured home; Shingle/composition roof
- Exterior features: Storage shed(s); Additional storage area; Close to clubhouse; Landscaped; Other lot features
Interior
- Kitchen: Free standing gas range; Hood over range; Dishwasher; Free standing refrigerator
- Bedrooms: 2 bedrooms (3 possible)
- Flooring: Carpet; Linoleum
- Bathrooms: 2 full bathrooms; Tub with shower over
- Heating & cooling: Central heating; Ceiling fans; Evaporative cooler
- Interior features: Porch steps with a covered, railed deck; Storage area; Window screens; Cathedral/vaulted living room ceiling; Deck attached to living room; Formal dining area; Breakfast area in kitchen; Unfurnished
- Laundry & utility: Washer and dryer included; Washer/dryer hookups inside (laundry room)
Neighborhood map
What this means for you Summary
Snapshot
- This is a 2-bed/2.0-bath manufactured listed at $70k.
Deal economics
- At list price, monthly cash flow is $1k ($13k/yr) — positive.
- The deal already cash-flows at list — no discount required.
- Meets the 1% rule at list price ($2k rent vs $70k).
- Recommended offer: $62k (12.0% below list) — sets the bar for market timing.
- Cap rate 24.7% vs local median 3.8% in Pollock Pines — top-decile yield for the area; either an underpriced asset or a hidden risk that comps aren't pricing in. Stress-test before assuming the spread holds.
Location & tenants
- Location reads 55/100 on livability (#864 in CA) — a working-class tenant base; expect higher turnover. Strengths: housing A-; Watch: crime D, amenities F, commute F.
- Pollock Pines Elementary (town): math 30% / reading 38% proficiency, ranked #277 of 517 in CA (top 54%) — families likely to look elsewhere, expect single-tenant / working-renter base with shorter leases.
- Zoned schools: Pinewood Elementary (math 42% / reading 42%, grade F, #557 of 1,571 statewide, top 38%, 327 students, 48% FRL); Sierra Ridge Middle (math 22% / reading 35%, grade F, #231 of 498 statewide, top 47%, 263 students, 50% FRL); El Dorado High (math 30% / reading 60%, grade D-, #425 of 1,170 statewide, top 37%, 1,224 students, 30% FRL) — zoned schools at 43% FRL track the district average.
- Market conditions: 154 active listings in the ZIP; 8 comparable units currently listed for rent nearby; rentals leasing fast (median 0d on market — plan ~1-2 weeks tenant-placement turnaround); 437 units permitted in El Dorado County in 2024 (0 in 5+ unit buildings).
Forward outlook
- Local home prices are declining (-3.0%/yr); year-one equity from $484 of loan paydown is wiped out by about $2k of value loss. Plan a longer hold.
- El Dorado County population projected to shrink 3% by 2050 — rents likely to lag national; underwrite the cash flow, not the appreciation.
- At projected returns (-3.0% appreciation + 3.0% rent growth), your $20k cash investment doubles in ~2 years — after that, you're playing with house money.
Negotiation context
- It's been on market 199 days — a 12% lower offer ($62k) is reasonable based on typical stale-listing flexibility.
Risks & watch-outs
- Climate carrying-cost: severe wildfire risk — expect insurance premiums to compound above CPI over the hold.
Questions for the listing agent
- It's been on market 199 days. Have you received any prior offers? Is the seller open to a 12% concession, seller financing, or rate buy-down credit?
- Why hasn't it sold? Are there any deal-killer items the seller is aware of (foundation, flood, title, zoning, code violations)?
- Is there a deadline driving the sale (1031 exchange, divorce, estate, relocation)? That informs how much negotiation room exists.
- Schools are D-rated, which usually means shorter tenancies and higher turnover. Who's the typical renter profile here, and what's been the actual vacancy rate?
- Crime grade is D in this area — have there been break-ins, vandalism, or insurance claims at this property in the last 3 years? What carrier currently insures it and at what premium?
- What's the average days-on-market for RENTAL listings here right now (not sales)? A rising rental-DOM trend means longer vacancies and softer asking-rent achievability than the comps imply.
- What's the recent tenant-quality profile in this submarket — average credit score on applications, eviction rate, late-payment / NSF rate, and stable-employment percentage? A property-management company in the area should have these aggregated.
- How much new for-sale + rental construction is in the pipeline within 1–3 miles? Heavy new supply typically softens prices + rents 12–24 months out; constrained supply supports both.
Investment metrics
- 1% rule
- 2.69% ✓
- Cap rate
- 24.69%
- Cash-on-cash
- 65.72%
- DSCR
- 3.92
- GRM
- 3.1
CMA / ARV
- ARV (on-the-fly)
- $57,960
- Comps found
- 4
Show comp detail 4 sales within ~0.75 mi
| Address | Dist | Beds/Ba | Sqft | Sold | Price | $/sf | Match |
|---|---|---|---|---|---|---|---|
| 5766 Pony Express Trl #2 | 0.00mi | 2/2.0 | 960 (+4%) | 1mo | $60,000 | $63 | 92 |
| 5695 Pony Express Trl #11 | 0.19mi | 3/1.0 (+1) | 924 (+0%) | 9mo | $85,000 | $92 | 74 |
| 5840 Pony Express Trl #49 | 0.19mi | 2/2.0 | 840 (-9%) | 18mo | $35,000 | $42 | 62 |
| 5881 Pony Express Trl #27 | 0.27mi | 2/1.0 | 820 (-11%) | 6mo | $30,000 | $37 | 60 |
Match score weights: distance 35% · size 25% · config 20% · recency 20%. Top-matched comps best support the ARV.
Projected returns pro-forma
-3.0% appreciation · 3.0% rent growth · sell at horizon
- IRR
- 64.9%
- Equity multiple
- 3.91×
- Total profit
- $57,007
- Equity at exit
- $10,437
- IRR
- 69.3%
- Equity multiple
- 8.02×
- Total profit
- $137,613
- Equity at exit
- $6,052
Cash invested: $19,600 (down + closing). Projections, not guarantees.
Landlord ↔ Tenant lean methodology
- Overall (STATE)
- 18 Strongly Tenant-Friendly
- State California
- 18 Strongly Tenant-Friendly · D+13
- County
- — inherits STATE
- City
- — inherits STATE
ZIP-level market 95726
- Active inventory
- 154
- Price-to-rent
- 3.1×
Monthly cashflow live
- Estimated rent
- $1,884 high interval (Pro) →
- Mortgage (P&I)
- −$367
- Tax from tax record
- −$18 /mo · $221/yr
- Insurance
- −$29
- HOA
- −$0
- Vacancy / Maint / Mgmt
- −$396
- Net cashflow
- $1,073
Break-even live
Sensitivity live
| Price | -10% $1,113 | -5% $1,093 | +0% $1,073 | +5% $1,054 | +10% $1,034 |
|---|---|---|---|---|---|
| Rent | -10% $925 | -5% $999 | +0% $1,073 | +5% $1,148 | +10% $1,222 |
| Rate | -1.0pp $1,109 | -0.5pp $1,091 | base $1,073 | +0.5pp $1,055 | +1.0pp $1,037 |
UW: 25.0% down · 7.5% · 30yr · 1.5% tax · 5.0% vac · 8.0% maint · 8.0% mgmt
Financing live
Cash to close
- Down payment
- $17,500
- Closing costs
- $2,100
- Reserves months
- —
- Total cash needed
- —
Loan-product check · same deal, 3 products live
Conventional
25% down · 7.5% · 30yr
- Down + closing
- —
- Monthly P&I
- —
- Monthly cashflow
- —
- DSCR
- —
- Eligible?
- —
Personal DTI + credit; lowest rate.
DSCR
20% down · 8.5% · 30yr
- Down + closing
- —
- Monthly P&I
- —
- Monthly cashflow
- —
- DSCR
- —
- Eligible?
- —
No personal income docs; deal must DSCR.
Hard money
10% down · 12.0% · 12mo
- Down + closing
- —
- Monthly P&I
- —
- Monthly cashflow
- —
- DSCR
- —
- Eligible?
- —
Short-term bridge; refi at stabilization.
Rent comps 8 comps
| Address | Beds | Baths | Sqft | Rent | $/sqft | DOM | Units | Dist |
|---|---|---|---|---|---|---|---|---|
| 5731 Pony Express Trl Unit 2 Pollock Pines, CA | 3.0 | 1.0 | 1094 | $2,000 | $1.83 | 0d | 1 | 0.10mi |
| 5900 Pony Express Trl Unit 14 Pollock Pines, CA | 2.0 | 2.0 | 900 | $1,450 | $1.61 | 0d | 1 | 0.28mi |
| 6001 Pony Express Trl Pollock Pines, CA | 1.0 | 1.0 | 730 | $2,300 | $3.15 | 0d | 1 | 0.52mi |
| 6216 Spruce Ave Pollock Pines, CA | 2.0 | 1.5 | 1001 | $1,750 | $1.75 | 0d | 1 | 1.03mi |
| 2988 Bonanza St Pollock Pines, CA | 2.0 | 1.0 | 1000 | $1,895 | $1.90 | 5d | 1 | 1.05mi |
| 2988 Bonanza St Unit 2 Pollock Pines, CA | 2.0 | 1.0 | 1000 | $2,000 | $2.00 | 5d | 1 | 1.05mi |
| 2893 Polaris St Pollock Pines, CA | 2.0 | 1.0 | 870 | $2,100 | $2.41 | 3d | 1 | 1.32mi |
| 6396 Pony Express Trl Pollock Pines, CA | 1.0 | 1.0 | 700 | $1,425 | $2.04 | 0d | 1 | 1.43mi |
Tax reassessment forecast CA · Resets to sale price
- Current annual tax
- $221 · $18/mo
- Projected year-2 tax
- $532 · $44/mo
- Expected delta
- +$311/yr (+$26/mo · 140.7%)
ⓘ Screening estimate from a state-policy table — verify with the county assessor before closing.
Climate risk First Street
- Flood 1/10 Low FEMA zone X (unshaded) · 0% chance over 30 yrs
- Wildfire 8/10 Severe
- Heat 4/10 Moderate 7 d/yr ≥97°F today · 15 d/yr by 30 yrs out
- Wind 1/10 Low
- Air quality 9/10 Extreme 19 unhealthy d/yr today · 24 by 30 yrs out
Nearby sold comps map
Loading sold comps map…
Walkable amenities ~0.75 mi
Loading nearby amenities…
Taxation est. · year 1
- Rental income
- $22,603
- − Mortgage interest
- −$3,921
- − Property taxes
- −$221
- − Insurance
- −$350
- − Repairs & maintenance
- −$1,808
- − Management
- −$1,808
- − Depreciation
- −$2,036
- Taxable income
- $12,458
- Est. tax owed @ 24.0%
- −$2,990
- After-tax cash flow
- $9,891/yr
For passive investors: Depreciation is non-cash, so a rental often shows a tax loss while cash-flowing — sheltering income. Rental losses are passive: they offset passive income freely, and up to $25,000/yr can offset ordinary (W-2) income if you actively participate and your MAGI is under $100k (phasing out to $0 by $150k); unused losses carry forward. On sale, claimed depreciation is recaptured at up to 25%, and gains may owe capital-gains tax (a 1031 exchange can defer both). Figures are a year-1 estimate at your 24.0% rate — not tax advice; consult a CPA.
Schools (NCES district)
- District
- Pollock Pines Elementary
- NCES district ID
- 0631290
- Math proficiency
- 30% ▼ -9.00%
- Reading proficiency
- 38% ▼ -10.00%
- Median HH income
- $56,474
- Composite
- 30.11/100
- National rank
- #6334
- State rank
- #277 of 517 in CA
Livability — Pollock Pines
- Score
- 55/100
- State rank
- #864
- US rank
- #23561
Category grades
Schools grade is shown separately in the Schools card above.
Census & demographics
- Census place
- Pollock Pines, CA
- Population (ZIP)
- 8,229
Population outlook (El Dorado County) Hauer SSP2
- Today (2025)
- 191,666 people
- By 2030
- 193,662 · +1.0%
- By 2040
- 192,583 · +0.5%
- By 2050
- 185,904 · -3.0%
- By 2075
- 169,543 · -11.5%
- By 2100
- 139,623 · -27.2%
Race, ethnicity, and origin ACS 2023
- Neighborhood character
- Predominantly White (82%)
- Race & ethnicity
- White 82% Hispanic / Latino 10% Two or more races 7% Asian 2% Black 1%
- Hispanic origin (detail)
- Mexican 8%
- Common ancestry
- Slovak 4% Romanian 3% Italian 3%
- Foreign-born
- 5% · Canada, South Korea
- Languages at home
- 94% English-only · Spanish 3% Tagalog/Filipino 1%
Political lean MEDSL · El Dorado
- 2024 margin
- R (+12.0) · D 42.6% · R 54.6% · Other 2.8%
- 2008→2024 swing
- -1.5pp toward R · 2008: -10.5pp · 2024: -12.0pp
- All cycles
- 2024: R+12.0 2020: R+8.8 2016: R+13.9 2012: R+18.2 2008: R+10.5
Not yet ingested
- Civics
- —
Market trends
- HPI YoY
- ▼ -187.87%
- Current HPI
- 253.8307
- Rent YoY
- —
- Metro
- —
- State GDP YoY
- ▲ 3.21%
- F500 in state
- 116
Industry mix (Fortune 500 HQ in CA)
| Industry | F500 HQs | Revenue |
|---|---|---|
| Technology | 27 | $1,492B |
|
||
| Financial Services | 3 | $174B |
|
||
| Retail | 3 | $44B |
|
||
| Insurance | 3 | $26B |
|
||
| Media / Entertainment | 2 | $115B |
|
||
| Pharmaceuticals / Biotech | 2 | $62B |
|
||
Property tax history
-8.0%/yrLatest (2023): $221 · -0.4% YoY. Source: county tax records.
Cash-flow waterfall
monthlySold comps — $/sqft
last 12 mo · ≤1 miLoading sold comps…