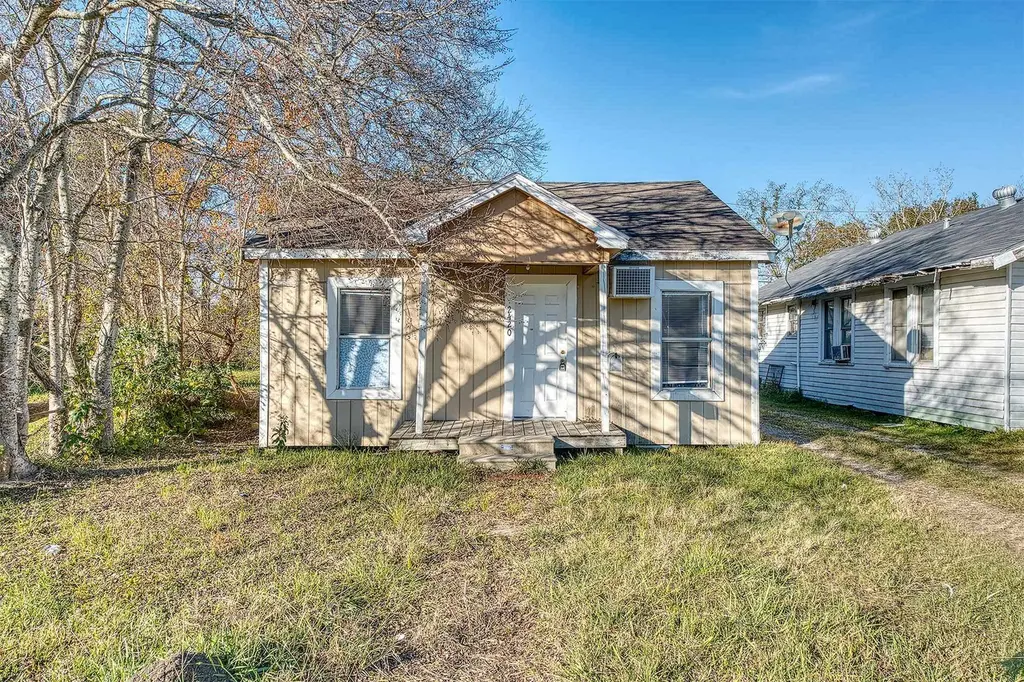
2420 Euclid St · Beaumont, TX
Flood risk 4/10 · Minor
- FEMA flood zone
- X
- Chance of flooding over 30 yrs
- 0.22%
- Est. flood insurance / yr
- $507 – $1,088
Fire risk 1/10 · Minimal
- Est. fire insurance / yr
- $1,222 – $2,270
Heat risk 9/10 · Severe
- Hot days now (above 109°F)
- 7 days/yr
- Hot days in 30 yrs
- 23 days/yr
Wind risk 9/10 · Severe
- Chance of severe wind over 30 yrs
- 99.0%
Air-quality risk 2/10 · Minimal
- Unhealthy air days now
- 1 days/yr
- Unhealthy air days in 30 yrs
- 1 days/yr
Risk factors via First Street. Map © Google.
Why this score? — see what drove the D- grade
The composite is a weighted blend of 9 inputs, each scored 0–100. Each bar is that input's sub-score; the figure is the points it added to the 100-point composite (weight × sub-score).
- Cash flow +12.3/30.0
- ARV discount +10.0/15.0
- DSCR +3.7/10.0
- 1% rule +3.2/10.0
- Livability +3.2/5.0
- Rent growth +2.5/5.0
- Condition / age +2.5/5.0
- Schools +1.5/10.0
- Appreciation +0.0/10.0
$105,000
🖨 Deal sheet (PDF) 📄 Offer letter ✓ Due diligence
Listing remarks MLS
This home does need some tlc, although it may be a fixer upper, it does have a great warehouse in the back for anyone who works from home or is wanting to work from home. There are a number of possibilities for the use of this warehouse, whether you're a welder, mechanic or just looking for a place to keep your belongings, this home is for you. Come take a look, you will regret missing out!!
Key facts
- 0.23 acre lot
- 2 garage spots
- Listed 79 days
Neighborhood map
What this means for you Summary
Snapshot
- This is a 2-bed/1.0-bath single-family listed at $105k.
Deal economics
- At list price, monthly cash flow is $-19 ($-226/yr) — negative.
- To cash-flow at today's rent, offer at most $102k (3.2% below list).
- To meet the 1% rule (rent ≥ 1% of price), the offer needs to be $86k (18.4% below list).
- Recommended offer: $86k (18.4% below list) — sets the bar for 1% rule.
Location & tenants
- Location reads 64/100 on livability (#739 in TX) — a middle-class / working-renter tenant base. Strengths: cost of living A+, housing A+, health & safety A+; Watch: employment D, crime F, amenities F.
- Beaumont ISD (urban): math 14% / reading 22% proficiency, ranked #789 of 826 in TX (top 96%) — low school quality limits family demand, transient renter base, plan for 1-2y turnover; 69% free/reduced lunch — lower-income household profile, screen leases tightly.
- Zoned schools: Blanchette El (math 6% / reading 12%, grade F, #4,293 of 4,322 statewide, top 99%, 568 students, 96% FRL); Odom Middle (math 30% / reading 42%, grade F, #805 of 1,662 statewide, top 50%, 709 students, 73% FRL) — zoned schools average 85% FRL vs 69% district-wide (16 pts higher); higher-poverty schools than district average — tighter screening recommended.
- Market conditions: 207 active listings in the ZIP; 10 comparable units currently listed for rent nearby; rentals at typical pace (median 25d on market — plan ~3-4 weeks tenant-placement turnaround); 40% of comp listings sitting > 30 days — soft ceiling on asking rent; 343 units permitted in Jefferson County in 2024 (0 in 5+ unit buildings).
Forward outlook
- Local home prices are declining (-3.0%/yr); year-one equity from $726 of loan paydown is wiped out by about $3k of value loss. Plan a longer hold.
Negotiation context
- It's been on market 79 days — a 6% lower offer ($99k) is reasonable based on typical stale-listing flexibility.
- 2 sale attempts with the ask held roughly flat each time — persistent listings suggest the price (not the market) is what's stuck; bring a comps-based counter.
Risks & watch-outs
- Climate carrying-cost: severe wind risk, 99% chance of damaging wind over 30y; extreme-heat days projected 7→23/yr by 2055 (HVAC capex compounding) — expect insurance premiums to compound above CPI over the hold.
Questions for the listing agent
- What do current leases actually rent for vs. the listed asking? Can we see a recent rent roll and the last 12 months of T-12 income?
- It's been on market 79 days. Have you received any prior offers? Is the seller open to a 18% concession, seller financing, or rate buy-down credit?
- Built in 1962 — when were the roof, HVAC, electrical panel, plumbing, and water heater last replaced?
- Why hasn't it sold? Are there any deal-killer items the seller is aware of (foundation, flood, title, zoning, code violations)?
- Is there a deadline driving the sale (1031 exchange, divorce, estate, relocation)? That informs how much negotiation room exists.
- Schools are D-rated, which usually means shorter tenancies and higher turnover. Who's the typical renter profile here, and what's been the actual vacancy rate?
- Crime grade is F in this area — have there been break-ins, vandalism, or insurance claims at this property in the last 3 years? What carrier currently insures it and at what premium?
- The area grade is low — what's the realistic commute time and amenity access for the typical tenant pool here? Any planned neighborhood developments (good or bad) we should know about?
- What's the average days-on-market for RENTAL listings here right now (not sales)? A rising rental-DOM trend means longer vacancies and softer asking-rent achievability than the comps imply.
- What's the recent tenant-quality profile in this submarket — average credit score on applications, eviction rate, late-payment / NSF rate, and stable-employment percentage? A property-management company in the area should have these aggregated.
- How much new for-sale + rental construction is in the pipeline within 1–3 miles? Heavy new supply typically softens prices + rents 12–24 months out; constrained supply supports both.
Investment metrics
- 1% rule
- 0.82% ✗
- Cap rate
- 6.08%
- Cash-on-cash
- -0.77%
- DSCR
- 0.97
- GRM
- 10.2
CMA / ARV
- ARV (median comp)
- $111,171
- List price
- $105,000
- Delta
- -5.55%
- Verdict
- FAIR
- Comps
- 20 within 1.0 mi
Projected returns pro-forma
-3.0% appreciation · 3.0% rent growth · sell at horizon
- IRR
- -17.6%
- Equity multiple
- 0.38×
- Total profit
- $-18,221
- Equity at exit
- $15,656
- IRR
- -9.7%
- Equity multiple
- 0.41×
- Total profit
- $-17,434
- Equity at exit
- $9,078
Cash invested: $29,400 (down + closing). Projections, not guarantees.
Landlord ↔ Tenant lean methodology
- Overall (STATE)
- 87 Strongly Landlord-Friendly
- State Texas
- 87 Strongly Landlord-Friendly · R+5
- County
- — inherits STATE
- City
- — inherits STATE
ZIP-level market 77705
- Home prices YoY
- -29.7%
- Active inventory
- 207
- Price-to-rent
- 10.2×
Monthly cashflow live
- Estimated rent
- $857 high interval (Pro) →
- Mortgage (P&I)
- −$551
- Tax from tax record
- −$102 /mo · $1,221/yr
- Insurance
- −$44
- HOA
- −$0
- Vacancy / Maint / Mgmt
- −$180
- Net cashflow
- $-19
Break-even live
Sensitivity live
| Price | -10% $41 | -5% $11 | +0% $-19 | +5% $-49 | +10% $-78 |
|---|---|---|---|---|---|
| Rent | -10% $-87 | -5% $-53 | +0% $-19 | +5% $15 | +10% $49 |
| Rate | -1.0pp $34 | -0.5pp $8 | base $-19 | +0.5pp $-46 | +1.0pp $-74 |
UW: 25.0% down · 7.5% · 30yr · 1.5% tax · 5.0% vac · 8.0% maint · 8.0% mgmt
Financing live
Cash to close
- Down payment
- $26,250
- Closing costs
- $3,150
- Reserves months
- —
- Total cash needed
- —
Loan-product check · same deal, 3 products live
Conventional
25% down · 7.5% · 30yr
- Down + closing
- —
- Monthly P&I
- —
- Monthly cashflow
- —
- DSCR
- —
- Eligible?
- —
Personal DTI + credit; lowest rate.
DSCR
20% down · 8.5% · 30yr
- Down + closing
- —
- Monthly P&I
- —
- Monthly cashflow
- —
- DSCR
- —
- Eligible?
- —
No personal income docs; deal must DSCR.
Hard money
10% down · 12.0% · 12mo
- Down + closing
- —
- Monthly P&I
- —
- Monthly cashflow
- —
- DSCR
- —
- Eligible?
- —
Short-term bridge; refi at stabilization.
Rent comps 10 comps
| Address | Beds | Baths | Sqft | Rent | $/sqft | DOM | Units | Dist |
|---|---|---|---|---|---|---|---|---|
| 2401 Franklin St Unit 2405 Beaumont, TX | 2.0 | 1.0 | 600 | $995 | $1.66 | 15d | 1 | 0.66mi |
| 2370 Avenue C Unit C Beaumont, TX | 1.0 | 1.0 | 728 | $850 | $1.17 | 25d | 1 | 0.78mi |
| 4370 Avenue A Unit 02 Beaumont, TX | 1.0 | 1.0 | 390 | $600 | $1.54 | 45d | 1 | 1.05mi |
| 2325 Victoria St Unit 1 Beaumont, TX | 1.0 | 1.0 | 450 | $700 | $1.56 | 45d | 1 | 1.05mi |
| 2325 Victoria St Unit 6 Beaumont, TX | 1.0 | 1.0 | 450 | $900 | $2.00 | 45d | 1 | 1.05mi |
| 1142 Lyle St Unit 4 Beaumont, TX | 1.0 | 1.0 | 500 | $625 | $1.25 | 15d | 1 | 1.10mi |
| 1142 Lyle St Unit 5 Beaumont, TX | 1.0 | 1.0 | 450 | $595 | $1.32 | 45d | 1 | 1.10mi |
| 1860 Forsythe St Unit 1860 Beaumont, TX | 2.0 | 1.0 | 700 | $800 | $1.14 | 22d | 1 | 1.15mi |
| 690 E AVE Unit B Beaumont, TX | 1.0 | 1.0 | 700 | $875 | $1.25 | 15d | 1 | 1.16mi |
| 2210 Sabine Pass Ave Unit D Beaumont, TX | 1.0 | 1.0 | 740 | $695 | $0.94 | 15d | 1 | 1.36mi |
Listing history 16 events
-
2026-06-14days on market $105,000 Active 79 DOM
-
2026-06-13days on market $105,000 Active 78 DOM
-
2026-06-10days on market $105,000 Active 76 DOM
-
2026-06-09days on market $105,000 Active 75 DOM
-
2026-06-08days on market $105,000 Active 74 DOM
-
2026-06-07days on market $105,000 Active 73 DOM
-
2026-06-03days on market $105,000 Active 69 DOM
-
2026-06-02days on market $105,000 Active 68 DOM
-
2026-06-01days on market $105,000 Active 67 DOM
-
2026-05-31days on market $105,000 Active 66 DOM
-
2026-05-30days on market $105,000 Active 65 DOM
-
2026-03-26$105,000 Active 394-char remark
Show marketing remark (394 chars)
This home does need some tlc, although it may be a fixer upper, it does have a great warehouse in the back for anyone who works from home or is wanting to work from home. There are a number of possibilities for the use of this warehouse, whether you're a welder, mechanic or just looking for a place to keep your belongings, this home is for you. Come take a look, you will regret missing out!!
-
2025-12-29$115,000 Active
-
2011-03-18soldstatus
-
2005-03-04soldstatus
-
2004-10-01soldstatus
ⓘ Source: listings_history table (triggers on properties + properties_extension) + one-shot
backfill from property_details.listing_events for pre-trigger history.
Tax reassessment forecast TX · Resets to sale price
- Current annual tax
- $1,221 · $102/mo
- Projected year-2 tax
- $1,922 · $160/mo
- Expected delta
- +$701/yr (+$58/mo · 57.4%)
ⓘ Screening estimate from a state-policy table — verify with the county assessor before closing.
Climate risk First Street
- Flood 4/10 Moderate FEMA zone X · 22% chance over 30 yrs
- Wildfire 1/10 Low
- Heat 9/10 Extreme 7 d/yr ≥109°F today · 23 d/yr by 30 yrs out
- Wind 9/10 Extreme 99% chance of damaging wind over 30 yrs
- Air quality 2/10 Low 1 unhealthy d/yr today · 1 by 30 yrs out
Nearby sold comps map
Loading sold comps map…
Walkable amenities ~0.75 mi
Loading nearby amenities…
Taxation est. · year 1
- Rental income
- $10,287
- − Mortgage interest
- −$5,882
- − Property taxes
- −$1,221
- − Insurance
- −$525
- − Repairs & maintenance
- −$823
- − Management
- −$823
- − Depreciation
- −$3,055
- Taxable loss
- −$2,041
- Est. tax savings @ 24.0%
- +$490
- After-tax cash flow
- $263/yr
For passive investors: Depreciation is non-cash, so a rental often shows a tax loss while cash-flowing — sheltering income. Rental losses are passive: they offset passive income freely, and up to $25,000/yr can offset ordinary (W-2) income if you actively participate and your MAGI is under $100k (phasing out to $0 by $150k); unused losses carry forward. On sale, claimed depreciation is recaptured at up to 25%, and gains may owe capital-gains tax (a 1031 exchange can defer both). Figures are a year-1 estimate at your 24.0% rate — not tax advice; consult a CPA.
Schools (NCES district)
- District
- Beaumont ISD
- NCES district ID
- 4809670
- Math proficiency
- 14% ▼ -13.00%
- Reading proficiency
- 22% ▼ -7.00%
- Median HH income
- $41,683
- Composite
- 15.43/100
- National rank
- #9316
- State rank
- #789 of 826 in TX
Livability — Beaumont
- Score
- 64/100
- State rank
- #739
- US rank
- #13710
Category grades
Schools grade is shown separately in the Schools card above.
Census & demographics
- Census place
- Beaumont, TX
- County
- Jefferson County · 203,592 people
- City population
- 125,901
- Metro
- Beaumont-Port Arthur, TX
- Population (ZIP)
- 38,259
- Household income
- $54,633
- Rent vs Own
- Severe rent burden
- 776.0
Population outlook (Jefferson County) Hauer SSP2
- Today (2025)
- 259,015 people
- By 2030
- 260,685 · +0.6%
- By 2040
- 263,309 · +1.7%
- By 2050
- 265,237 · +2.4%
- By 2075
- 270,193 · +4.3%
- By 2100
- 255,628 · -1.3%
Race, ethnicity, and origin ACS 2023
- Neighborhood character
- Diverse neighborhood (Simpson 0.66)
- Race & ethnicity
- Black 46% White 29% Hispanic / Latino 21% Two or more races 6% Asian 2%
- Hispanic origin (detail)
- Mexican 13%
- Common ancestry
- Lithuanian 5% Italian 1%
- Foreign-born
- 8% · Canada, Vietnam
- Languages at home
- 80% English-only · Spanish 18% Other Indo-European 1%
Political lean MEDSL · Jefferson
- 2024 margin
- Lean R (+8.9) · D 45.1% · R 54.0%
- 2008→2024 swing
- -11.1pp toward R · 2008: 2.2pp · 2024: -8.9pp
- All cycles
- 2024: R+8.9 2020: R+1.6 2016: R+0.5 2012: D+1.6 2008: D+2.2
Not yet ingested
- Civics
- —
Market trends
- HPI YoY
- ▼ -54.76%
- Current HPI
- 129.3696
- Rent YoY
- —
- Metro
- Beaumont-Port Arthur, TX
- State GDP YoY
- ▲ 3.95%
- F500 in state
- 110
Industry mix (Fortune 500 HQ in TX)
| Industry | F500 HQs | Revenue |
|---|---|---|
| Energy | 16 | $1,198B |
|
||
| Technology | 5 | $198B |
|
||
| Engineering / Construction | 4 | $72B |
|
||
| Energy Services | 3 | $60B |
|
||
| Utilities | 3 | $41B |
|
||
| Healthcare | 2 | $330B |
|
||
Price history
-8.7% since first listed5 events — show timeline
- 2026-03-26 Listed $105,000 BBOR
- 2025-12-29 Listed $115,000 BBOR
- 2011-03-18 Sold (Public Records) — Public Records
- 2005-03-04 Sold (Public Records) — Public Records
- 2004-10-01 Sold (Public Records) — Public Records
Property tax history
+10.0%/yrLatest (2025): $1,221 · +0.1% YoY. Source: county tax records.
Cash-flow waterfall
monthlySold comps — $/sqft
last 12 mo · ≤1 miLoading sold comps…