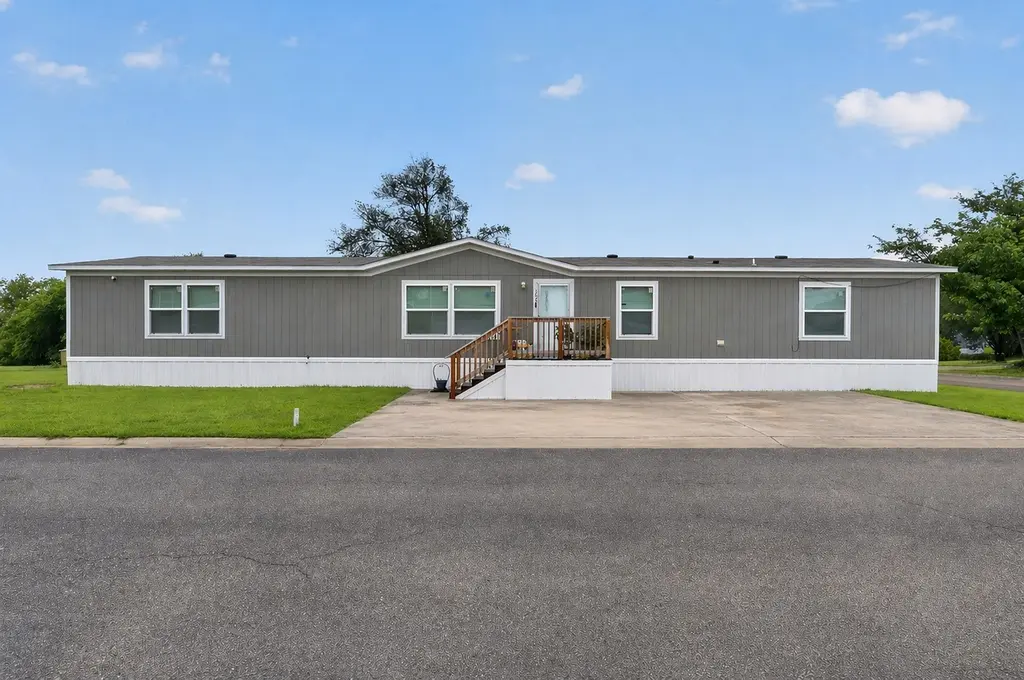
153 Cedar Grove Loop · Copperas Cove, TX
Flood risk No data
- FEMA flood zone
- —
- Chance of flooding over 30 yrs
- —
- Est. flood insurance / yr
- —
Fire risk No data
- Est. fire insurance / yr
- —
Heat risk No data
- Hot days now (above threshold)
- —
- Hot days in 30 yrs
- —
Wind risk No data
- Chance of severe wind over 30 yrs
- —
Air-quality risk No data
- Unhealthy air days now
- —
- Unhealthy air days in 30 yrs
- —
Risk factors via First Street. Map © Google.
Why this score? — see what drove the B+ grade
The composite is a weighted blend of 9 inputs, each scored 0–100. Each bar is that input's sub-score; the figure is the points it added to the 100-point composite (weight × sub-score).
- Cash flow +30.0/30.0
- ARV discount +15.0/15.0
- DSCR +10.0/10.0
- 1% rule +9.8/10.0
- Condition / age +4.0/5.0
- Schools +3.6/10.0
- Livability +3.2/5.0
- Rent growth +2.4/5.0
- Appreciation +0.0/10.0
$125,000
🖨 Deal sheet 📄 Offer letter ✓ Due diligence
Listing remarks
5-bedroom, 3-bathroom manufactured home at 153 Cedar Grove Loop, Copperas Cove, TX just minutes from Fort Hood and Killeen. Built in 2024, the residence features high-end finishes and an expansive open floor plan. Outdoor Living: Includes two large decks (front and back) and two concrete slabs, ideal for grilling, patio furniture, or bonfires. Modern Security: Comes equipped with a full home security system. Community Amenities: Active Lifestyle: Access to basketball courts, a commercial playground, and a fitness center. Swimming & Relaxation: Features a 25-meter junior Olympic swimming pool with racing lanes, a standard pool, and a children’s pool. Enjoy a serene two-acre lake
Key facts
- Fishing dock
- Modern security
- Community amenities
Tags
Property features AI
Finance
- HOA & community: Association: Westwind Enterprises
Exterior
- Utilities: Has heating and cooling
- Home design: Residential property; Built in 2024
- Construction: Shingle and wood roof; Construction materials listed as unknown
- Exterior features: Lot with other/unspecified lot features; Community pool
Interior
- Kitchen: Electric oven; Free-standing range
- Bedrooms: Five bedrooms on the first floor (including a primary bedroom)
- Bathrooms: Three full bathrooms
- Heating & cooling: Central heating (electric); Central air (electric)
- Interior features: Seller disclosure available
- Laundry & utility: Electric dryer hookup
Neighborhood map
What this means for you Summary
Snapshot
- This is a 5-bed/3.0-bath manufactured listed at $125k. Condition is rated good.
Deal economics
- At list price, monthly cash flow is $602 ($7k/yr) — positive.
- The deal already cash-flows at list — no discount required.
- Meets the 1% rule at list price ($2k rent vs $125k).
- Recommended offer: $121k (3.0% below list) — sets the bar for market timing.
- Cap rate 12.1% vs local median 3.4% in Copperas Cove — top-decile yield for the area; either an underpriced asset or a hidden risk that comps aren't pricing in. Stress-test before assuming the spread holds.
Location & tenants
- Location reads 65/100 on livability (#706 in TX) — a middle-class / working-renter tenant base. Strengths: cost of living A+, housing A+; Watch: schools C-, employment D+, amenities F.
- Copperas Cove ISD (suburban): math 41% / reading 42% proficiency, ranked #340 of 826 in TX (top 41%) — families likely to look elsewhere, expect single-tenant / working-renter base with shorter leases.
- Market conditions: Rents soft (-0.2%/yr); 605 active listings in the ZIP; 6 comparable units currently listed for rent nearby; rentals at typical pace (median 23d on market — plan ~3-4 weeks tenant-placement turnaround); 386 units permitted in Coryell County in 2024 (0 in 5+ unit buildings).
- This rent runs 31% of the median local income ($72k/yr) — at the standard rent-burdened threshold; future hikes will face affordability resistance.
Forward outlook
- Local home prices are declining (-3.0%/yr); year-one equity from $864 of loan paydown is wiped out by about $4k of value loss. Plan a longer hold.
- At projected returns (-3.0% appreciation + 0.0% rent growth), your $35k cash investment doubles in ~8 years — after that, you're playing with house money.
Negotiation context
- It's been on market 48 days — a 3% lower offer ($121k) is reasonable based on typical stale-listing flexibility.
Questions for the listing agent
- It's been on market 48 days. Have you received any prior offers? Is the seller open to a 3% concession, seller financing, or rate buy-down credit?
- Is there a deadline driving the sale (1031 exchange, divorce, estate, relocation)? That informs how much negotiation room exists.
- What's the average days-on-market for RENTAL listings here right now (not sales)? A rising rental-DOM trend means longer vacancies and softer asking-rent achievability than the comps imply.
- What's the recent tenant-quality profile in this submarket — average credit score on applications, eviction rate, late-payment / NSF rate, and stable-employment percentage? A property-management company in the area should have these aggregated.
- How much new for-sale + rental construction is in the pipeline within 1–3 miles? Heavy new supply typically softens prices + rents 12–24 months out; constrained supply supports both.
Investment metrics
- 1% rule
- 1.48% ✓
- Cap rate
- 12.07%
- Cash-on-cash
- 20.63%
- DSCR
- 1.92
- GRM
- 5.6
CMA / ARV
- ARV (median comp)
- $171,196
- List price
- $125,000
- Delta
- -26.98%
- Verdict
- UNDERPRICED
- Comps
- 1 within 2.0 mi
Projected returns pro-forma
-3.0% appreciation · 0.0% rent growth · sell at horizon
- IRR
- 9.5%
- Equity multiple
- 1.36×
- Total profit
- $12,656
- Equity at exit
- $18,638
- IRR
- 16.0%
- Equity multiple
- 2.13×
- Total profit
- $39,468
- Equity at exit
- $10,808
Cash invested: $35,000 (down + closing). Projections, not guarantees.
Landlord ↔ Tenant lean methodology
- Overall (STATE)
- 87 Strongly Landlord-Friendly
- State Texas
- 87 Strongly Landlord-Friendly · R+5
- County
- — inherits STATE
- City
- — inherits STATE
ZIP-level market 76522
- Home prices YoY
- -22.4%
- Rents YoY
- -0.2%
- Active inventory
- 605
- Price-to-rent
- 5.6×
Monthly cashflow live
- Estimated rent
- $1,855 high interval (Pro) →
- Mortgage (P&I)
- −$656
- Tax est. 1.5%
- −$156 /mo · $1,875/yr
- Insurance
- −$52
- HOA
- −$0
- Vacancy / Maint / Mgmt
- −$390
- Net cashflow
- $602
Break-even live
UW: 25.0% down · 7.5% · 30yr · 1.5% tax · 5.0% vac · 8.0% maint · 8.0% mgmt
Financing live
Cash to close
- Down payment
- $31,250
- Closing costs
- $3,750
- Reserves months
- —
- Total cash needed
- —
Loan-product check · same deal, 3 products live
Conventional
25% down · 7.5% · 30yr
- Down + closing
- —
- Monthly P&I
- —
- Monthly cashflow
- —
- DSCR
- —
- Eligible?
- —
Personal DTI + credit; lowest rate.
DSCR
20% down · 8.5% · 30yr
- Down + closing
- —
- Monthly P&I
- —
- Monthly cashflow
- —
- DSCR
- —
- Eligible?
- —
No personal income docs; deal must DSCR.
Hard money
10% down · 12.0% · 12mo
- Down + closing
- —
- Monthly P&I
- —
- Monthly cashflow
- —
- DSCR
- —
- Eligible?
- —
Short-term bridge; refi at stabilization.
Rent comps 6 comps
| Address | Beds | Baths | Sqft | Rent | $/sqft | DOM | Units | Dist |
|---|---|---|---|---|---|---|---|---|
| 1237 Briscoe Ct Copperas Cove, TX | 4.0 | 2.5 | 1788 | $1,750 | $0.98 | 23d | 1 | 0.55mi |
| 2107 Gail Dr Copperas Cove, TX | 4.0 | 2.0 | 1760 | $1,675 | $0.95 | 23d | 1 | 0.56mi |
| 1806 Bryce Ct Copperas Cove, TX | 4.0 | 2.0 | 1762 | $1,700 | $0.96 | 23d | 1 | 0.78mi |
| 2905 Markos Dr Copperas Cove, TX | 4.0 | 2.0 | 1530 | $1,650 | $1.08 | 43d | 1 | 0.82mi |
| 2569 Merganser Dr Copperas Cove, TX | 4.0 | 2.0 | 2032 | $2,200 | $1.08 | 43d | 1 | 1.16mi |
| 2032 Mallard Ct Copperas Cove, TX | 4.0 | 3.0 | 1979 | $1,895 | $0.96 | 13d | 1 | 1.18mi |
Listing history 11 events
-
2026-06-10days on market $125,000 Active 48 DOM
-
2026-06-09days on market $125,000 Active 47 DOM
-
2026-06-08days on market $125,000 Active 46 DOM
-
2026-06-07days on market $125,000 Active 45 DOM
-
2026-06-05days on market $125,000 Active 42 DOM
-
2026-06-03days on market $125,000 Active 41 DOM
-
2026-06-02days on market $125,000 Active 40 DOM
-
2026-06-01days on market $125,000 Active 39 DOM
-
2026-05-31pricedays on market $125,000 Active 38 DOM
-
2026-05-30days on market $130,000 Active 37 DOM
-
2026-04-23$130,000 Active 899-char remark
ⓘ Source: listings_history table (triggers on properties + properties_extension) + one-shot
backfill from property_details.listing_events for pre-trigger history.
Nearby sold comps map
Loading sold comps map…
Walkable amenities ~0.75 mi
Loading nearby amenities…
Taxation est. · year 1
- Rental income
- $22,261
- − Mortgage interest
- −$7,002
- − Property taxes
- −$1,875
- − Insurance
- −$625
- − Repairs & maintenance
- −$1,781
- − Management
- −$1,781
- − Depreciation
- −$3,636
- Taxable income
- $5,561
- Est. tax owed @ 24.0%
- −$1,335
- After-tax cash flow
- $5,885/yr
For passive investors: Depreciation is non-cash, so a rental often shows a tax loss while cash-flowing — sheltering income. Rental losses are passive: they offset passive income freely, and up to $25,000/yr can offset ordinary (W-2) income if you actively participate and your MAGI is under $100k (phasing out to $0 by $150k); unused losses carry forward. On sale, claimed depreciation is recaptured at up to 25%, and gains may owe capital-gains tax (a 1031 exchange can defer both). Figures are a year-1 estimate at your 24.0% rate — not tax advice; consult a CPA.
Condition & rehab AI · 11 photos
This 2024 manufactured home is in excellent condition with modern finishes and ample space. It's move-in ready with minor maintenance items to address.
Value-add opportunities
- Resale Paint exterior trim — Enhances curb appeal and value
- Rental Clean gutters — Keeps property in good condition and reduces maintenance costs
Renovation cost estimate screening
Value-add ROI direction
- Resale Paint exterior trim — Enhances curb appeal and value ↑
- Rental Clean gutters — Keeps property in good condition and reduces maintenance costs ↑
ⓘ Cost ranges are severity-bucket heuristics (US national rule-of-thumb). Get contractor quotes + a written scope before underwriting a rehab budget.
Schools (NCES district)
- District
- Copperas Cove ISD
- NCES district ID
- 4815240
- Math proficiency
- 41% ▼ -6.00%
- Reading proficiency
- 42% ▼ -2.00%
- Median HH income
- $51,072
- Composite
- 35.85/100
- National rank
- #4822
- State rank
- #340 of 826 in TX
Livability — Copperas Cove
- Score
- 65/100
- State rank
- #706
- US rank
- #13158
Category grades
Schools grade is shown separately in the Schools card above.
Census & demographics
- Census place
- Copperas Cove, TX
- County
- Coryell County · 61,053 people
- City population
- 42,118
- Metro
- Killeen-Temple, TX
- Population (ZIP)
- 42,118
- Household income
- $72,206
- Rent vs Own
- Severe rent burden
- 1019.0
Population outlook (Coryell County) Hauer SSP2
- Today (2025)
- 75,485 people
- By 2030
- 75,627 · +0.2%
- By 2040
- 74,898 · -0.8%
- By 2050
- 74,221 · -1.7%
- By 2075
- 72,688 · -3.7%
- By 2100
- 66,862 · -11.4%
Race, ethnicity, and origin ACS 2023
- Neighborhood character
- Diverse neighborhood (Simpson 0.66)
- Race & ethnicity
- White 53% Hispanic / Latino 21% Two or more races 20% Black 14% Asian 2%
- Hispanic origin (detail)
- Mexican 11% Puerto Rican 6%
- Common ancestry
- Romanian 2% Italian 2% Lithuanian 2%
- Foreign-born
- 7% · Canada, South Korea
- Languages at home
- 85% English-only · Spanish 10% German/W. Germanic 2% Other Asian/Pacific 1%
Political lean MEDSL · Coryell
- 2024 margin
- Solid R (+40.7) · D 29.1% · R 69.8% · Other 1.1%
- 2008→2024 swing
- -13.8pp toward R · 2008: -26.9pp · 2024: -40.7pp
- All cycles
- 2024: R+40.7 2020: R+33.5 2016: R+39.5 2012: R+36.6 2008: R+26.9
Not yet ingested
- Civics
- —
Market trends
- HPI YoY
- ▼ -53.11%
- Current HPI
- 183.9452
- Rent YoY
- ▼ -0.25%
- Metro
- Killeen-Temple, TX
- State GDP YoY
- ▲ 3.95%
- F500 in state
- 110
Industry mix (Fortune 500 HQ in TX)
| Industry | F500 HQs | Revenue |
|---|---|---|
| Energy | 16 | $1,198B |
|
||
| Technology | 5 | $198B |
|
||
| Engineering / Construction | 4 | $72B |
|
||
| Energy Services | 3 | $60B |
|
||
| Utilities | 3 | $41B |
|
||
| Healthcare | 2 | $330B |
|
||
Price history
-3.8% since first listed3 events — show timeline
- 2026-06-12 Listing Removed — HARMLS
- 2026-05-31 Price Changed $125,000 HARMLS
- 2026-04-23 Listed $130,000 HARMLS
Cash-flow waterfall
monthlySold comps — $/sqft
last 12 mo · ≤1 miLoading sold comps…