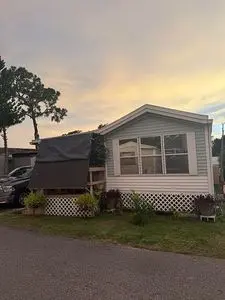
8389 Lady Slipper Ln · Riverview, FL
Flood risk No data
- FEMA flood zone
- —
- Chance of flooding over 30 yrs
- —
- Est. flood insurance / yr
- —
Fire risk No data
- Est. fire insurance / yr
- —
Heat risk No data
- Hot days now (above threshold)
- —
- Hot days in 30 yrs
- —
Wind risk No data
- Chance of severe wind over 30 yrs
- —
Air-quality risk No data
- Unhealthy air days now
- —
- Unhealthy air days in 30 yrs
- —
Risk factors via First Street. Map © Google.
Why this score? — see what drove the B grade
The composite is a weighted blend of 9 inputs, each scored 0–100. Each bar is that input's sub-score; the figure is the points it added to the 100-point composite (weight × sub-score).
- Cash flow +30.0/30.0
- 1% rule +10.0/10.0
- DSCR +10.0/10.0
- ARV discount +7.5/15.0
- Schools +4.2/10.0
- Livability +4.0/5.0
- Condition / age +3.8/5.0
- Rent growth +3.0/5.0
- Appreciation +0.0/10.0
$49,500
🖨 Deal sheet 📄 Offer letter ✓ Due diligence
Listing remarks
(Hidden River RV Resort) 55+ On the Alafia River, 2 miles from the Beer Shed. The resort features a gated, friendly, and activity-filled environment, highlighted by an incredible pool that & acirc; & euro; & trade; s almost always empty & acirc; & euro; & rdquo; a rare bonus. The clubhouse at the pool includes two pool tables and dartboards. - Remodeled, with vinyl wood flooring throughout -New plumbing Whole House, Triple Filter water treatment, and water softner. -Laundry Room with (LG) All-In-One washer/dryer. -(2) HiSense (Air/Heat/Dry/Dehumidify) -Third window a/c in 2nd bedroom/office -2024 New Rubber roof, lifetime warranty -Attached 10x10 shed, w/ 10ft
Key facts
- Incredible pool
- New plumbing
- Gated environment
Tags
Neighborhood map
What this means for you Summary
Snapshot
- This is a 2-bed/1.0-bath other listed at $50k. Condition is rated good.
Deal economics
- At list price, monthly cash flow is $1k ($14k/yr) — positive.
- The deal already cash-flows at list — no discount required.
- Meets the 1% rule at list price ($2k rent vs $50k).
- Recommended offer: $49k (1.5% below list) — sets the bar for market timing.
Location & tenants
- Location reads 79/100 on livability (#134 in FL, #2,000 nationally) — a middle-class / working-renter tenant base. Strengths: housing A+, health & safety A+, employment B+; Watch: amenities F.
- Hillsborough (suburban): math 47% / reading 50% proficiency, ranked #41 of 73 in FL (top 56%) — families likely to look elsewhere, expect single-tenant / working-renter base with shorter leases.
- Market conditions: Rents rising (+2.0%/yr); 228 active listings in the ZIP; solid renter incomes; 9,053 units permitted in Hillsborough County in 2024 (4,555 in 5+ unit buildings).
Forward outlook
- Local home prices are declining (-3.0%/yr); year-one equity from $342 of loan paydown is wiped out by about $1k of value loss. Plan a longer hold.
- Hillsborough County population projected at +37% by 2050 — long-run rental-demand tailwind backs the buy-and-hold thesis.
- At projected returns (-3.0% appreciation + 2.0% rent growth), your $14k cash investment doubles in ~2 years — after that, you're playing with house money.
Negotiation context
- It's been on market 23 days — a 2% lower offer ($49k) is reasonable based on typical stale-listing flexibility.
Questions for the listing agent
- Is there a deadline driving the sale (1031 exchange, divorce, estate, relocation)? That informs how much negotiation room exists.
- Schools are B-rated — typically a magnet for longer-tenancy family renters. What's the average tenant stay here, and is there a school-zone premium baked into asking?
- What's the average days-on-market for RENTAL listings here right now (not sales)? A rising rental-DOM trend means longer vacancies and softer asking-rent achievability than the comps imply.
- What's the recent tenant-quality profile in this submarket — average credit score on applications, eviction rate, late-payment / NSF rate, and stable-employment percentage? A property-management company in the area should have these aggregated.
- How much new for-sale + rental construction is in the pipeline within 1–3 miles? Heavy new supply typically softens prices + rents 12–24 months out; constrained supply supports both.
Investment metrics
- 1% rule
- 3.88% ✓
- Cap rate
- 34.80%
- Cash-on-cash
- 101.81%
- DSCR
- 5.53
- GRM
- 2.1
CMA / ARV
No comps found within radius.
Projected returns pro-forma
-3.0% appreciation · 2.0% rent growth · sell at horizon
- IRR
- —
- Equity multiple
- 5.69×
- Total profit
- $64,988
- Equity at exit
- $7,381
- IRR
- —
- Equity multiple
- 11.49×
- Total profit
- $145,448
- Equity at exit
- $4,280
Cash invested: $13,860 (down + closing). Projections, not guarantees.
Landlord ↔ Tenant lean methodology
- Overall (STATE)
- 87 Strongly Landlord-Friendly
- State Florida
- 87 Strongly Landlord-Friendly · R+3
- County
- — inherits STATE
- City
- — inherits STATE
ZIP-level market 33569
- Home prices YoY
- -16.7%
- Rents YoY
- 2.0%
- Active inventory
- 228
- Price-to-rent
- 2.1×
Monthly cashflow live
- Estimated rent
- $1,922 medium interval (Pro) →
- Mortgage (P&I)
- −$260
- Tax est. 1.5%
- −$62 /mo · $742/yr
- Insurance
- −$21
- HOA
- −$0
- Vacancy / Maint / Mgmt
- −$404
- Net cashflow
- $1,176
Break-even live
UW: 25.0% down · 7.5% · 30yr · 1.5% tax · 5.0% vac · 8.0% maint · 8.0% mgmt
Financing live
Cash to close
- Down payment
- $12,375
- Closing costs
- $1,485
- Reserves months
- —
- Total cash needed
- —
Loan-product check · same deal, 3 products live
Conventional
25% down · 7.5% · 30yr
- Down + closing
- —
- Monthly P&I
- —
- Monthly cashflow
- —
- DSCR
- —
- Eligible?
- —
Personal DTI + credit; lowest rate.
DSCR
20% down · 8.5% · 30yr
- Down + closing
- —
- Monthly P&I
- —
- Monthly cashflow
- —
- DSCR
- —
- Eligible?
- —
No personal income docs; deal must DSCR.
Hard money
10% down · 12.0% · 12mo
- Down + closing
- —
- Monthly P&I
- —
- Monthly cashflow
- —
- DSCR
- —
- Eligible?
- —
Short-term bridge; refi at stabilization.
Listing history 15 events
-
2026-06-18days on market $49,500 Active 23 DOM
-
2026-06-17days on market $49,500 Active 22 DOM
-
2026-06-16days on market $49,500 Active 21 DOM
-
2026-06-15days on market $49,500 Active 20 DOM
-
2026-06-13days on market $49,500 Active 18 DOM
-
2026-06-13days on market $49,500 Active 17 DOM
-
2026-06-09days on market $49,500 Active 14 DOM
-
2026-06-08days on market $49,500 Active 13 DOM
-
2026-06-07days on market $49,500 Active 12 DOM
-
2026-06-04days on market $49,500 Active 9 DOM
-
2026-06-03days on market $49,500 Active 8 DOM
-
2026-06-02days on market $49,500 Active 7 DOM
-
2026-06-01days on market $49,500 Active 6 DOM
-
2026-05-31days on market $49,500 Active 5 DOM
-
2026-05-26$49,500 Active
ⓘ Source: listings_history table (triggers on properties + properties_extension) + one-shot
backfill from property_details.listing_events for pre-trigger history.
Nearby sold comps map
Loading sold comps map…
Walkable amenities ~0.75 mi
Loading nearby amenities…
Taxation est. · year 1
- Rental income
- $23,058
- − Mortgage interest
- −$2,773
- − Property taxes
- −$742
- − Insurance
- −$248
- − Repairs & maintenance
- −$1,845
- − Management
- −$1,845
- − Depreciation
- −$1,440
- Taxable income
- $14,166
- Est. tax owed @ 24.0%
- −$3,400
- After-tax cash flow
- $10,711/yr
For passive investors: Depreciation is non-cash, so a rental often shows a tax loss while cash-flowing — sheltering income. Rental losses are passive: they offset passive income freely, and up to $25,000/yr can offset ordinary (W-2) income if you actively participate and your MAGI is under $100k (phasing out to $0 by $150k); unused losses carry forward. On sale, claimed depreciation is recaptured at up to 25%, and gains may owe capital-gains tax (a 1031 exchange can defer both). Figures are a year-1 estimate at your 24.0% rate — not tax advice; consult a CPA.
Condition & rehab AI · 0 photos
This home is in good condition with recent renovations, including a new rubber roof and water treatment system. It is move-in ready with potential for minor updates to enhance its curb appeal and interior aesthetics.
Value-add opportunities
- Both Landscaping improvements — Enhanced curb appeal can attract more buyers and renters.
- Both Painting interior walls — Fresh paint can improve the home's appearance and value.
Renovation cost estimate screening
Value-add ROI direction
- Both Landscaping improvements — Enhanced curb appeal can attract more buyers and renters. ↑
- Both Painting interior walls — Fresh paint can improve the home's appearance and value. ↑
ⓘ Cost ranges are severity-bucket heuristics (US national rule-of-thumb). Get contractor quotes + a written scope before underwriting a rehab budget.
Schools (NCES district)
- District
- Hillsborough
- NCES district ID
- 1200870
- Math proficiency
- 47% ▼ -8.00%
- Reading proficiency
- 50% ▼ -4.00%
- Median HH income
- $50,622
- Composite
- 41.6/100
- National rank
- #3435
- State rank
- #41 of 73 in FL
Livability — Riverview
- Score
- 79/100
- State rank
- #134
- US rank
- #2000
Category grades
Schools grade is shown separately in the Schools card above.
Census & demographics
- Census place
- Riverview, FL
- County
- Hillsborough County · 1,540,968 people
- City population
- 137,988
- Metro
- Tampa-St. Petersburg-Clearwater, FL
- Population (ZIP)
- 27,867
- Household income
- $105,275
- Rent vs Own
- Severe rent burden
- 562.0
Population outlook (Hillsborough County) Hauer SSP2
- Today (2025)
- 1,607,022 people
- By 2030
- 1,733,968 · +7.9%
- By 2040
- 1,979,565 · +23.2%
- By 2050
- 2,203,427 · +37.1%
- By 2075
- 2,667,893 · +66.0%
- By 2100
- 2,891,558 · +79.9%
Race, ethnicity, and origin ACS 2023
- Neighborhood character
- Diverse neighborhood (Simpson 0.60)
- Race & ethnicity
- White 58% Hispanic / Latino 21% Black 12% Two or more races 11% Asian 5%
- Hispanic origin (detail)
- Mexican 3% Puerto Rican 5% Cuban 5% Dominican 3%
- Common ancestry
- Romanian 2% Iranian 1% Lithuanian 1%
- Foreign-born
- 15% · Canada, Jamaica
- Languages at home
- 78% English-only · Spanish 14% Other Indo-European 3% Other Asian/Pacific 1%
Political lean MEDSL · Hillsborough
- 2024 margin
- Toss-up / Even · D 47.8% · R 50.9% · Other 1.3%
- 2008→2024 swing
- -10.2pp toward R · 2008: 7.1pp · 2024: -3.1pp
- All cycles
- 2024: R+3.1 2020: D+6.9 2016: D+6.8 2012: D+6.7 2008: D+7.1
Not yet ingested
- Civics
- —
Market trends
- HPI YoY
- ▼ -59.47%
- Current HPI
- 296.9169
- Rent YoY
- ▲ 2.00%
- Metro
- Tampa-St. Petersburg-Clearwater, FL
- State GDP YoY
- ▲ 3.28%
- F500 in state
- 36
Industry mix (Fortune 500 HQ in FL)
| Industry | F500 HQs | Revenue |
|---|---|---|
| Industrial Technology | 2 | $29B |
|
||
| Insurance | 2 | $17B |
|
||
| Retail | 1 | $60B |
|
||
| Technology Distribution | 1 | $58B |
|
||
| Homebuilding | 1 | $35B |
|
||
| Technology Manufacturing | 1 | $35B |
|
||
Price history
1 event — show timeline
- 2026-05-26 Listed $49,500 FSBO.com
Cash-flow waterfall
monthlySold comps — $/sqft
last 12 mo · ≤1 miLoading sold comps…