 🏗️ New Construction
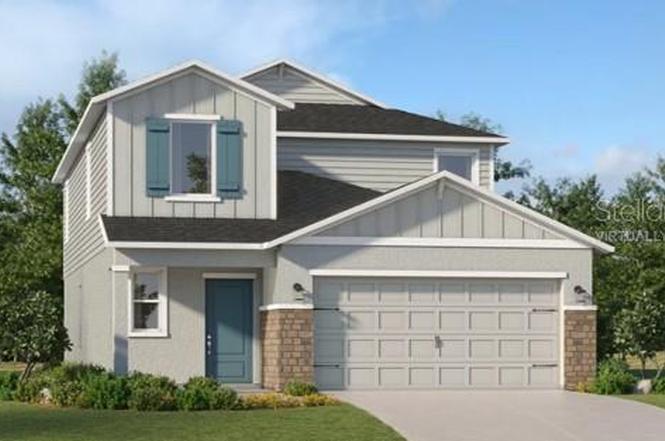
5452 Meadow Walk Dr · Haines City, FL
Flood risk No data
- FEMA flood zone
- —
- Chance of flooding over 30 yrs
- —
- Est. flood insurance / yr
- —
Fire risk No data
- Est. fire insurance / yr
- —
Heat risk No data
- Hot days now (above threshold)
- —
- Hot days in 30 yrs
- —
Wind risk No data
- Chance of severe wind over 30 yrs
- —
Air-quality risk No data
- Unhealthy air days now
- —
- Unhealthy air days in 30 yrs
- —
Risk factors via First Street. Map © Google.
Why this score? — see what drove the F grade
The composite is a weighted blend of 9 inputs, each scored 0–100. Each bar is that input's sub-score; the figure is the points it added to the 100-point composite (weight × sub-score).
- Cash flow +8.0/30.0
- ARV discount +7.5/15.0
- Livability +3.7/5.0
- Schools +3.5/10.0
- 1% rule +2.6/10.0
- Condition / age +2.5/5.0
- DSCR +2.0/10.0
- Rent growth +1.8/5.0
- Appreciation +0.0/10.0
$378,990
🖨 Deal sheet (PDF) 📄 Offer letter ✓ Due diligence
Listing remarks
One or more photo(s) has been virtually staged. Under Construction. This two-story Georgia will definitely be on your mind… This beauty highlights a modern open layout, seamlessly integrating a first-floor kitchen with a central island, a dining room and a welcoming family room with patio access. On the same level is a private owner's suite with an attached bathroom. Situated upstairs is a versatile loft for additional shared living space and four secondary bedrooms to provide restful retreats to family members and guests alike. Wynnstone is a lovely family friendly community of new single-family homes located in Davenport, FL. This amenity-rich community will include: Pool, Clubhous
Key facts
- Central island
- Pool
- First floor kitchen
Tags
Neighborhood map
What this means for you Summary
Snapshot
- This is a 5-bed/2.5-bath land listed at $379k.
Deal economics
- At list price, monthly cash flow is $-392 ($-5k/yr) — negative.
- To cash-flow at today's rent, offer at most $322k (15.0% below list).
- To meet the 1% rule (rent ≥ 1% of price), the offer needs to be $289k (23.8% below list).
- Recommended offer: $289k (23.8% below list) — sets the bar for 1% rule.
Location & tenants
- Location reads 74/100 on livability (#285 in FL, #4,575 nationally) — a middle-class / working-renter tenant base. Strengths: crime A+, cost of living A+, housing A+; Watch: amenities F, commute F, employment F.
- Polk (suburban): math 39% / reading 43% proficiency, ranked #62 of 73 in FL (top 85%) — families likely to look elsewhere, expect single-tenant / working-renter base with shorter leases.
- Zoned schools: Bella Citta (940 students, 35% FRL); Shelley S. Boone Middle School (math 25% / reading 25%, grade F, #517 of 571 statewide, top 91%, 1,403 students, 52% FRL); Ridge Community High School (math 12% / reading 33%, grade F, #539 of 667 statewide, top 81%, 2,711 students, 48% FRL).
- Zoned-school proficiency averages 24% at this address vs 41% district-wide (-17 pts) — the specific schools serving this property underperform the Polk average; the district grade overstates school quality for this exact location.
- Market conditions: Rents soft (-2.7%/yr); 1396 active listings in the ZIP; 12 comparable units currently listed for rent nearby; rentals at typical pace (median 21d on market — plan ~3-4 weeks tenant-placement turnaround); solid renter incomes; 10,384 units permitted in Polk County in 2024 (1,716 in 5+ unit buildings).
- This rent runs 43% of the median local income ($81k/yr) — at the standard rent-burdened threshold; future hikes will face affordability resistance.
Forward outlook
- Local home prices are declining (-3.0%/yr); year-one equity from $3k of loan paydown is wiped out by about $11k of value loss. Plan a longer hold.
- Polk County population projected at +33% by 2050 — long-run rental-demand tailwind backs the buy-and-hold thesis.
Negotiation context
- It's been on market 92 days — a 9% lower offer ($345k) is reasonable based on typical stale-listing flexibility.
Questions for the listing agent
- What do current leases actually rent for vs. the listed asking? Can we see a recent rent roll and the last 12 months of T-12 income?
- It's been on market 92 days. Have you received any prior offers? Is the seller open to a 24% concession, seller financing, or rate buy-down credit?
- What does the HOA fee cover, when was the last increase, and are there any pending special assessments or reserve-fund shortfalls?
- Why hasn't it sold? Are there any deal-killer items the seller is aware of (foundation, flood, title, zoning, code violations)?
- Is there a deadline driving the sale (1031 exchange, divorce, estate, relocation)? That informs how much negotiation room exists.
- Schools are D-rated, which usually means shorter tenancies and higher turnover. Who's the typical renter profile here, and what's been the actual vacancy rate?
- The area grade is low — what's the realistic commute time and amenity access for the typical tenant pool here? Any planned neighborhood developments (good or bad) we should know about?
- What's the average days-on-market for RENTAL listings here right now (not sales)? A rising rental-DOM trend means longer vacancies and softer asking-rent achievability than the comps imply.
- What's the recent tenant-quality profile in this submarket — average credit score on applications, eviction rate, late-payment / NSF rate, and stable-employment percentage? A property-management company in the area should have these aggregated.
- How much new for-sale + rental construction is in the pipeline within 1–3 miles? Heavy new supply typically softens prices + rents 12–24 months out; constrained supply supports both.
Investment metrics
- 1% rule
- 0.76% ✗
- Cap rate
- 5.05%
- Cash-on-cash
- -4.43%
- DSCR
- 0.80
- GRM
- 10.9
CMA / ARV
No comps found within radius.
Projected returns pro-forma
-3.0% appreciation · 0.0% rent growth · sell at horizon
- IRR
- -27.2%
- Equity multiple
- 0.11×
- Total profit
- $-94,754
- Equity at exit
- $56,509
- IRR
- -41.2%
- Equity multiple
- -0.39×
- Total profit
- $-147,038
- Equity at exit
- $32,768
Cash invested: $106,117 (down + closing). Projections, not guarantees.
Landlord ↔ Tenant lean methodology
- Overall (STATE)
- 87 Strongly Landlord-Friendly
- State Florida
- 87 Strongly Landlord-Friendly · R+3
- County
- — inherits STATE
- City
- — inherits STATE
ZIP-level market 33837
- Home prices YoY
- -33.9%
- Rents YoY
- -2.7%
- Active inventory
- 1396
- Price-to-rent
- 10.9×
Monthly cashflow live
- Estimated rent
- $2,888 high interval (Pro) →
- Mortgage (P&I)
- −$1,987
- Tax est. 1.5%
- −$474 /mo · $5,685/yr
- Insurance
- −$158
- HOA
- −$54
- Vacancy / Maint / Mgmt
- −$606
- Net cashflow
- $-392
Break-even live
Sensitivity live
| Price | -10% $-130 | -5% $-261 | +0% $-392 | +5% $-523 | +10% $-654 |
|---|---|---|---|---|---|
| Rent | -10% $-620 | -5% $-506 | +0% $-392 | +5% $-278 | +10% $-164 |
| Rate | -1.0pp $-201 | -0.5pp $-295 | base $-392 | +0.5pp $-490 | +1.0pp $-590 |
UW: 25.0% down · 7.5% · 30yr · 1.5% tax · 5.0% vac · 8.0% maint · 8.0% mgmt
Financing live
Cash to close
- Down payment
- $94,748
- Closing costs
- $11,370
- Reserves months
- —
- Total cash needed
- —
Loan-product check · same deal, 3 products live
Conventional
25% down · 7.5% · 30yr
- Down + closing
- —
- Monthly P&I
- —
- Monthly cashflow
- —
- DSCR
- —
- Eligible?
- —
Personal DTI + credit; lowest rate.
DSCR
20% down · 8.5% · 30yr
- Down + closing
- —
- Monthly P&I
- —
- Monthly cashflow
- —
- DSCR
- —
- Eligible?
- —
No personal income docs; deal must DSCR.
Hard money
10% down · 12.0% · 12mo
- Down + closing
- —
- Monthly P&I
- —
- Monthly cashflow
- —
- DSCR
- —
- Eligible?
- —
Short-term bridge; refi at stabilization.
Rent comps 12 comps
| Address | Beds | Baths | Sqft | Rent | $/sqft | DOM | Units | Dist |
|---|---|---|---|---|---|---|---|---|
| 5423 Meadow Walk Dr Unit Na Davenport, FL | 6.0 | 3.0 | 2463 | $3,150 | $1.28 | 25d | 1 | 0.07mi |
| 402 Sunset View Dr Davenport, FL | 5.0 | 3.0 | 1825 | $2,365 | $1.30 | 16d | 1 | 0.37mi |
| 915 Knollwood Dr Davenport, FL | 5.0 | 3.0 | 1863 | $2,400 | $1.29 | 25d | 1 | 0.40mi |
| 635 Knollwood Dr Davenport, FL | 5.0 | 3.0 | 1863 | $2,500 | $1.34 | 5d | 1 | 0.55mi |
| 456 Knollwood Dr Davenport, FL | 4.0 | 2.0 | 1762 | $2,500 | $1.42 | 23d | 1 | 0.58mi |
| 3676 Rolling Ridge Bnd Davenport, FL | 4.0 | 2.0 | 1824 | $2,500 | $1.37 | 21d | 1 | 0.66mi |
| 211 Boydfield Ln Davenport, FL | 4.0 | 2.5 | 1877 | $2,150 | $1.15 | 4d | 1 | 0.90mi |
| 188 Holly Village Dr Unit 188 Davenport, FL | 4.0 | 2.5 | 1620 | $2,000 | $1.23 | 5d | 1 | 0.90mi |
| 171 Boydfield Ln Davenport, FL | 4.0 | 2.5 | 1877 | $2,300 | $1.23 | 5d | 1 | 0.96mi |
| 2732 Gentle Rain Dr Davenport, FL | 4.0 | 2.0 | 2120 | $2,800 | $1.32 | 25d | 1 | 1.11mi |
| 3294 Partington Blvd Unit 3294 Davenport, FL | 4.0 | 2.0 | 1665 | $2,150 | $1.29 | 5d | 1 | 1.11mi |
| 687 Park Place Blvd Davenport, FL | 5.0 | 3.0 | 2447 | $2,399 | $0.98 | 25d | 1 | 1.42mi |
HOA detail
- Monthly dues
- $54 · $648/yr
- Likely covers
- pool
Listing history 10 events
-
2026-04-15status Pending
-
2026-04-03price $378,990
-
2026-03-31price $388,990
-
2026-03-26price $398,990
-
2026-03-25price $408,990
-
2026-03-17price $403,990
-
2026-02-18price $398,990
-
2026-01-21soldstatus $531,500
-
2026-01-20price $392,990
-
2026-01-13$390,990 Active
ⓘ Source: listings_history table (triggers on properties + properties_extension) + one-shot
backfill from property_details.listing_events for pre-trigger history.
Nearby sold comps map
Loading sold comps map…
Walkable amenities ~0.75 mi
Loading nearby amenities…
Taxation est. · year 1
- Rental income
- $34,653
- − Mortgage interest
- −$21,229
- − Property taxes
- −$5,685
- − Insurance
- −$1,895
- − Repairs & maintenance
- −$2,772
- − Management
- −$2,772
- − HOA
- −$648
- − Depreciation
- −$11,025
- Taxable loss
- −$11,374
- Est. tax savings @ 24.0%
- +$2,730
- After-tax cash flow
- $-1,972/yr
For passive investors: Depreciation is non-cash, so a rental often shows a tax loss while cash-flowing — sheltering income. Rental losses are passive: they offset passive income freely, and up to $25,000/yr can offset ordinary (W-2) income if you actively participate and your MAGI is under $100k (phasing out to $0 by $150k); unused losses carry forward. On sale, claimed depreciation is recaptured at up to 25%, and gains may owe capital-gains tax (a 1031 exchange can defer both). Figures are a year-1 estimate at your 24.0% rate — not tax advice; consult a CPA.
Schools (NCES district)
- District
- Polk
- NCES district ID
- 1201590
- Math proficiency
- 39% ▼ -11.00%
- Reading proficiency
- 43% ▼ -4.00%
- Median HH income
- $43,979
- Composite
- 34.74/100
- National rank
- #5132
- State rank
- #62 of 73 in FL
Livability — Haines City
- Score
- 74/100
- State rank
- #285
- US rank
- #4575
Category grades
Schools grade is shown separately in the Schools card above.
Census & demographics
- Census place
- Haines City, FL
- County
- Polk County · 740,051 people
- City population
- 51,255
- Metro
- Lakeland-Winter Haven, FL
- Population (ZIP)
- 47,389
- Household income
- $81,276
- Rent vs Own
- Severe rent burden
- 424.0
Population outlook (Polk County) Hauer SSP2
- Today (2025)
- 752,975 people
- By 2030
- 804,621 · +6.9%
- By 2040
- 906,117 · +20.3%
- By 2050
- 1,000,476 · +32.9%
- By 2075
- 1,197,520 · +59.0%
- By 2100
- 1,271,518 · +68.9%
Race, ethnicity, and origin ACS 2023
- Neighborhood character
- Diverse neighborhood (Simpson 0.68)
- Race & ethnicity
- Hispanic / Latino 42% White 36% Two or more races 16% Black 15% Asian 2%
- Hispanic origin (detail)
- Mexican 7% Puerto Rican 22% Cuban 2% Dominican 1%
- Common ancestry
- Hispanic 5% Romanian 3% Lithuanian 1%
- Foreign-born
- 18% · Canada, Jamaica
- Languages at home
- 55% English-only · Spanish 35% French/Haitian/Cajun 6% Other Indo-European 2%
Political lean MEDSL · Polk
- 2024 margin
- Strong R (+20.7) · D 39.2% · R 59.9%
- 2008→2024 swing
- -14.6pp toward R · 2008: -6.1pp · 2024: -20.7pp
- All cycles
- 2024: R+20.7 2020: R+14.4 2016: R+14.1 2012: R+6.8 2008: R+6.1
Not yet ingested
- Civics
- —
Market trends
- HPI YoY
- ▼ -131.62%
- Current HPI
- 256.8165
- Rent YoY
- ▼ -2.73%
- Metro
- Lakeland-Winter Haven, FL
- State GDP YoY
- ▲ 3.28%
- F500 in state
- 36
Industry mix (Fortune 500 HQ in FL)
| Industry | F500 HQs | Revenue |
|---|---|---|
| Industrial Technology | 2 | $29B |
|
||
| Insurance | 2 | $17B |
|
||
| Retail | 1 | $60B |
|
||
| Technology Distribution | 1 | $58B |
|
||
| Homebuilding | 1 | $35B |
|
||
| Technology Manufacturing | 1 | $35B |
|
||
Price history
-3.1% since first listed10 events — show timeline
- 2026-04-15 Pending — Stellar MLS as Distributed by MLS Grid
- 2026-04-03 Price Changed $378,990 Stellar MLS as Distributed by MLS Grid
- 2026-03-31 Price Changed $388,990 Stellar MLS as Distributed by MLS Grid
- 2026-03-26 Price Changed $398,990 Stellar MLS as Distributed by MLS Grid
- 2026-03-25 Price Changed $408,990 Stellar MLS as Distributed by MLS Grid
- 2026-03-17 Price Changed $403,990 Stellar MLS as Distributed by MLS Grid
- 2026-02-18 Price Changed $398,990 Stellar MLS as Distributed by MLS Grid
- 2026-01-21 Sold (Public Records) $531,500 Public Records
- 2026-01-20 Price Changed $392,990 Stellar MLS as Distributed by MLS Grid
- 2026-01-13 Listed $390,990 Stellar MLS as Distributed by MLS Grid
Cash-flow waterfall
monthlySold comps — $/sqft
last 12 mo · ≤1 miLoading sold comps…