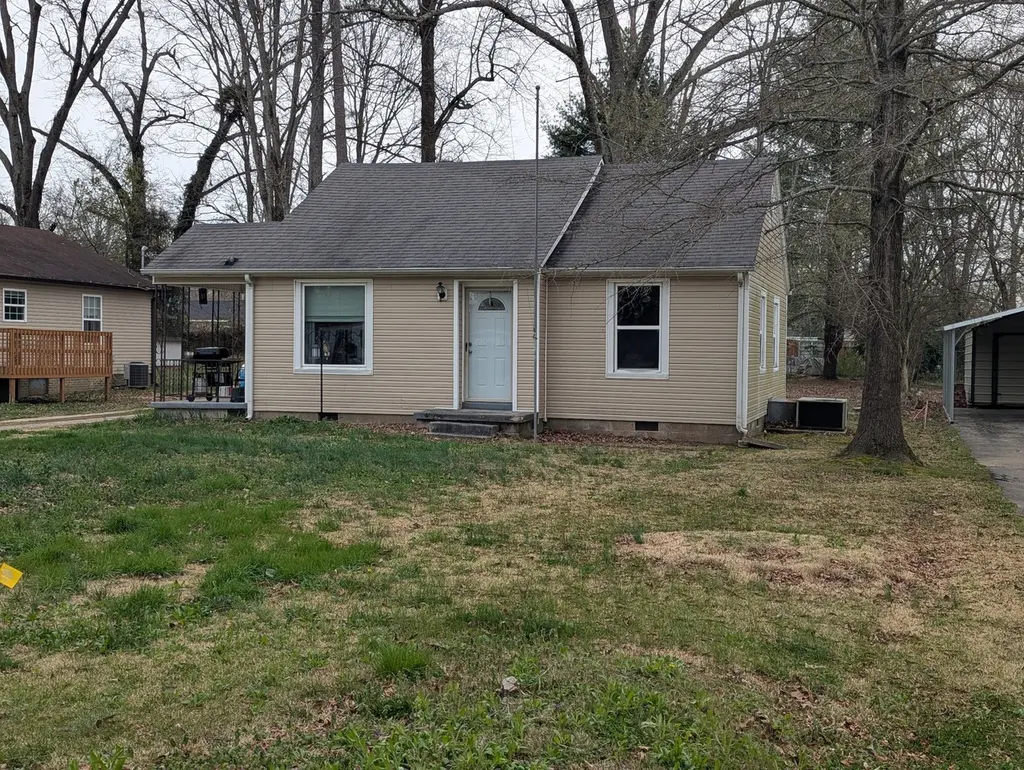
705 Circle Dr · Tullahoma, TN
Flood risk 1/10 · Minimal
- FEMA flood zone
- X (unshaded)
- Chance of flooding over 30 yrs
- 0.0%
- Est. flood insurance / yr
- $507 – $1,088
Fire risk 2/10 · Minimal
- Est. fire insurance / yr
- $949 – $1,763
Heat risk 5/10 · Moderate
- Hot days now (above 103°F)
- 7 days/yr
- Hot days in 30 yrs
- 19 days/yr
Wind risk 4/10 · Minor
- Chance of severe wind over 30 yrs
- 11.0%
Air-quality risk 2/10 · Minimal
- Unhealthy air days now
- 1 days/yr
- Unhealthy air days in 30 yrs
- 2 days/yr
Risk factors via First Street. Map © Google.
Why this score? — see what drove the D+ grade
The composite is a weighted blend of 9 inputs, each scored 0–100. Each bar is that input's sub-score; the figure is the points it added to the 100-point composite (weight × sub-score).
- Cash flow +15.6/30.0
- ARV discount +11.6/15.0
- DSCR +4.8/10.0
- Livability +3.4/5.0
- 1% rule +3.3/10.0
- Rent growth +2.5/5.0
- Condition / age +2.5/5.0
- Schools +2.0/10.0
- Appreciation +0.0/10.0
$159,900
🖨 Deal sheet (PDF) 📄 Offer letter ✓ Due diligence
Listing remarks MLS
Adorable 2BR/1BA house with beautiful HW flooring, Lg Living Room, Formal Dining Room, Kitchen w/refrigerator, dishwasher & oven/stove. Cute, covered side porch. Washer/dryer hookups. Large, level yard. Roof- approximately 2012. FREE 1-yr 2-10 Home Buyer's Warranty! All measurements approximate; not guaranteed.
Key facts
- 0.3 acre lot
- Built 1946
- Listed 2 days
Neighborhood map
What this means for you Summary
Snapshot
- This is a 2-bed/1.0-bath single-family listed at $160k.
Deal economics
- At list price, monthly cash flow is $66 ($796/yr) — positive.
- The deal already cash-flows at list — no discount required.
- To meet the 1% rule (rent ≥ 1% of price), the offer needs to be $132k (17.4% below list).
- Recommended offer: $132k (17.4% below list) — sets the bar for 1% rule.
- Cap rate 6.8% vs local median 3.4% in Tullahoma — top-decile yield for the area; either an underpriced asset or a hidden risk that comps aren't pricing in. Stress-test before assuming the spread holds.
Location & tenants
- Location reads 67/100 on livability (#109 in TN) — a middle-class / working-renter tenant base. Strengths: cost of living A+, housing A+; Watch: health & safety C-, crime D+, employment D+.
- Tullahoma (town): math 23% / reading 24% proficiency, ranked #101 of 139 in TN (top 73%) — low school quality limits family demand, transient renter base, plan for 1-2y turnover.
- Zoned schools: Bel Aire Elementary (math 17% / reading 27%, grade F, #601 of 952 statewide, top 66%, 370 students, 0% FRL); Tullahoma High School (math 15% / reading 32%, grade F, #145 of 332 statewide, top 44%, 1,137 students, 0% FRL) — zoned schools average 0% FRL vs 46% district-wide (46 pts lower); this property's tenant base skews higher-income than the district average.
- Market conditions: 326 active listings in the ZIP; 1 comparable units currently listed for rent nearby; 389 units permitted in Coffee County in 2024 (6 in 5+ unit buildings).
Forward outlook
- Local home prices are declining (-3.0%/yr); year-one equity from $1k of loan paydown is wiped out by about $5k of value loss. Plan a longer hold.
- Coffee County population projected at +9% by 2050 — modest demand growth; plan on rents tracking national, not racing it.
Negotiation context
- Only 2 days on market — expect competitive offers; lowballing is unlikely to land.
- 4 sale attempts since 14y ago with the ask held roughly flat each time — persistent listings suggest the price (not the market) is what's stuck; bring a comps-based counter.
- Current owner paid $88k; list at $160k implies a 81% gain — meaningful room to come down on a strong offer.
Risks & watch-outs
- Watch-outs: built in 1946 — expect roof / HVAC / electrical / plumbing capex.
- Climate carrying-cost: extreme-heat days projected 7→19/yr by 2055 (HVAC capex compounding) — expect insurance premiums to compound above CPI over the hold.
Questions for the listing agent
- Built in 1946 — when were the roof, HVAC, electrical panel, plumbing, and water heater last replaced?
- Is there a deadline driving the sale (1031 exchange, divorce, estate, relocation)? That informs how much negotiation room exists.
- Schools are F-rated, which usually means shorter tenancies and higher turnover. Who's the typical renter profile here, and what's been the actual vacancy rate?
- Crime grade is D in this area — have there been break-ins, vandalism, or insurance claims at this property in the last 3 years? What carrier currently insures it and at what premium?
- The area grade is low — what's the realistic commute time and amenity access for the typical tenant pool here? Any planned neighborhood developments (good or bad) we should know about?
- What's the average days-on-market for RENTAL listings here right now (not sales)? A rising rental-DOM trend means longer vacancies and softer asking-rent achievability than the comps imply.
- What's the recent tenant-quality profile in this submarket — average credit score on applications, eviction rate, late-payment / NSF rate, and stable-employment percentage? A property-management company in the area should have these aggregated.
- How much new for-sale + rental construction is in the pipeline within 1–3 miles? Heavy new supply typically softens prices + rents 12–24 months out; constrained supply supports both.
Investment metrics
- 1% rule
- 0.83% ✗
- Cap rate
- 6.79%
- Cash-on-cash
- 1.78%
- DSCR
- 1.08
- GRM
- 10.1
CMA / ARV
- ARV (on-the-fly)
- $175,740
- Comps found
- 7
Show comp detail 7 sales within ~0.75 mi
| Address | Dist | Beds/Ba | Sqft | Sold | Price | $/sf | Match |
|---|---|---|---|---|---|---|---|
| 705 Circle Dr | 0.00mi | 2/1.0 | 870 (0%) | 1mo | $155,000 | $178 | 99 |
| 26 Central Ave | 0.10mi | 2/1.0 | 928 (+7%) | 10mo | $160,000 | $172 | 76 |
| 403 Cedar Ln | 0.49mi | 2/1.0 | 850 (-2%) | 2mo | $195,000 | $229 | 72 |
| 30 Central Ave | 0.08mi | 2/1.0 | 800 (-8%) | 23mo | $204,900 | $256 | 64 |
| 215 White Oak St | 0.47mi | 2/2.0 | 853 (-2%) | 13mo | $230,000 | $270 | 60 |
| 305 White Oak St | 0.46mi | 2/1.0 | 912 (+5%) | 18mo | $174,500 | $191 | 56 |
| 910 W Grundy St | 0.51mi | 3/1.0 (+1) | 964 (+11%) | 18mo | $195,000 | $202 | 38 |
Match score weights: distance 35% · size 25% · config 20% · recency 20%. Top-matched comps best support the ARV.
Projected returns pro-forma
-3.0% appreciation · 3.0% rent growth · sell at horizon
- IRR
- -13.5%
- Equity multiple
- 0.51×
- Total profit
- $-21,743
- Equity at exit
- $23,842
- IRR
- -4.7%
- Equity multiple
- 0.69×
- Total profit
- $-13,729
- Equity at exit
- $13,825
Cash invested: $44,772 (down + closing). Projections, not guarantees.
Landlord ↔ Tenant lean methodology
- Overall (STATE)
- 87 Strongly Landlord-Friendly
- State Tennessee
- 87 Strongly Landlord-Friendly · R+13
- County
- — inherits STATE
- City
- — inherits STATE
ZIP-level market 37388
- Home prices YoY
- -19.9%
- Active inventory
- 326
- Price-to-rent
- 10.1×
Monthly cashflow live
- Estimated rent
- $1,321 medium interval (Pro) →
- Mortgage (P&I)
- −$839
- Tax from tax record
- −$72 /mo · $868/yr
- Insurance
- −$67
- HOA
- −$0
- Vacancy / Maint / Mgmt
- −$277
- Net cashflow
- $66
Break-even live
Sensitivity live
| Price | -10% $157 | -5% $112 | +0% $66 | +5% $21 | +10% $-24 |
|---|---|---|---|---|---|
| Rent | -10% $-38 | -5% $14 | +0% $66 | +5% $119 | +10% $171 |
| Rate | -1.0pp $147 | -0.5pp $107 | base $66 | +0.5pp $25 | +1.0pp $-17 |
UW: 25.0% down · 7.5% · 30yr · 1.5% tax · 5.0% vac · 8.0% maint · 8.0% mgmt
Financing live
Cash to close
- Down payment
- $39,975
- Closing costs
- $4,797
- Reserves months
- —
- Total cash needed
- —
Loan-product check · same deal, 3 products live
Conventional
25% down · 7.5% · 30yr
- Down + closing
- —
- Monthly P&I
- —
- Monthly cashflow
- —
- DSCR
- —
- Eligible?
- —
Personal DTI + credit; lowest rate.
DSCR
20% down · 8.5% · 30yr
- Down + closing
- —
- Monthly P&I
- —
- Monthly cashflow
- —
- DSCR
- —
- Eligible?
- —
No personal income docs; deal must DSCR.
Hard money
10% down · 12.0% · 12mo
- Down + closing
- —
- Monthly P&I
- —
- Monthly cashflow
- —
- DSCR
- —
- Eligible?
- —
Short-term bridge; refi at stabilization.
Rent comps 1 comps
| Address | Beds | Baths | Sqft | Rent | $/sqft | DOM | Units | Dist |
|---|---|---|---|---|---|---|---|---|
| 1315 Cedar Ln Tullahoma, TN | 1.0–2.0 | 1.0–2.0 | 902 | $1,395 | $1.55 | 25d | 1 | 0.89mi |
Listing history 12 events
-
2026-03-21status Pending
-
2026-03-19$159,900 Active
-
2026-03-19historical $159,900
-
2019-03-27soldstatus $88,500
-
2019-03-26soldstatus $88,500 Closed 321-char remark
Show marketing remark (321 chars)
Adorable 2BR/1BA house with beautiful HW flooring, Lg Living Room, Formal Dining Room, Kitchen w/refrigerator, dishwasher & oven/stove. Cute, covered side porch. Washer/dryer hookups. Large, level yard. Roof- approximately 2012. FREE 1-yr 2-10 Home Buyer's Warranty! All measurements approximate; not guaranteed.
-
2019-02-21historical Contingent - Financing 321-char remark
Show marketing remark (321 chars)
Adorable 2BR/1BA house with beautiful HW flooring, Lg Living Room, Formal Dining Room, Kitchen w/refrigerator, dishwasher & oven/stove. Cute, covered side porch. Washer/dryer hookups. Large, level yard. Roof- approximately 2012. FREE 1-yr 2-10 Home Buyer's Warranty! All measurements approximate; not guaranteed.
-
2019-02-15status Active 321-char remark
Show marketing remark (321 chars)
Adorable 2BR/1BA house with beautiful HW flooring, Lg Living Room, Formal Dining Room, Kitchen w/refrigerator, dishwasher & oven/stove. Cute, covered side porch. Washer/dryer hookups. Large, level yard. Roof- approximately 2012. FREE 1-yr 2-10 Home Buyer's Warranty! All measurements approximate; not guaranteed.
-
2019-02-06status Pending 321-char remark
Show marketing remark (321 chars)
Adorable 2BR/1BA house with beautiful HW flooring, Lg Living Room, Formal Dining Room, Kitchen w/refrigerator, dishwasher & oven/stove. Cute, covered side porch. Washer/dryer hookups. Large, level yard. Roof- approximately 2012. FREE 1-yr 2-10 Home Buyer's Warranty! All measurements approximate; not guaranteed.
-
2019-01-25$89,900 Active 321-char remark
Show marketing remark (321 chars)
Adorable 2BR/1BA house with beautiful HW flooring, Lg Living Room, Formal Dining Room, Kitchen w/refrigerator, dishwasher & oven/stove. Cute, covered side porch. Washer/dryer hookups. Large, level yard. Roof- approximately 2012. FREE 1-yr 2-10 Home Buyer's Warranty! All measurements approximate; not guaranteed.
-
2013-05-14historical 255-char remark
Show marketing remark (255 chars)
Adorable 2BR/1BA house with beautiful HW flooring, Lg Living Room, Formal Dining Room, Kitchen w/Refrigerator, Dishwasher, & Oven/Stove, and much more! Large, level yard. Newer Roof! FREE 1-Year Home Warranty! All measurements approx; not guaranteed.
-
2012-11-14$59,900 255-char remark
Show marketing remark (255 chars)
Adorable 2BR/1BA house with beautiful HW flooring, Lg Living Room, Formal Dining Room, Kitchen w/Refrigerator, Dishwasher, & Oven/Stove, and much more! Large, level yard. Newer Roof! FREE 1-Year Home Warranty! All measurements approx; not guaranteed.
-
2005-04-15soldstatus $60,000
ⓘ Source: listings_history table (triggers on properties + properties_extension) + one-shot
backfill from property_details.listing_events for pre-trigger history.
Tax reassessment forecast TN · Resets to sale price
- Current annual tax
- $868 · $72/mo
- Projected year-2 tax
- $1,135 · $95/mo
- Expected delta
- +$267/yr (+$22/mo · 30.8%)
ⓘ Screening estimate from a state-policy table — verify with the county assessor before closing.
Climate risk First Street
- Flood 1/10 Low FEMA zone X (unshaded) · 0% chance over 30 yrs
- Wildfire 2/10 Low
- Heat 5/10 Major 7 d/yr ≥103°F today · 19 d/yr by 30 yrs out
- Wind 4/10 Moderate 11% chance of damaging wind over 30 yrs
- Air quality 2/10 Low 1 unhealthy d/yr today · 2 by 30 yrs out
Nearby sold comps map
Loading sold comps map…
Walkable amenities ~0.75 mi
Loading nearby amenities…
Taxation est. · year 1
- Rental income
- $15,856
- − Mortgage interest
- −$8,957
- − Property taxes
- −$868
- − Insurance
- −$800
- − Repairs & maintenance
- −$1,268
- − Management
- −$1,268
- − Depreciation
- −$4,652
- Taxable loss
- −$1,957
- Est. tax savings @ 24.0%
- +$470
- After-tax cash flow
- $1,266/yr
For passive investors: Depreciation is non-cash, so a rental often shows a tax loss while cash-flowing — sheltering income. Rental losses are passive: they offset passive income freely, and up to $25,000/yr can offset ordinary (W-2) income if you actively participate and your MAGI is under $100k (phasing out to $0 by $150k); unused losses carry forward. On sale, claimed depreciation is recaptured at up to 25%, and gains may owe capital-gains tax (a 1031 exchange can defer both). Figures are a year-1 estimate at your 24.0% rate — not tax advice; consult a CPA.
Schools (NCES district)
- District
- Tullahoma
- NCES district ID
- 4704200
- Math proficiency
- 23% ▼ -5.00%
- Reading proficiency
- 24% ▼ -4.00%
- Median HH income
- $37,384
- Composite
- 19.61/100
- National rank
- #8752
- State rank
- #101 of 139 in TN
Livability — Tullahoma
- Score
- 67/100
- State rank
- #109
- US rank
- #11169
Category grades
Schools grade is shown separately in the Schools card above.
Census & demographics
- Census place
- Tullahoma, TN
- County
- Coffee County · 57,744 people
- City population
- 27,939
- Metro
- Tullahoma-Manchester, TN
- Population (ZIP)
- 27,939
- Household income
- $59,537
- Rent vs Own
- Severe rent burden
- 693.0
Population outlook (Coffee County) Hauer SSP2
- Today (2025)
- 57,234 people
- By 2030
- 58,571 · +2.3%
- By 2040
- 60,972 · +6.5%
- By 2050
- 62,537 · +9.3%
- By 2075
- 65,694 · +14.8%
- By 2100
- 63,355 · +10.7%
Race, ethnicity, and origin ACS 2023
- Neighborhood character
- Predominantly White (86%)
- Race & ethnicity
- White 86% Two or more races 6% Hispanic / Latino 5% Black 5%
- Hispanic origin (detail)
- Mexican 2%
- Common ancestry
- Slovak 3% Italian 3% Serbian 2%
- Foreign-born
- 2% · Canada, China
- Languages at home
- 96% English-only · Spanish 3%
Political lean MEDSL · Coffee
- 2024 margin
- Solid R (+55.1) · D 21.8% · R 76.9% · Other 1.3%
- 2008→2024 swing
- -25.7pp toward R · 2008: -29.4pp · 2024: -55.1pp
- All cycles
- 2024: R+55.1 2020: R+50.2 2016: R+48.6 2012: R+37.1 2008: R+29.4
Not yet ingested
- Civics
- —
Market trends
- HPI YoY
- ▼ -78.82%
- Current HPI
- 317.7062
- Rent YoY
- —
- Metro
- Tullahoma-Manchester, TN
- State GDP YoY
- ▲ 2.78%
- F500 in state
- 22
Industry mix (Fortune 500 HQ in TN)
| Industry | F500 HQs | Revenue |
|---|---|---|
| Healthcare | 3 | $91B |
|
||
| Retail | 3 | $72B |
|
||
| Transportation / Logistics | 1 | $88B |
|
||
| Paper / Packaging | 1 | $19B |
|
||
| Insurance | 1 | $13B |
|
||
| Energy | 1 | $12B |
|
||
Price history
+166.5% since first listed12 events — show timeline
- 2026-03-21 Pending — REALTRACS as Distributed by MLS Grid
- 2026-03-19 Listed $159,900 REALTRACS as Distributed by MLS Grid
- 2026-03-19 Coming Soon $159,900 REALTRACS as Distributed by MLS Grid
- 2019-03-27 Sold (Public Records) $88,500 Public Records
- 2019-03-26 Sold (MLS) $88,500 REALTRACS as Distributed by MLS Grid
- 2019-02-21 Contingent — REALTRACS as Distributed by MLS Grid
- 2019-02-15 Relisted — REALTRACS as Distributed by MLS Grid
- 2019-02-06 Pending — REALTRACS as Distributed by MLS Grid
- 2019-01-25 Listed $89,900 REALTRACS as Distributed by MLS Grid
- 2013-05-14 Listing Removed — REALTRACS as Distributed by MLS Grid
- 2012-11-14 Listed $59,900 REALTRACS as Distributed by MLS Grid
- 2005-04-15 Sold (Public Records) $60,000 Public Records
Property tax history
+1.3%/yrLatest (2025): $868 · +5.0% YoY. Source: county tax records.
Cash-flow waterfall
monthlySold comps — $/sqft
last 12 mo · ≤1 miLoading sold comps…