466 Highway 486 Hwy · Campti, LA
Flood risk 1/10 · Minimal
- FEMA flood zone
- X (unshaded)
- Chance of flooding over 30 yrs
- 0.0%
- Est. flood insurance / yr
- $507 – $1,088
Fire risk 4/10 · Minor
- Est. fire insurance / yr
- $1,269 – $2,357
Heat risk 8/10 · Major
- Hot days now (above 111°F)
- 7 days/yr
- Hot days in 30 yrs
- 21 days/yr
Wind risk 8/10 · Major
- Chance of severe wind over 30 yrs
- 80.0%
Air-quality risk 1/10 · Minimal
- Unhealthy air days now
- 0 days/yr
- Unhealthy air days in 30 yrs
- 0 days/yr
Risk factors via First Street. Map © Google.
Why this score? — see what drove the B grade
The composite is a weighted blend of 9 inputs, each scored 0–100. Each bar is that input's sub-score; the figure is the points it added to the 100-point composite (weight × sub-score).
- Cash flow +30.0/30.0
- 1% rule +10.0/10.0
- DSCR +10.0/10.0
- ARV discount +7.5/15.0
- Appreciation +6.1/10.0
- Schools +2.6/10.0
- Rent growth +2.5/5.0
- Livability +2.5/5.0
- Condition / age +2.5/5.0
$59,500
🖨 Deal sheet 📄 Offer letter ✓ Due diligence
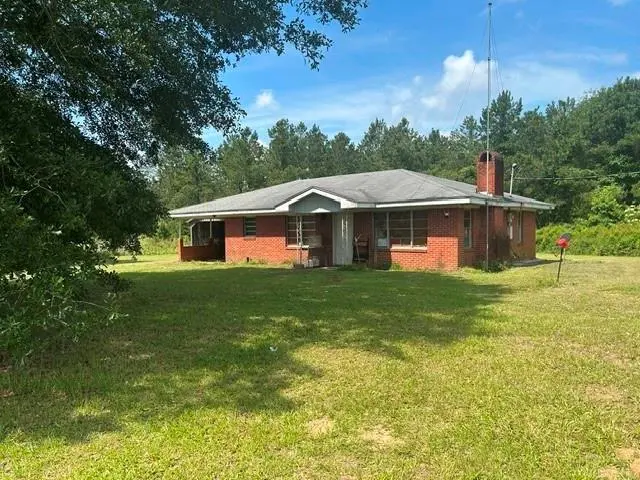
Listing remarks
Investor opportunity with acreage. This out of the way property sits on a partially wooded 4 acre lot and offers multiple features, including blueberry bushes, wild blackberries, a storage shed, and an open barn. The home is serviced by SWEPCO for electricity, Fairview Union Water System, however, the existing 100 foot well piping remains in place, though the pump has been removed. In need of TLC, this property is well suited for a flip, rental investment, or small homestead project. Fiber optic internet is available through Pelican Broadband, adding modern connectivity to a rural setting. Property is being sold strictly ''AS IS'' and ''WHERE IS'' without warranty as to fitness for use or r
Key facts
- Blueberry bushes
- Partially wooded lot
- Fiber optic internet
Tags
Neighborhood map
What this means for you Summary
Snapshot
- This is a 3-bed/1.0-bath single-family listed at $60k.
Deal economics
- At list price, monthly cash flow is $426 ($5k/yr) — positive.
- The deal already cash-flows at list — no discount required.
- Meets the 1% rule at list price ($1k rent vs $60k).
- Recommended offer: $59k (1.5% below list) — sets the bar for market timing.
Location & tenants
- Location reads 49/100 on livability (#434 in LA) — a working-class tenant base; expect higher turnover. Strengths: cost of living A+, crime A; Watch: schools D-, amenities F, commute F.
- Natchitoches Parish (town): math 29% / reading 36% proficiency, ranked #41 of 98 in LA (top 42%) — families likely to look elsewhere, expect single-tenant / working-renter base with shorter leases; 69% free/reduced lunch — lower-income household profile, screen leases tightly.
- Market conditions: 8 active listings in the ZIP; 95 units permitted in Natchitoches Parish in 2024 (0 in 5+ unit buildings).
Forward outlook
- In year one you build about $2k of equity ($411 loan paydown + $1k appreciation (2.1% local appreciation)).
- Natchitoches County population projected at -12% by 2050 — secular population decline; favor cash flow + early exit over multi-decade hold.
- At projected returns (2.1% appreciation + 3.0% rent growth), your $17k cash investment doubles in ~3 years — after that, you're playing with house money.
Negotiation context
- It's been on market 18 days — a 2% lower offer ($59k) is reasonable based on typical stale-listing flexibility.
Risks & watch-outs
- Climate carrying-cost: severe wind risk, 80% chance of damaging wind over 30y; extreme-heat days projected 7→21/yr by 2055 (HVAC capex compounding) — expect insurance premiums to compound above CPI over the hold.
Questions for the listing agent
- Built in 1967 — when were the roof, HVAC, electrical panel, plumbing, and water heater last replaced?
- Is there a deadline driving the sale (1031 exchange, divorce, estate, relocation)? That informs how much negotiation room exists.
- Schools are D-rated, which usually means shorter tenancies and higher turnover. Who's the typical renter profile here, and what's been the actual vacancy rate?
- What's the average days-on-market for RENTAL listings here right now (not sales)? A rising rental-DOM trend means longer vacancies and softer asking-rent achievability than the comps imply.
- What's the recent tenant-quality profile in this submarket — average credit score on applications, eviction rate, late-payment / NSF rate, and stable-employment percentage? A property-management company in the area should have these aggregated.
- How much new for-sale + rental construction is in the pipeline within 1–3 miles? Heavy new supply typically softens prices + rents 12–24 months out; constrained supply supports both.
Investment metrics
- 1% rule
- 1.69% ✓
- Cap rate
- 14.89%
- Cash-on-cash
- 30.70%
- DSCR
- 2.37
- GRM
- 4.9
CMA / ARV
No comps found within radius.
Projected returns pro-forma
2.12% appreciation · 3.0% rent growth · sell at horizon
- IRR
- 35.0%
- Equity multiple
- 2.90×
- Total profit
- $31,580
- Equity at exit
- $23,857
- IRR
- 36.0%
- Equity multiple
- 5.67×
- Total profit
- $77,884
- Equity at exit
- $34,655
Cash invested: $16,660 (down + closing). Projections, not guarantees.
Landlord ↔ Tenant lean methodology
- Overall (STATE)
- 90 Strongly Landlord-Friendly
- State Louisiana
- 90 Strongly Landlord-Friendly · R+12
- County
- — inherits STATE
- City
- — inherits STATE
ZIP-level market 71411
- Home prices YoY
- 2.5%
- Active inventory
- 8
- Price-to-rent
- 4.9×
Monthly cashflow live
- Estimated rent
- $1,006 medium interval (Pro) →
- Mortgage (P&I)
- −$312
- Tax from tax record
- −$32 /mo · $385/yr
- Insurance
- −$25
- HOA
- −$0
- Vacancy / Maint / Mgmt
- −$211
- Net cashflow
- $426
Break-even live
UW: 25.0% down · 7.5% · 30yr · 1.5% tax · 5.0% vac · 8.0% maint · 8.0% mgmt
Financing live
Cash to close
- Down payment
- $14,875
- Closing costs
- $1,785
- Reserves months
- —
- Total cash needed
- —
Loan-product check · same deal, 3 products live
Conventional
25% down · 7.5% · 30yr
- Down + closing
- —
- Monthly P&I
- —
- Monthly cashflow
- —
- DSCR
- —
- Eligible?
- —
Personal DTI + credit; lowest rate.
DSCR
20% down · 8.5% · 30yr
- Down + closing
- —
- Monthly P&I
- —
- Monthly cashflow
- —
- DSCR
- —
- Eligible?
- —
No personal income docs; deal must DSCR.
Hard money
10% down · 12.0% · 12mo
- Down + closing
- —
- Monthly P&I
- —
- Monthly cashflow
- —
- DSCR
- —
- Eligible?
- —
Short-term bridge; refi at stabilization.
Listing history 17 events
-
2026-06-19days on market $59,500 Active 18 DOM
-
2026-06-18days on market $59,500 Active 17 DOM
-
2026-06-17days on market $59,500 Active 16 DOM
-
2026-06-16days on market $59,500 Active 15 DOM
-
2026-06-15days on market $59,500 Active 14 DOM
-
2026-06-14days on market $59,500 Active 12 DOM
-
2026-06-12days on market $59,500 Active 11 DOM
-
2026-06-09days on market $59,500 Active 8 DOM
-
2026-06-08days on market $59,500 Active 7 DOM
-
2026-06-07days on market $59,500 Active 6 DOM
-
2026-06-07days on market $59,500 Active 5 DOM
-
2026-06-04days on market $59,500 Active 2 DOM
-
2026-06-01remarks 699-char remark
-
2026-06-01pricestatusdays on market $59,500 Active 1 DOM
-
2026-04-14price $70,000
-
2026-03-17price $79,000
-
2025-10-28$85,000 Active
ⓘ Source: listings_history table (triggers on properties + properties_extension) + one-shot
backfill from property_details.listing_events for pre-trigger history.
Tax reassessment forecast LA · Resets to sale price
- Current annual tax
- $385 · $32/mo
- Projected year-2 tax
- $385 · $32/mo
- Expected delta
- $0/yr ($0/mo · 0.0%)
ⓘ Screening estimate from a state-policy table — verify with the county assessor before closing.
Climate risk First Street
- Flood 1/10 Low FEMA zone X (unshaded) · 0% chance over 30 yrs
- Wildfire 4/10 Moderate
- Heat 8/10 Severe 7 d/yr ≥111°F today · 21 d/yr by 30 yrs out
- Wind 8/10 Severe 80% chance of damaging wind over 30 yrs
- Air quality 1/10 Low 0 unhealthy d/yr today · 0 by 30 yrs out
Nearby sold comps map
Loading sold comps map…
Walkable amenities ~0.75 mi
Loading nearby amenities…
Taxation est. · year 1
- Rental income
- $12,077
- − Mortgage interest
- −$3,333
- − Property taxes
- −$385
- − Insurance
- −$298
- − Repairs & maintenance
- −$966
- − Management
- −$966
- − Depreciation
- −$1,731
- Taxable income
- $4,399
- Est. tax owed @ 24.0%
- −$1,056
- After-tax cash flow
- $4,059/yr
For passive investors: Depreciation is non-cash, so a rental often shows a tax loss while cash-flowing — sheltering income. Rental losses are passive: they offset passive income freely, and up to $25,000/yr can offset ordinary (W-2) income if you actively participate and your MAGI is under $100k (phasing out to $0 by $150k); unused losses carry forward. On sale, claimed depreciation is recaptured at up to 25%, and gains may owe capital-gains tax (a 1031 exchange can defer both). Figures are a year-1 estimate at your 24.0% rate — not tax advice; consult a CPA.
Schools (NCES district)
- District
- Natchitoches Parish
- NCES district ID
- 2201140
- Math proficiency
- 29% ▼ -27.00%
- Reading proficiency
- 36% ▼ -27.00%
- Median HH income
- $30,204
- Composite
- 26.36/100
- National rank
- #7235
- State rank
- #41 of 98 in LA
Livability — Campti
- Score
- 49/100
- State rank
- #434
- US rank
- #25896
Category grades
Schools grade is shown separately in the Schools card above.
Census & demographics
- Population (ZIP)
- 2,467
Population outlook (Natchitoches County) Hauer SSP2
- Today (2025)
- 38,130 people
- By 2030
- 37,412 · -1.9%
- By 2040
- 35,550 · -6.8%
- By 2050
- 33,580 · -11.9%
- By 2075
- 29,268 · -23.2%
- By 2100
- 23,909 · -37.3%
Race, ethnicity, and origin ACS 2023
- Neighborhood character
- Diverse neighborhood (Simpson 0.56)
- Race & ethnicity
- White 60% Black 27% Native American 6% Two or more races 4%
- Common ancestry
- Lithuanian 7% Slovak 5% Iranian 1%
Political lean MEDSL · Natchitoches
- 2024 margin
- Strong R (+22.4) · D 38.2% · R 60.5% · Other 1.3%
- 2008→2024 swing
- -15.0pp toward R · 2008: -7.3pp · 2024: -22.4pp
- All cycles
- 2024: R+22.4 2020: R+14.9 2016: R+11.0 2012: R+6.6 2008: R+7.3
Not yet ingested
- Civics
- —
Market trends
- HPI YoY
- ▲ 2.12%
- Current HPI
- 86.558
- Rent YoY
- —
- Metro
- —
- State GDP YoY
- ▲ 3.29%
- F500 in state
- 10
Industry mix (Fortune 500 HQ in LA)
| Industry | F500 HQs | Revenue |
|---|---|---|
| Telecommunications | 2 | $23B |
|
||
| Utilities | 1 | $12B |
|
||
| Wholesale / Distribution | 1 | $5B |
|
||
| Advertising | 1 | $2B |
|
||
Price history
-17.6% since first listed3 events — show timeline
- 2026-04-14 Price Changed $70,000 AcadianaMLS
- 2026-03-17 Price Changed $79,000 AcadianaMLS
- 2025-10-28 Listed $85,000 AcadianaMLS
Property tax history
+2.7%/yrLatest (2025): $385 · -4.8% YoY. Source: county tax records.
Cash-flow waterfall
monthlySold comps — $/sqft
last 12 mo · ≤1 miLoading sold comps…