 Multi-family
6 Tuttle St · Rockingham, VT
Flood risk 1/10 · Minimal
- FEMA flood zone
- X (unshaded)
- Chance of flooding over 30 yrs
- 0.0%
- Est. flood insurance / yr
- $473 – $860
Fire risk 3/10 · Minor
- Est. fire insurance / yr
- $480 – $892
Heat risk 3/10 · Minor
- Hot days now (above 94°F)
- 7 days/yr
- Hot days in 30 yrs
- 17 days/yr
Wind risk 4/10 · Minor
- Chance of severe wind over 30 yrs
- 8.0%
Air-quality risk 1/10 · Minimal
- Unhealthy air days now
- 0 days/yr
- Unhealthy air days in 30 yrs
- 0 days/yr
Risk factors via First Street. Map © Google.
Why this score? — see what drove the D+ grade
The composite is a weighted blend of 9 inputs, each scored 0–100. Each bar is that input's sub-score; the figure is the points it added to the 100-point composite (weight × sub-score).
- ARV discount +15.0/15.0
- Appreciation +10.0/10.0
- Cash flow +8.2/30.0
- Schools +5.0/10.0
- Rent growth +2.5/5.0
- Livability +2.5/5.0
- Condition / age +2.5/5.0
- DSCR +2.2/10.0
- 1% rule +1.8/10.0
$225,000
🖨 Deal sheet 📄 Offer letter ✓ Due diligence
Multi-family units
County records classify this as Multi-Family (2-4 Unit). Listing-text estimate: 1 unit. estimate disagrees with records
Listing remarks MLS
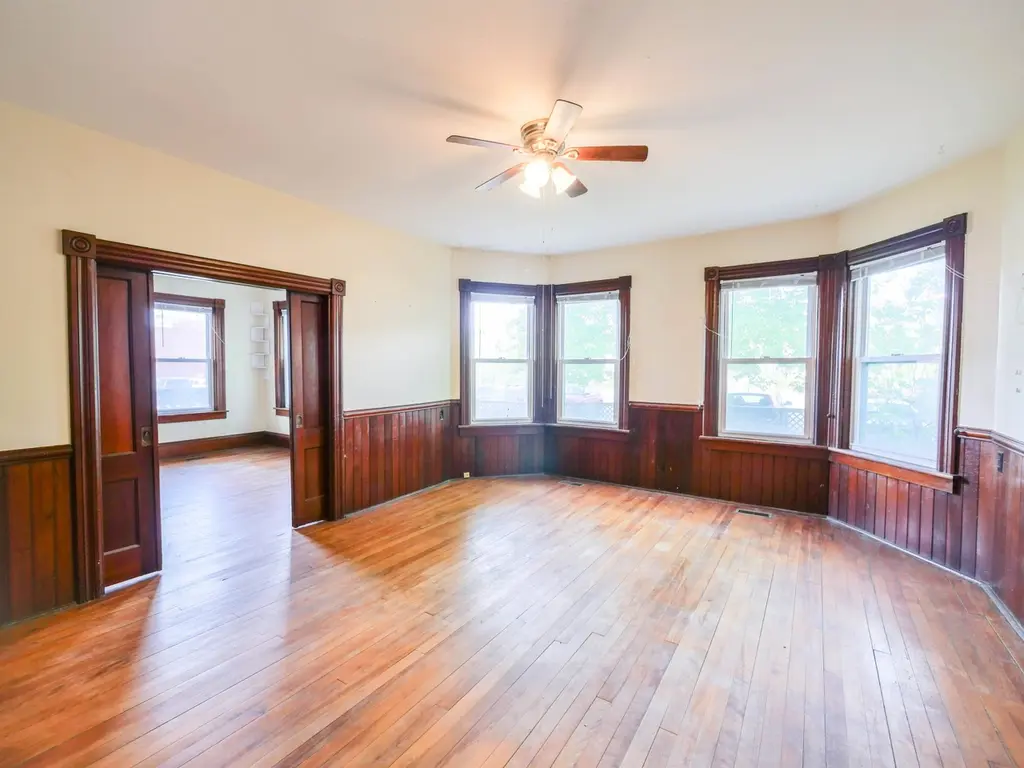
OPEN HOUSE SUNDAY, JUNE 14TH 11:00AM-2:00PM. In the village of Bellows Falls, overlooking the Connecticut River, sits this lovely Colonial 2-unit. With a vacant first floor, excellent tenants on the second where a porch commands river views, and an unfinished third floor leaving room for added value, this property is an exciting prospect for investment. All units have separate entrances. There is a 2-car garage and ample lawn space as well within the fenced yard. Beautiful accents throughout, and wood flooring. Could also be converted into a sizable single-family residence. Police and fire services across the street. Showings by appointment. Inquire today!
Key facts
- Fenced yard
- Separate entrances
- Ample lawn space
Tags
Property features AI
Exterior
- Parking: 2-car garage
- Utilities: Public water (at street and on-site); Public sewer (at street and on-site); 100 amp electric service provided by Green Mountain Power; Cable service (Xfinity); Fuel service: Cota & Cota; Cable available on-site; Internet: unknown
- Home design: Colonial duplex; Existing construction; Gray exterior color
- Construction: Built in 1920; Clapboard exterior; Shingle and slate roof
- Exterior features: City lot with sidewalks and river frontage; Water view of the Connecticut River; Paved driveway; In-town location
Interior
- Flooring: Hardwood flooring
- Bathrooms: 2 full bathrooms
- Heating & cooling: Forced air heating; Hot air heating
- Interior features: 10 total rooms; Unfinished basement with interior stairs, bulkhead and dirt floor; insulated; Water heater (owned)
Neighborhood map
What this means for you Summary
Snapshot
- This is a 4-bed/2.0-bath multifamily listed at $225k.
Deal economics
- At list price, monthly cash flow is $-211 ($-3k/yr) — negative.
- To cash-flow at today's rent, offer at most $188k (16.6% below list).
- To meet the 1% rule (rent ≥ 1% of price), the offer needs to be $153k (32.2% below list).
- Recommended offer: $153k (32.2% below list) — sets the bar for 1% rule.
Location & tenants
- Location reads: area grade D — affects rentability + tenant quality, not the cash-flow math above.
- Market conditions: 19 active listings in the ZIP; 188 units permitted in Windham County in 2024 (0 in 5+ unit buildings).
Forward outlook
- In year one you build about $24k of equity ($2k loan paydown + $22k appreciation (10.0% local appreciation)).
- Windham County population projected at -26% by 2050 — secular population decline; favor cash flow + early exit over multi-decade hold.
- By year 2, paydown + projected appreciation supports a ~$39k cash-out refi (75% LTV) — recoverable capital for the next deal without selling this one.
Negotiation context
- Only 6 days on market — expect competitive offers; lowballing is unlikely to land.
- 4 sale attempts since 23y ago with the ask held roughly flat each time — persistent listings suggest the price (not the market) is what's stuck; bring a comps-based counter.
- Current owner paid $124k; list at $225k implies a 81% gain — meaningful room to come down on a strong offer.
Risks & watch-outs
- Watch-outs: built in 1920 — expect roof / HVAC / electrical / plumbing capex.
Questions for the listing agent
- What do current leases actually rent for vs. the listed asking? Can we see a recent rent roll and the last 12 months of T-12 income?
- Built in 1920 — when were the roof, HVAC, electrical panel, plumbing, and water heater last replaced?
- Is there a deadline driving the sale (1031 exchange, divorce, estate, relocation)? That informs how much negotiation room exists.
- The area grade is low — what's the realistic commute time and amenity access for the typical tenant pool here? Any planned neighborhood developments (good or bad) we should know about?
- What's the average days-on-market for RENTAL listings here right now (not sales)? A rising rental-DOM trend means longer vacancies and softer asking-rent achievability than the comps imply.
- What's the recent tenant-quality profile in this submarket — average credit score on applications, eviction rate, late-payment / NSF rate, and stable-employment percentage? A property-management company in the area should have these aggregated.
- How much new apartment / multifamily construction is in the pipeline within 1–3 miles? Heavy new supply (>2% of stock underway) typically softens rents 12–24 months out; light construction supports rent growth.
Investment metrics
- 1% rule
- 0.68% ✗
- Cap rate
- 5.17%
- Cash-on-cash
- -4.02%
- DSCR
- 0.82
- GRM
- 12.3
CMA / ARV
- ARV (on-the-fly)
- $379,900
- Comps found
- 1
Show comp detail 1 sale within ~0.75 mi
| Address | Dist | Beds/Ba | Sqft | Sold | Price | $/sf | Match |
|---|---|---|---|---|---|---|---|
| 20 Pine St | 0.57mi | 4/2.0 | 2,412 (-8%) | 20mo | $350,000 | $145 | 43 |
Match score weights: distance 35% · size 25% · config 20% · recency 20%. Top-matched comps best support the ARV.
Projected returns pro-forma
10.0% appreciation · 3.0% rent growth · sell at horizon
- IRR
- 21.4%
- Equity multiple
- 2.73×
- Total profit
- $109,043
- Equity at exit
- $202,698
- IRR
- 19.3%
- Equity multiple
- 6.26×
- Total profit
- $331,555
- Equity at exit
- $437,126
Cash invested: $63,000 (down + closing). Projections, not guarantees.
Landlord ↔ Tenant lean methodology
- Overall (STATE)
- 41 Moderately Tenant-Leaning
- State Vermont
- 41 Moderately Tenant-Leaning · D+15
- County
- — inherits STATE
- City
- — inherits STATE
ZIP-level market 05101
- Home prices YoY
- 7.0%
- Active inventory
- 19
- Price-to-rent
- 12.3×
Monthly cashflow live
- Estimated rent
- $1,525 medium interval (Pro) →
- Mortgage (P&I)
- −$1,180
- Tax from tax record
- −$142 /mo · $1,708/yr
- Insurance
- −$94
- HOA
- −$0
- Vacancy / Maint / Mgmt
- −$320
- Net cashflow
- $-211
Break-even live
UW: 25.0% down · 7.5% · 30yr · 1.5% tax · 5.0% vac · 8.0% maint · 8.0% mgmt
Financing live
Cash to close
- Down payment
- $56,250
- Closing costs
- $6,750
- Reserves months
- —
- Total cash needed
- —
Loan-product check · same deal, 3 products live
Conventional
25% down · 7.5% · 30yr
- Down + closing
- —
- Monthly P&I
- —
- Monthly cashflow
- —
- DSCR
- —
- Eligible?
- —
Personal DTI + credit; lowest rate.
DSCR
20% down · 8.5% · 30yr
- Down + closing
- —
- Monthly P&I
- —
- Monthly cashflow
- —
- DSCR
- —
- Eligible?
- —
No personal income docs; deal must DSCR.
Hard money
10% down · 12.0% · 12mo
- Down + closing
- —
- Monthly P&I
- —
- Monthly cashflow
- —
- DSCR
- —
- Eligible?
- —
Short-term bridge; refi at stabilization.
Listing history 7 events
-
2026-06-18days on market $225,000 Active 6 DOM
-
2026-06-17days on market $225,000 Active 5 DOM
-
2026-06-16days on market $225,000 Active 4 DOM
-
2026-06-15days on market $225,000 Active 3 DOM
-
2026-06-15days on market $225,000 Active 2 DOM
-
2026-06-12remarks 664-char remark
-
2026-06-12$225,000 Active 1 DOM
ⓘ Source: listings_history table (triggers on properties + properties_extension) + one-shot
backfill from property_details.listing_events for pre-trigger history.
Tax reassessment forecast VT · Partial reset (capped growth)
- Current annual tax
- $1,708 · $142/mo
- Projected year-2 tax
- $2,992 · $249/mo
- Expected delta
- +$1,283/yr (+$107/mo · 75.1%)
ⓘ Screening estimate from a state-policy table — verify with the county assessor before closing.
Climate risk First Street
- Flood 1/10 Low FEMA zone X (unshaded) · 0% chance over 30 yrs
- Wildfire 3/10 Moderate
- Heat 3/10 Moderate 7 d/yr ≥94°F today · 17 d/yr by 30 yrs out
- Wind 4/10 Moderate 8% chance of damaging wind over 30 yrs
- Air quality 1/10 Low 0 unhealthy d/yr today · 0 by 30 yrs out
Nearby sold comps map
Loading sold comps map…
Walkable amenities ~0.75 mi
Loading nearby amenities…
Taxation est. · year 1
- Rental income
- $18,305
- − Mortgage interest
- −$12,603
- − Property taxes
- −$1,708
- − Insurance
- −$1,125
- − Repairs & maintenance
- −$1,464
- − Management
- −$1,464
- − Depreciation
- −$6,545
- Taxable loss
- −$6,606
- Est. tax savings @ 24.0%
- +$1,585
- After-tax cash flow
- $-946/yr
For passive investors: Depreciation is non-cash, so a rental often shows a tax loss while cash-flowing — sheltering income. Rental losses are passive: they offset passive income freely, and up to $25,000/yr can offset ordinary (W-2) income if you actively participate and your MAGI is under $100k (phasing out to $0 by $150k); unused losses carry forward. On sale, claimed depreciation is recaptured at up to 25%, and gains may owe capital-gains tax (a 1031 exchange can defer both). Figures are a year-1 estimate at your 24.0% rate — not tax advice; consult a CPA.
Schools (NCES district)
No district data.
Livability — Rockingham
No livability data for this city. (Only ~50 U.S. cities are tracked.)
Census & demographics
- Census place
- Bellows Falls, VT
- Population (ZIP)
- 4,135
Population outlook (Windham County) Hauer SSP2
- Today (2025)
- 40,432 people
- By 2030
- 38,472 · -4.8%
- By 2040
- 33,954 · -16.0%
- By 2050
- 29,774 · -26.4%
- By 2075
- 22,351 · -44.7%
- By 2100
- 15,961 · -60.5%
Race, ethnicity, and origin ACS 2023
- Neighborhood character
- Predominantly White (90%)
- Race & ethnicity
- White 90% Two or more races 6% Asian 3% Hispanic / Latino 2%
- Common ancestry
- Lithuanian 8% Slovak 5% Italian 4%
- Foreign-born
- 2% · South Korea
- Languages at home
- 96% English-only · Spanish 2% Korean 1%
Political lean MEDSL · Windham
- 2024 margin
- Solid D (+42.7) · D 69.6% · R 26.9% · Other 3.5%
- 2008→2024 swing
- -5.4pp toward R · 2008: 48.1pp · 2024: 42.7pp
- All cycles
- 2024: D+42.7 2020: D+47.3 2016: D+42.0 2012: D+49.2 2008: D+48.1
Not yet ingested
- Civics
- —
Market trends
- HPI YoY
- ▲ 21.90%
- Current HPI
- 335.6166
- Rent YoY
- —
- Metro
- —
- State GDP YoY
- —
- F500 in state
- 0
Price history
+74.4% since first listed7 events — show timeline
- 2026-06-11 Listed $225,000 PrimeMLS
- 2026-06-11 Listed $225,000 PrimeMLS
- 2003-12-01 Sold (Public Records) $124,500 Public Records
- 2003-11-26 Sold (MLS) $124,500 PrimeMLS
- 2003-11-26 Sold (MLS) $124,500 PrimeMLS
- 2003-07-10 Listed $129,000 PrimeMLS
- 2003-07-10 Listed $129,000 PrimeMLS
Property tax history
-7.0%/yrLatest (2024): $1,708 · +7.4% YoY. Source: county tax records.
Cash-flow waterfall
monthlySold comps — $/sqft
last 12 mo · ≤1 miLoading sold comps…