 🏷️ Likely Rental
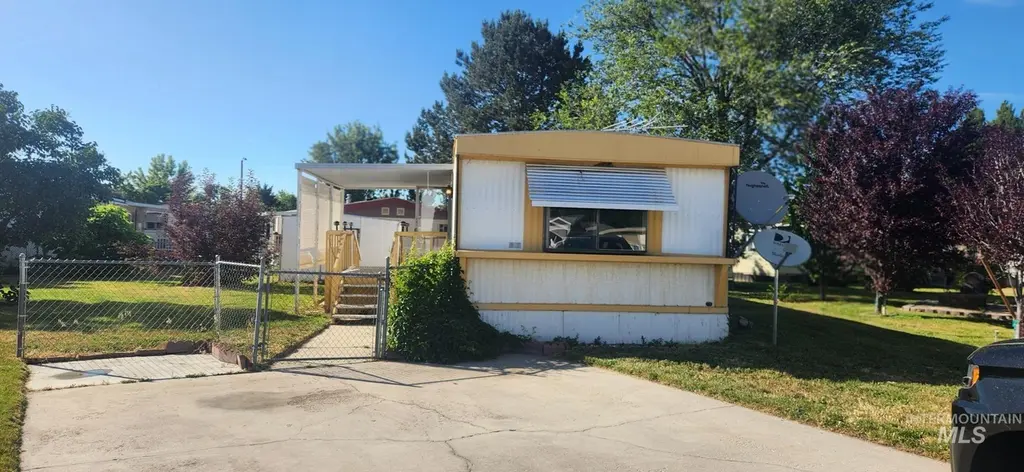
700 E Fairview #138 · Meridian, ID
Flood risk 2/10 · Minimal
- FEMA flood zone
- X (unshaded)
- Chance of flooding over 30 yrs
- 0.03%
- Est. flood insurance / yr
- $507 – $1,088
Fire risk 1/10 · Minimal
- Est. fire insurance / yr
- $584 – $1,086
Heat risk 4/10 · Minor
- Hot days now (above 96°F)
- 7 days/yr
- Hot days in 30 yrs
- 17 days/yr
Wind risk 1/10 · Minimal
- Chance of severe wind over 30 yrs
- —
Air-quality risk 7/10 · Major
- Unhealthy air days now
- 12 days/yr
- Unhealthy air days in 30 yrs
- 16 days/yr
Risk factors via First Street. Map © Google.
Why this score? — see what drove the B grade
The composite is a weighted blend of 9 inputs, each scored 0–100. Each bar is that input's sub-score; the figure is the points it added to the 100-point composite (weight × sub-score).
- Cash flow +30.0/30.0
- 1% rule +10.0/10.0
- DSCR +10.0/10.0
- ARV discount +7.5/15.0
- Schools +5.2/10.0
- Livability +4.1/5.0
- Rent growth +3.5/5.0
- Condition / age +2.2/5.0
- Appreciation +0.0/10.0
$37,777
🖨 Deal sheet (PDF) 📄 Offer letter ✓ Due diligence
Listing remarks
The is located in the welcoming and very well taken care of community of Fairview Terrace in a very central part of Meridian that is close to the Village, shopping and walking distance to many restaurants and downtown Meridian. The community offers a club house for gatherings, picnic area and a play ground. The home sits in a cul-de-sac with low traffic levels in a private setting. Buyer must apply for residency and receive approval prior to acceptance of an offer by the seller. Lot rent is $700 per month.
Key facts
- Picnic area
- Close to the village
- Play ground
Tags
Property features AI
Finance
- Other: Small lot (~5999 sq ft); Bus on city route
- HOA & community: Located in Fairview Terrace Estates (community information)
Exterior
- Parking: Finished driveway
- Utilities: City water service; Sewer connected; Cable connected; Broadband internet
- Home design: Mobile/manufactured home on a rented lot; One-story; Entry level: Main
- Construction: Built in 1978; Composition roof
- Exterior features: Partial fencing; Covered patio/deck; Garden; Manual sprinkler system; Storage shed; Paved road access; Located in a mobile home park
Interior
- Kitchen: Dishwasher; Built-in oven/range; Refrigerator; Disposal
- Bedrooms: 2 bedrooms (both on the main level)
- Flooring: Carpet; Vinyl
- Bathrooms: 2 bathrooms
- Heating & cooling: Electric forced-air heating; Wall/window air conditioning unit(s)
- Interior features: Main-level master bedroom; Family room; Kitchen island
- Laundry & utility: Electric water heater
Neighborhood map
What this means for you Summary
Snapshot
- This is a 2-bed/1.5-bath manufactured listed at $38k. Condition is rated fair.
Deal economics
- At list price, monthly cash flow is $982 ($12k/yr) — positive.
- The deal already cash-flows at list — no discount required.
- Meets the 1% rule at list price ($2k rent vs $38k).
- Recommended offer: $37k (1.5% below list) — sets the bar for market timing.
- Cap rate 37.5% vs local median 3.1% in Meridian — top-decile yield for the area; either an underpriced asset or a hidden risk that comps aren't pricing in. Stress-test before assuming the spread holds.
Location & tenants
- Location reads 82/100 on livability (#10 in ID, #1,176 nationally) — a professional / high-income tenant draw. Strengths: crime A+, commute A+, employment A+; Watch: cost of living D+.
- Joint School District No. 2 (suburban): math 53% / reading 67% proficiency, ranked #11 of 92 in ID (top 12%) — acceptable for families but not a draw, mixed tenant base, ~2y average lease.
- Zoned schools: River Valley Elementary School (math 53% / reading 53%, grade C, #124 of 357 statewide, top 35%, 427 students, 39% FRL); Mountain View High School (math 42% / reading 72%, grade C, #21 of 169 statewide, top 13%, 2,462 students, 16% FRL) — zoned schools at 28% FRL track the district average.
- Market conditions: Rents rising (+3.8%/yr); 748 active listings in the ZIP; 16 comparable units currently listed for rent nearby; rentals leasing fast (median 11d on market — plan ~1-2 weeks tenant-placement turnaround); solid renter incomes; 5,129 units permitted in Ada County in 2024 (414 in 5+ unit buildings).
Forward outlook
- Local home prices are declining (-3.0%/yr); year-one equity from $261 of loan paydown is wiped out by about $1k of value loss. Plan a longer hold.
- Ada County population projected at +45% by 2050 — long-run rental-demand tailwind backs the buy-and-hold thesis.
- At projected returns (-3.0% appreciation + 3.8% rent growth), your $11k cash investment doubles in ~1 year — after that, you're playing with house money.
Negotiation context
- It's been on market 15 days — a 2% lower offer ($37k) is reasonable based on typical stale-listing flexibility.
Questions for the listing agent
- Have any recent inspections been done? Can we get a copy of the seller's disclosures and any deferred-maintenance estimates?
- Built in 1978 — when were the roof, HVAC, electrical panel, plumbing, and water heater last replaced?
- Is there a deadline driving the sale (1031 exchange, divorce, estate, relocation)? That informs how much negotiation room exists.
- Schools are A-rated — typically a magnet for longer-tenancy family renters. What's the average tenant stay here, and is there a school-zone premium baked into asking?
- What's the average days-on-market for RENTAL listings here right now (not sales)? A rising rental-DOM trend means longer vacancies and softer asking-rent achievability than the comps imply.
- What's the recent tenant-quality profile in this submarket — average credit score on applications, eviction rate, late-payment / NSF rate, and stable-employment percentage? A property-management company in the area should have these aggregated.
- How much new for-sale + rental construction is in the pipeline within 1–3 miles? Heavy new supply typically softens prices + rents 12–24 months out; constrained supply supports both.
Investment metrics
- 1% rule
- 4.17% ✓
- Cap rate
- 37.50%
- Cash-on-cash
- 111.44%
- DSCR
- 5.96
- GRM
- 2.0
CMA / ARV
- ARV (on-the-fly)
- $108,808
- Comps found
- 9
Show comp detail 9 sales within ~0.75 mi
| Address | Dist | Beds/Ba | Sqft | Sold | Price | $/sf | Match |
|---|---|---|---|---|---|---|---|
| 700 E Fairview Ave #31 | 0.11mi | 2/2.0 | 826 (-12%) | 9mo | $74,900 | $91 | 66 |
| 700 E Fairview Ave #106 | 0.12mi | 3/2.0 (+1) | 1,040 (+11%) | 8mo | $120,000 | $115 | 63 |
| 424 W Cherry Ln #42 | 0.66mi | 2/2.0 | 924 (-2%) | 3mo | $153,400 | $166 | 63 |
| 424 W Cherry Ln #132 | 0.66mi | 3/2.0 (+1) | 900 (-4%) | 0mo | $114,900 | $128 | 55 |
| 424 W Cherry Ln #14 | 0.64mi | 2/2.0 | 924 (-2%) | 13mo | $97,900 | $106 | 55 |
| 314 W Cherry Ln #30 | 0.59mi | 2/2.0 | 924 (-2%) | 22mo | $94,900 | $103 | 50 |
| 424 W Cherry Ln #124 | 0.67mi | 3/2.0 (+1) | 900 (-4%) | 9mo | $104,900 | $117 | 48 |
| 424 W Cherry Ln #81 | 0.67mi | 2/2.0 | 990 (+6%) | 21mo | $115,000 | $116 | 40 |
| 424 W W Cherry Ln #128 | 0.66mi | 3/2.0 (+1) | 1,031 (+10%) | 23mo | $124,900 | $121 | 26 |
Match score weights: distance 35% · size 25% · config 20% · recency 20%. Top-matched comps best support the ARV.
Projected returns pro-forma
-3.0% appreciation · 3.84% rent growth · sell at horizon
- IRR
- —
- Equity multiple
- 6.47×
- Total profit
- $57,809
- Equity at exit
- $5,633
- IRR
- —
- Equity multiple
- 13.91×
- Total profit
- $136,598
- Equity at exit
- $3,266
Cash invested: $10,578 (down + closing). Projections, not guarantees.
Landlord ↔ Tenant lean methodology
- Overall (STATE)
- 91 Strongly Landlord-Friendly
- State Idaho
- 91 Strongly Landlord-Friendly · R+18
- County
- — inherits STATE
- City
- — inherits STATE
ZIP-level market 83642
- Rents YoY
- 3.8%
- Active inventory
- 748
- Price-to-rent
- 2.0×
Monthly cashflow live
- Estimated rent
- $1,574 high interval (Pro) →
- Mortgage (P&I)
- −$198
- Tax est. 1.5%
- −$47 /mo · $567/yr
- Insurance
- −$16
- HOA
- −$0
- Vacancy / Maint / Mgmt
- −$331
- Net cashflow
- $982
Break-even live
Sensitivity live
| Price | -10% $1,008 | -5% $995 | +0% $982 | +5% $969 | +10% $956 |
|---|---|---|---|---|---|
| Rent | -10% $858 | -5% $920 | +0% $982 | +5% $1,045 | +10% $1,107 |
| Rate | -1.0pp $1,001 | -0.5pp $992 | base $982 | +0.5pp $973 | +1.0pp $963 |
UW: 25.0% down · 7.5% · 30yr · 1.5% tax · 5.0% vac · 8.0% maint · 8.0% mgmt
Financing live
Cash to close
- Down payment
- $9,444
- Closing costs
- $1,133
- Reserves months
- —
- Total cash needed
- —
Loan-product check · same deal, 3 products live
Conventional
25% down · 7.5% · 30yr
- Down + closing
- —
- Monthly P&I
- —
- Monthly cashflow
- —
- DSCR
- —
- Eligible?
- —
Personal DTI + credit; lowest rate.
DSCR
20% down · 8.5% · 30yr
- Down + closing
- —
- Monthly P&I
- —
- Monthly cashflow
- —
- DSCR
- —
- Eligible?
- —
No personal income docs; deal must DSCR.
Hard money
10% down · 12.0% · 12mo
- Down + closing
- —
- Monthly P&I
- —
- Monthly cashflow
- —
- DSCR
- —
- Eligible?
- —
Short-term bridge; refi at stabilization.
Rent comps 16 comps
| Address | Beds | Baths | Sqft | Rent | $/sqft | DOM | Units | Dist |
|---|---|---|---|---|---|---|---|---|
| 1440 N Locust Grove Rd Meridian, ID | 2.0–3.0 | 2.5–3.0 | 1112 | $1,965 | $1.77 | 3d | 9 | 0.78mi |
| 1905 E Wilson Ln Unit 286-A Meridian, ID | 2.0 | 1.0 | 873 | $1,395 | $1.60 | 24d | 1 | 0.88mi |
| 1905 E Wilson Ln Unit 286-B Meridian, ID | 2.0 | 1.0 | 873 | $1,395 | $1.60 | 3d | 1 | 0.88mi |
| 1927 E Wilson Ln Meridian, ID | 2.0 | 1.0 | 873 | $1,395 | $1.60 | 19d | 1 | 0.89mi |
| 1949 E Wilson Ln Unit D Meridian, ID | 2.0 | 1.0 | 873 | $1,245 | $1.43 | 3d | 1 | 0.92mi |
| 511 W Pine Ave Unit D Meridian, ID | 2.0 | 1.0 | 700 | $1,195 | $1.71 | 3d | 1 | 0.97mi |
| 537 W Idaho Ave Meridian, ID | 2.0 | 1.5 | 1000 | $1,500 | $1.50 | 14d | 1 | 1.02mi |
| 539 W Idaho Ave Meridian, ID | 2.0 | 1.5 | 1100 | $1,500 | $1.36 | 15d | 1 | 1.02mi |
| 3104 N Venable Ln Meridian, ID | 1.0–3.0 | 1.0–2.5 | 1164 | $2,175 | $1.87 | 3d | 17 | 1.08mi |
| 1350 N Webb Way Meridian, ID | 1.0–3.0 | 1.0–2.0 | 975 | $3,152 | $3.23 | 24d | 1 | 1.09mi |
| 1374 W Sandalwood Dr Meridian, ID | 2.0 | 1.0 | 795 | $1,295 | $1.63 | 15d | 1 | 1.21mi |
| 1033 W Pine Ave Apt 3 Meridian, ID | 2.0 | 2.0 | 1014 | $1,401 | $1.38 | 3d | 1 | 1.27mi |
| 1069 W Pine Ave #3 Meridian, ID | 2.0 | 2.0 | 1014 | $1,496 | $1.48 | 3d | 1 | 1.29mi |
| 100 S Locust Grove Rd Meridian, ID | 2.0 | 2.0 | 1000 | $1,550 | $1.55 | 3d | 1 | 1.40mi |
| 100 S Locust Grove Rd Meridian, ID | 2.0 | 2.0 | 1000 | $1,475 | $1.48 | 11d | 1 | 1.40mi |
| 100 S Locust Grove Rd Unit 103 Meridian, ID | 2.0 | 2.0 | 1000 | $1,475 | $1.48 | 12d | 1 | 1.48mi |
Listing history 10 events
-
2026-06-18days on market $37,777 Active 15 DOM
-
2026-06-17days on market $37,777 Active 14 DOM
-
2026-06-16days on market $37,777 Active 13 DOM
-
2026-06-15days on market $37,777 Active 12 DOM
-
2026-06-13days on market $37,777 Active 10 DOM
-
2026-06-10days on market $37,777 Active 7 DOM
-
2026-06-09days on market $37,777 Active 6 DOM
-
2026-06-08days on market $37,777 Active 5 DOM
-
2026-06-07remarks 512-char remark
-
2026-06-07$37,777 Active 4 DOM
ⓘ Source: listings_history table (triggers on properties + properties_extension) + one-shot
backfill from property_details.listing_events for pre-trigger history.
Climate risk First Street
- Flood 2/10 Low FEMA zone X (unshaded) · 3% chance over 30 yrs
- Wildfire 1/10 Low
- Heat 4/10 Moderate 7 d/yr ≥96°F today · 17 d/yr by 30 yrs out
- Wind 1/10 Low
- Air quality 7/10 Severe 12 unhealthy d/yr today · 16 by 30 yrs out
Nearby sold comps map
Loading sold comps map…
Walkable amenities ~0.75 mi
Loading nearby amenities…
Taxation est. · year 1
- Rental income
- $18,887
- − Mortgage interest
- −$2,116
- − Property taxes
- −$567
- − Insurance
- −$189
- − Repairs & maintenance
- −$1,511
- − Management
- −$1,511
- − Depreciation
- −$1,099
- Taxable income
- $11,895
- Est. tax owed @ 24.0%
- −$2,855
- After-tax cash flow
- $8,933/yr
For passive investors: Depreciation is non-cash, so a rental often shows a tax loss while cash-flowing — sheltering income. Rental losses are passive: they offset passive income freely, and up to $25,000/yr can offset ordinary (W-2) income if you actively participate and your MAGI is under $100k (phasing out to $0 by $150k); unused losses carry forward. On sale, claimed depreciation is recaptured at up to 25%, and gains may owe capital-gains tax (a 1031 exchange can defer both). Figures are a year-1 estimate at your 24.0% rate — not tax advice; consult a CPA.
Condition & rehab AI · 3 photos
The home is a manufactured home in fair condition with some cosmetic updates needed. It is located in a well-maintained community with low traffic levels and is close to shopping and dining. The home could benefit from painting, roof repair, and landscaping updates to increase its value.
Repairs flagged
- Minor roof — The roof appears to have some discoloration and minor damage.
- Minor exterior siding — The siding shows some wear and tear, indicating minor damage or aging.
- Minor landscaping — The landscaping is simple and could benefit from some updates to enhance curb appeal.
Value-add opportunities
- Both paint exterior — Painting the exterior can improve the home's curb appeal and increase its value.
- Both repair roof — Repairing the roof can prevent further damage and improve the home's overall condition.
- Both update landscaping — Updating the landscaping can enhance the home's curb appeal and increase its value for both resale and rental purposes.
Renovation cost estimate screening
| Repair item | Severity | Est. cost |
|---|---|---|
| roof · The roof appears to have some discoloration and minor damage. | Minor | $500–3,000 |
| exterior siding · The siding shows some wear and tear, indicating minor damage or aging. | Minor | $500–3,000 |
| landscaping · The landscaping is simple and could benefit from some updates to enhance curb appeal. | Minor | $500–3,000 |
| Total estimated repair cost · 3 items | $1,500–9,000 |
Value-add ROI direction
- Both paint exterior — Painting the exterior can improve the home's curb appeal and increase its value. ↑
- Both repair roof — Repairing the roof can prevent further damage and improve the home's overall condition. ↑
- Both update landscaping — Updating the landscaping can enhance the home's curb appeal and increase its value for both resale and rental purposes. ↑
ⓘ Cost ranges are severity-bucket heuristics (US national rule-of-thumb). Get contractor quotes + a written scope before underwriting a rehab budget.
Schools (NCES district)
- District
- Joint School District No. 2
- NCES district ID
- 1602100
- Math proficiency
- 53% ▼ -6.00%
- Reading proficiency
- 67% ▼ -1.00%
- Median HH income
- $64,573
- Composite
- 52.42/100
- National rank
- #1576
- State rank
- #11 of 92 in ID
Livability — Meridian
- Score
- 82/100
- State rank
- #10
- US rank
- #1176
Category grades
Schools grade is shown separately in the Schools card above.
Census & demographics
- Census place
- Meridian, ID
- County
- Ada County · 522,161 people
- City population
- 138,302
- Metro
- Boise City, ID
- Population (ZIP)
- 62,279
- Household income
- $96,909
- Rent vs Own
- Severe rent burden
- 1574.0
Population outlook (Ada County) Hauer SSP2
- Today (2025)
- 535,818 people
- By 2030
- 585,751 · +9.3%
- By 2040
- 682,435 · +27.4%
- By 2050
- 775,818 · +44.8%
- By 2075
- 994,458 · +85.6%
- By 2100
- 1,148,884 · +114.4%
Race, ethnicity, and origin ACS 2023
- Neighborhood character
- Predominantly White (83%)
- Race & ethnicity
- White 83% Hispanic / Latino 9% Two or more races 7% Asian 3%
- Hispanic origin (detail)
- Mexican 7%
- Common ancestry
- Portuguese 3% Slovak 3% Lithuanian 3%
- Foreign-born
- 5% · Canada, South Korea, Jamaica
- Languages at home
- 93% English-only · Spanish 4% Russian/Polish/Slavic 1% Other Indo-European 1%
Political lean MEDSL · Ada
- 2024 margin
- R (+10.3) · D 43.4% · R 53.8% · Other 2.8%
- 2008→2024 swing
- -4.2pp toward R · 2008: -6.2pp · 2024: -10.3pp
- All cycles
- 2024: R+10.3 2020: R+3.9 2016: R+9.2 2012: R+11.3 2008: R+6.2
Not yet ingested
- Civics
- —
Market trends
- HPI YoY
- ▼ -178.45%
- Current HPI
- 321.2588
- Rent YoY
- ▲ 3.84%
- Metro
- Boise City, ID
- State GDP YoY
- ▲ 4.51%
- F500 in state
- 6
Industry mix (Fortune 500 HQ in ID)
| Industry | F500 HQs | Revenue |
|---|---|---|
| Retail | 1 | $79B |
|
||
| Technology | 1 | $25B |
|
||
| Food / Agriculture | 1 | $6B |
|
||
Price history
1 event — show timeline
- 2026-06-03 Listed $37,777 IMLS
Cash-flow waterfall
monthlySold comps — $/sqft
last 12 mo · ≤1 miLoading sold comps…