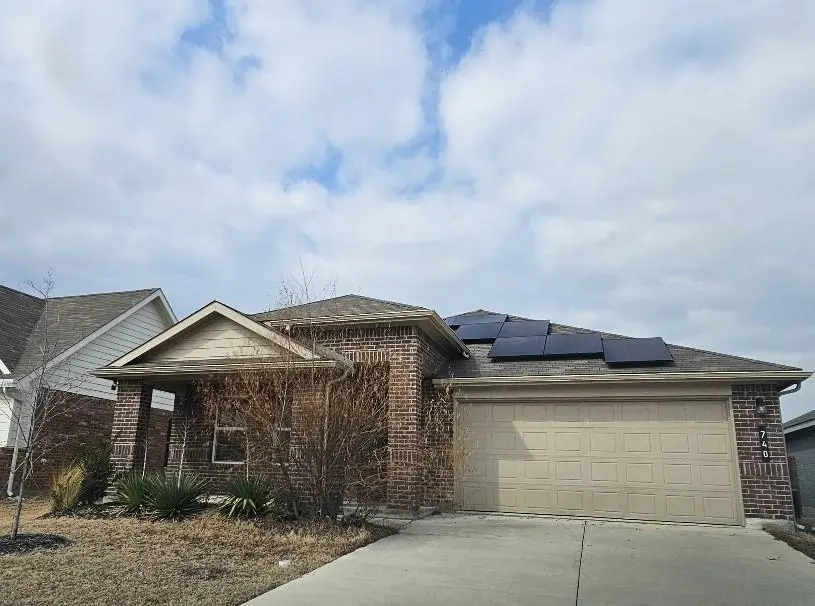
740 Breckenridge Park Dr · Alvarado, TX
Flood risk 1/10 · Minimal
- FEMA flood zone
- X (unshaded)
- Chance of flooding over 30 yrs
- 0.0%
- Est. flood insurance / yr
- $507 – $1,088
Fire risk 3/10 · Minor
- Est. fire insurance / yr
- $1,222 – $2,270
Heat risk 7/10 · Major
- Hot days now (above 110°F)
- 7 days/yr
- Hot days in 30 yrs
- 25 days/yr
Wind risk 6/10 · Moderate
- Chance of severe wind over 30 yrs
- 27.0%
Air-quality risk 2/10 · Minimal
- Unhealthy air days now
- 1 days/yr
- Unhealthy air days in 30 yrs
- 2 days/yr
Risk factors via First Street. Map © Google.
Why this score? — see what drove the D grade
The composite is a weighted blend of 9 inputs, each scored 0–100. Each bar is that input's sub-score; the figure is the points it added to the 100-point composite (weight × sub-score).
- ARV discount +15.0/15.0
- Cash flow +7.8/30.0
- 1% rule +4.5/10.0
- Condition / age +4.0/5.0
- Livability +3.7/5.0
- Schools +3.4/10.0
- Rent growth +2.5/5.0
- DSCR +1.9/10.0
- Appreciation +0.0/10.0
$249,500
🖨 Deal sheet (PDF) 📄 Offer letter ✓ Due diligence
Listing remarks MLS
Come and see this nice 4 bedroom, 2 bathroom, brick home!!!! Perfect opportunity to own your own home, featuring granite countertops, island sink, and an open concept perfect for entertaining family and friends. Large wooden, fenced back yard for your pets or kids to play, with covered patio to relax and enjoy the Texas breeze of Spring. This home is just waiting for you to call it home!!! All offers must be submitted by Buyer's Agent via RES.NET Agent Portal. If your offer is accepted, you agree to an offer submission tech fee of $300.00 which will be collected and disbursed by the settlement agent at closing and settlement of the transaction. To submit your buyer's offer go to RES.NET Agent portal to log in or create an account.
Key facts
- Fenced back yard
- Open concept
- Covered patio
Tags
Neighborhood map
What this means for you Summary
Snapshot
- This is a 4-bed/2.0-bath single-family listed at $250k. Condition is rated good.
Deal economics
- At list price, monthly cash flow is $-278 ($-3k/yr) — negative.
- To cash-flow at today's rent, offer at most $200k (19.7% below list).
- To meet the 1% rule (rent ≥ 1% of price), the offer needs to be $236k (5.3% below list).
- Recommended offer: $200k (19.7% below list) — sets the bar for cash-flow.
- Cap rate 5.0% vs local median 3.9% in Alvarado — meaningfully above typical; check what's discounted (condition, days-on-market, listing class) to confirm the premium yield is real.
Location & tenants
- Location reads 73/100 on livability (#228 in TX) — a middle-class / working-renter tenant base. Strengths: cost of living A+, housing A+, health & safety A+; Watch: amenities F, commute F.
- Alvarado ISD (rural): math 41% / reading 37% proficiency, ranked #416 of 826 in TX (top 50%) — families likely to look elsewhere, expect single-tenant / working-renter base with shorter leases.
- Zoned schools: Alvarado J H (math 35% / reading 33%, grade F, #892 of 1,662 statewide, top 55%, 845 students, 67% FRL).
- Market conditions: 361 active listings in the ZIP; 2 comparable units currently listed for rent nearby; solid renter incomes; 2,152 units permitted in Johnson County in 2024 (76 in 5+ unit buildings).
- This rent runs 36% of the median local income ($80k/yr) — at the standard rent-burdened threshold; future hikes will face affordability resistance.
Forward outlook
- Local home prices are declining (-3.0%/yr); year-one equity from $2k of loan paydown is wiped out by about $7k of value loss. Plan a longer hold.
- Johnson County population projected at +24% by 2050 — long-run rental-demand tailwind backs the buy-and-hold thesis.
Negotiation context
- It's been on market 104 days — a 9% lower offer ($227k) is reasonable based on typical stale-listing flexibility.
- 3 sale attempts; this cycle's ask has dropped $34k (12%) from the opening price — seller is motivated, your offer sets the floor, not the list.
Risks & watch-outs
- Watch-outs: property tax is 3.3% of price.
- Climate carrying-cost: major wind risk, 27% chance of damaging wind over 30y; extreme-heat days projected 7→25/yr by 2055 (HVAC capex compounding) — expect insurance premiums to compound above CPI over the hold.
Questions for the listing agent
- What do current leases actually rent for vs. the listed asking? Can we see a recent rent roll and the last 12 months of T-12 income?
- It's been on market 104 days. Have you received any prior offers? Is the seller open to a 20% concession, seller financing, or rate buy-down credit?
- Property tax is high relative to price — has the assessment been appealed recently, and will the sale trigger a re-assessment?
- What does the HOA fee cover, when was the last increase, and are there any pending special assessments or reserve-fund shortfalls?
- Why hasn't it sold? Are there any deal-killer items the seller is aware of (foundation, flood, title, zoning, code violations)?
- Is there a deadline driving the sale (1031 exchange, divorce, estate, relocation)? That informs how much negotiation room exists.
- Schools are D-rated, which usually means shorter tenancies and higher turnover. Who's the typical renter profile here, and what's been the actual vacancy rate?
- The area grade is low — what's the realistic commute time and amenity access for the typical tenant pool here? Any planned neighborhood developments (good or bad) we should know about?
- What's the average days-on-market for RENTAL listings here right now (not sales)? A rising rental-DOM trend means longer vacancies and softer asking-rent achievability than the comps imply.
- What's the recent tenant-quality profile in this submarket — average credit score on applications, eviction rate, late-payment / NSF rate, and stable-employment percentage? A property-management company in the area should have these aggregated.
- How much new for-sale + rental construction is in the pipeline within 1–3 miles? Heavy new supply typically softens prices + rents 12–24 months out; constrained supply supports both.
Investment metrics
- 1% rule
- 0.95% ✗
- Cap rate
- 4.95%
- Cash-on-cash
- -4.78%
- DSCR
- 0.79
- GRM
- 8.8
CMA / ARV
- ARV (median comp)
- $319,156
- List price
- $249,500
- Delta
- -21.83%
- Verdict
- UNDERPRICED
- Comps
- 20 within 1.0 mi
Show comp detail 12 sales within ~0.75 mi
| Address | Dist | Beds/Ba | Sqft | Sold | Price | $/sf | Match |
|---|---|---|---|---|---|---|---|
| 740 Breckenridge Park Dr | 0.00mi | 4/2.0 | 1,754 (0%) | 0mo | $249,500 | $142 | 100 |
| 721 Breckenridge Park Dr | 0.06mi | 4/2.0 | 1,667 (-5%) | 3mo | $283,000 | $170 | 86 |
| 1704 Battery Park Dr | 0.20mi | 4/2.0 | 1,791 (+2%) | 2mo | $295,000 | $165 | 86 |
| 1520 Hulen Park Trl | 0.19mi | 4/2.0 | 1,731 (-1%) | 6mo | $299,980 | $173 | 84 |
| 756 Breckenridge Park Dr | 0.03mi | 4/2.0 | 1,875 (+7%) | 8mo | $323,000 | $172 | 80 |
| 820 Lakeview Dr | 0.28mi | 5/2.0 (+1) | 1,702 (-3%) | 1mo | $243,000 | $143 | 76 |
| 304 Limestone Dr | 0.43mi | 4/2.0 | 1,750 (-0%) | 5mo | $285,000 | $163 | 76 |
| 1512 Battery Park Dr | 0.28mi | 4/2.0 | 1,875 (+7%) | 1mo | $330,000 | $176 | 75 |
| 728 Breckenridge Park Dr | 0.03mi | 3/2.0 (-1) | 1,576 (-10%) | 7mo | $295,000 | $187 | 71 |
| 706 Lakeview Dr | 0.42mi | 3/2.0 (-1) | 1,834 (+5%) | 4mo | $275,000 | $150 | 65 |
| 713 Trinity Park Trl | 0.08mi | 3/3.0 (-1) | 1,963 (+12%) | 5mo | $266,000 | $136 | 63 |
| 201 Seminole Trl | 0.74mi | 3/2.0 (-1) | 1,659 (-5%) | 6mo | $284,499 | $171 | 46 |
Match score weights: distance 35% · size 25% · config 20% · recency 20%. Top-matched comps best support the ARV.
Projected returns pro-forma
-3.0% appreciation · 3.0% rent growth · sell at horizon
- IRR
- -24.2%
- Equity multiple
- 0.17×
- Total profit
- $-57,854
- Equity at exit
- $37,201
- IRR
- -19.1%
- Equity multiple
- -0.03×
- Total profit
- $-72,000
- Equity at exit
- $21,572
Cash invested: $69,860 (down + closing). Projections, not guarantees.
Landlord ↔ Tenant lean methodology
- Overall (STATE)
- 87 Strongly Landlord-Friendly
- State Texas
- 87 Strongly Landlord-Friendly · R+5
- County
- — inherits STATE
- City
- — inherits STATE
ZIP-level market 76009
- Home prices YoY
- -25.7%
- Active inventory
- 361
- Price-to-rent
- 8.8×
Monthly cashflow live
- Estimated rent
- $2,362 medium interval (Pro) →
- Mortgage (P&I)
- −$1,308
- Tax from tax record
- −$694 /mo · $8,326/yr
- Insurance
- −$104
- HOA
- −$38
- Lot rent
- −$0
- Vacancy / Maint / Mgmt
- −$496
- Net cashflow
- $-278
Break-even live
Sensitivity live
| Price | -10% $-137 | -5% $-208 | +0% $-278 | +5% $-349 | +10% $-419 |
|---|---|---|---|---|---|
| Rent | -10% $-465 | -5% $-371 | +0% $-278 | +5% $-185 | +10% $-92 |
| Rate | -1.0pp $-153 | -0.5pp $-215 | base $-278 | +0.5pp $-343 | +1.0pp $-409 |
UW: 25.0% down · 7.5% · 30yr · 1.5% tax · 5.0% vac · 8.0% maint · 8.0% mgmt
Financing live
Cash to close
- Down payment
- $62,375
- Closing costs
- $7,485
- Reserves months
- —
- Total cash needed
- —
Loan-product check · same deal, 3 products live
Conventional
25% down · 7.5% · 30yr
- Down + closing
- —
- Monthly P&I
- —
- Monthly cashflow
- —
- DSCR
- —
- Eligible?
- —
Personal DTI + credit; lowest rate.
DSCR
20% down · 8.5% · 30yr
- Down + closing
- —
- Monthly P&I
- —
- Monthly cashflow
- —
- DSCR
- —
- Eligible?
- —
No personal income docs; deal must DSCR.
Hard money
10% down · 12.0% · 12mo
- Down + closing
- —
- Monthly P&I
- —
- Monthly cashflow
- —
- DSCR
- —
- Eligible?
- —
Short-term bridge; refi at stabilization.
Rent comps 2 comps
| Address | Beds | Baths | Sqft | Rent | $/sqft | DOM | Units | Dist |
|---|---|---|---|---|---|---|---|---|
| 629 Turtle Creek Park Trl Alvarado, TX | 4.0 | 2.0 | 1875 | $2,350 | $1.25 | 13d | 1 | 0.24mi |
| 220 Cheyenne Trl Alvarado, TX | 3.0 | 2.0 | 1653 | $2,500 | $1.51 | 24d | 1 | 0.95mi |
HOA detail
- Monthly dues
- $38 · $456/yr
Listing history 9 events
-
2026-05-12historical Active Option Contract 740-char remark
Show marketing remark (740 chars)
Come and see this nice 4 bedroom, 2 bathroom, brick home!!!! Perfect opportunity to own your own home, featuring granite countertops, island sink, and an open concept perfect for entertaining family and friends. Large wooden, fenced back yard for your pets or kids to play, with covered patio to relax and enjoy the Texas breeze of Spring. This home is just waiting for you to call it home!!! All offers must be submitted by Buyer's Agent via RES.NET Agent Portal. If your offer is accepted, you agree to an offer submission tech fee of $300.00 which will be collected and disbursed by the settlement agent at closing and settlement of the transaction. To submit your buyer's offer go to RES.NET Agent portal to log in or create an account.
-
2026-04-17price $249,500 740-char remark
Show marketing remark (740 chars)
Come and see this nice 4 bedroom, 2 bathroom, brick home!!!! Perfect opportunity to own your own home, featuring granite countertops, island sink, and an open concept perfect for entertaining family and friends. Large wooden, fenced back yard for your pets or kids to play, with covered patio to relax and enjoy the Texas breeze of Spring. This home is just waiting for you to call it home!!! All offers must be submitted by Buyer's Agent via RES.NET Agent Portal. If your offer is accepted, you agree to an offer submission tech fee of $300.00 which will be collected and disbursed by the settlement agent at closing and settlement of the transaction. To submit your buyer's offer go to RES.NET Agent portal to log in or create an account.
-
2026-03-16price $269,900 740-char remark
Show marketing remark (740 chars)
Come and see this nice 4 bedroom, 2 bathroom, brick home!!!! Perfect opportunity to own your own home, featuring granite countertops, island sink, and an open concept perfect for entertaining family and friends. Large wooden, fenced back yard for your pets or kids to play, with covered patio to relax and enjoy the Texas breeze of Spring. This home is just waiting for you to call it home!!! All offers must be submitted by Buyer's Agent via RES.NET Agent Portal. If your offer is accepted, you agree to an offer submission tech fee of $300.00 which will be collected and disbursed by the settlement agent at closing and settlement of the transaction. To submit your buyer's offer go to RES.NET Agent portal to log in or create an account.
-
2026-02-12$284,000 Active 740-char remark
Show marketing remark (740 chars)
Come and see this nice 4 bedroom, 2 bathroom, brick home!!!! Perfect opportunity to own your own home, featuring granite countertops, island sink, and an open concept perfect for entertaining family and friends. Large wooden, fenced back yard for your pets or kids to play, with covered patio to relax and enjoy the Texas breeze of Spring. This home is just waiting for you to call it home!!! All offers must be submitted by Buyer's Agent via RES.NET Agent Portal. If your offer is accepted, you agree to an offer submission tech fee of $300.00 which will be collected and disbursed by the settlement agent at closing and settlement of the transaction. To submit your buyer's offer go to RES.NET Agent portal to log in or create an account.
-
2025-07-28price $279,900
-
2025-06-12$299,900 Active
-
2025-05-10historical
-
2025-04-10soldstatus
-
2025-03-07$150,000 Active
ⓘ Source: listings_history table (triggers on properties + properties_extension) + one-shot
backfill from property_details.listing_events for pre-trigger history.
Tax reassessment forecast TX · Resets to sale price
- Current annual tax
- $8,326 · $694/mo
- Projected year-2 tax
- $8,326 · $694/mo
- Expected delta
- $0/yr ($0/mo · 0.0%)
ⓘ Screening estimate from a state-policy table — verify with the county assessor before closing.
Climate risk First Street
- Flood 1/10 Low FEMA zone X (unshaded) · 0% chance over 30 yrs
- Wildfire 3/10 Moderate
- Heat 7/10 Severe 7 d/yr ≥110°F today · 25 d/yr by 30 yrs out
- Wind 6/10 Major 27% chance of damaging wind over 30 yrs
- Air quality 2/10 Low 1 unhealthy d/yr today · 2 by 30 yrs out
Nearby sold comps map
Loading sold comps map…
Walkable amenities ~0.75 mi
Loading nearby amenities…
Taxation est. · year 1
- Rental income
- $28,344
- − Mortgage interest
- −$13,976
- − Property taxes
- −$8,326
- − Insurance
- −$1,248
- − Repairs & maintenance
- −$2,268
- − Management
- −$2,268
- − HOA
- −$456
- − Depreciation
- −$7,258
- Taxable loss
- −$7,454
- Est. tax savings @ 24.0%
- +$1,789
- After-tax cash flow
- $-1,549/yr
For passive investors: Depreciation is non-cash, so a rental often shows a tax loss while cash-flowing — sheltering income. Rental losses are passive: they offset passive income freely, and up to $25,000/yr can offset ordinary (W-2) income if you actively participate and your MAGI is under $100k (phasing out to $0 by $150k); unused losses carry forward. On sale, claimed depreciation is recaptured at up to 25%, and gains may owe capital-gains tax (a 1031 exchange can defer both). Figures are a year-1 estimate at your 24.0% rate — not tax advice; consult a CPA.
Condition & rehab AI · 12 photos
This well-maintained single-family home features a good condition with recent updates, making it a great opportunity for a buyer looking to move in and enjoy a comfortable living space.
Value-add opportunities
- Both Paint exterior and interior walls — Fresh paint enhances curb appeal and interior aesthetics
- Resale Replace countertops with quartz or granite — Quartz or granite countertops are more durable and aesthetically pleasing
- Both Install smart home devices — Smart home devices improve convenience and energy efficiency
- Both Add landscaping around the house — Landscaping enhances curb appeal and adds value
- Both Upgrade HVAC system — A new HVAC system improves comfort and energy efficiency
Renovation cost estimate screening
Value-add ROI direction
- Both Paint exterior and interior walls — Fresh paint enhances curb appeal and interior aesthetics ↑
- Resale Replace countertops with quartz or granite — Quartz or granite countertops are more durable and aesthetically pleasing ↑
- Both Install smart home devices — Smart home devices improve convenience and energy efficiency ↑
- Both Add landscaping around the house — Landscaping enhances curb appeal and adds value ↑
- Both Upgrade HVAC system — A new HVAC system improves comfort and energy efficiency ↑
ⓘ Cost ranges are severity-bucket heuristics (US national rule-of-thumb). Get contractor quotes + a written scope before underwriting a rehab budget.
Schools (NCES district)
- District
- Alvarado ISD
- NCES district ID
- 4800011
- Math proficiency
- 41% ▲ 4.00%
- Reading proficiency
- 37% ▼ -2.00%
- Median HH income
- $53,485
- Composite
- 34.02/100
- National rank
- #5312
- State rank
- #416 of 826 in TX
Livability — Alvarado
- Score
- 73/100
- State rank
- #228
- US rank
- #5544
Category grades
Schools grade is shown separately in the Schools card above.
Census & demographics
- Census place
- Alvarado, TX
- County
- Johnson County · 147,987 people
- City population
- 22,803
- Metro
- Dallas-Fort Worth-Arlington, TX
- Population (ZIP)
- 22,803
- Household income
- $79,755
- Rent vs Own
- Severe rent burden
- 298.0
Population outlook (Johnson County) Hauer SSP2
- Today (2025)
- 179,678 people
- By 2030
- 189,208 · +5.3%
- By 2040
- 207,261 · +15.4%
- By 2050
- 223,064 · +24.1%
- By 2075
- 259,979 · +44.7%
- By 2100
- 275,395 · +53.3%
Race, ethnicity, and origin ACS 2023
- Neighborhood character
- Majority White (56%)
- Race & ethnicity
- White 56% Hispanic / Latino 39% Two or more races 17% Black 3%
- Hispanic origin (detail)
- Mexican 37%
- Common ancestry
- Serbian 1% Romanian 1% Italian 1%
- Foreign-born
- 10% · Canada
- Languages at home
- 73% English-only · Spanish 27%
Political lean MEDSL · Johnson
- 2024 margin
- Solid R (+51.4) · D 23.9% · R 75.3%
- 2008→2024 swing
- -3.9pp toward R · 2008: -47.5pp · 2024: -51.4pp
- All cycles
- 2024: R+51.4 2020: R+53.0 2016: R+58.3 2012: R+55.6 2008: R+47.5
Not yet ingested
- Civics
- —
Market trends
- HPI YoY
- ▼ -86.74%
- Current HPI
- 251.2624
- Rent YoY
- —
- Metro
- Dallas-Fort Worth-Arlington, TX
- State GDP YoY
- ▲ 3.95%
- F500 in state
- 110
Industry mix (Fortune 500 HQ in TX)
| Industry | F500 HQs | Revenue |
|---|---|---|
| Energy | 16 | $1,198B |
|
||
| Technology | 5 | $198B |
|
||
| Engineering / Construction | 4 | $72B |
|
||
| Energy Services | 3 | $60B |
|
||
| Utilities | 3 | $41B |
|
||
| Healthcare | 2 | $330B |
|
||
Price history
+66.3% since first listed9 events — show timeline
- 2026-05-12 Contingent — NTREIS
- 2026-04-17 Price Changed $249,500 NTREIS
- 2026-03-16 Price Changed $269,900 NTREIS
- 2026-02-12 Listed $284,000 NTREIS
- 2025-07-28 Price Changed $279,900 NTREIS
- 2025-06-12 Listed $299,900 NTREIS
- 2025-05-10 Listing Removed — NTREIS
- 2025-04-10 Sold (Public Records) — Public Records
- 2025-03-07 Listed $150,000 NTREIS
Property tax history
+75.3%/yrLatest (2025): $8,326 · -0.3% YoY. Source: county tax records.
Cash-flow waterfall
monthlySold comps — $/sqft
last 12 mo · ≤1 miLoading sold comps…