 Duplex
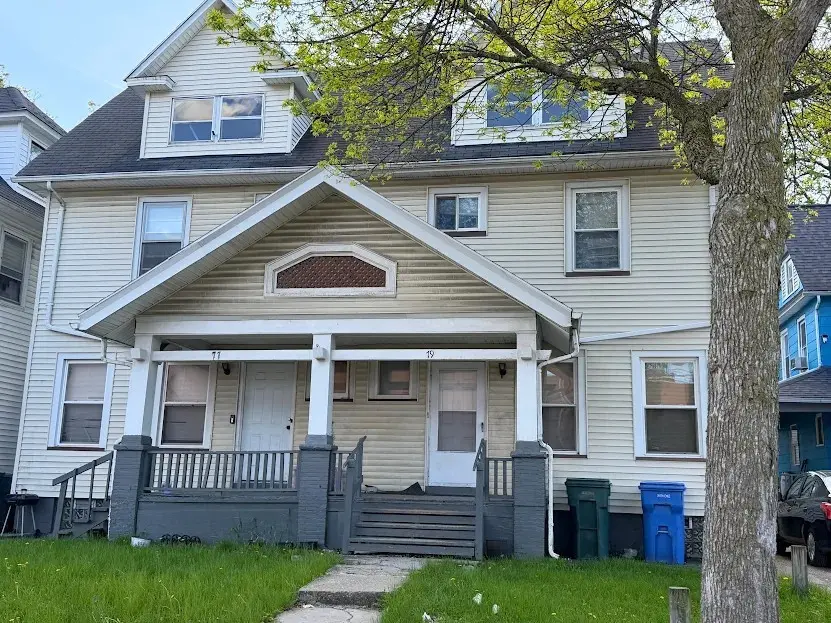
77 Pullman Ave · Rochester, NY
Flood risk 4/10 · Minor
- FEMA flood zone
- X (unshaded)
- Chance of flooding over 30 yrs
- 0.22%
- Est. flood insurance / yr
- $473 – $860
Fire risk 4/10 · Minor
- Est. fire insurance / yr
- $691 – $1,283
Heat risk 2/10 · Minimal
- Hot days now (above 96°F)
- 7 days/yr
- Hot days in 30 yrs
- 15 days/yr
Wind risk 1/10 · Minimal
- Chance of severe wind over 30 yrs
- —
Air-quality risk 2/10 · Minimal
- Unhealthy air days now
- 1 days/yr
- Unhealthy air days in 30 yrs
- 2 days/yr
Risk factors via First Street. Map © Google.
Why this score? — see what drove the C+ grade
The composite is a weighted blend of 9 inputs, each scored 0–100. Each bar is that input's sub-score; the figure is the points it added to the 100-point composite (weight × sub-score).
- Cash flow +30.0/30.0
- 1% rule +10.0/10.0
- DSCR +10.0/10.0
- Livability +3.8/5.0
- ARV discount +2.9/15.0
- Condition / age +2.8/5.0
- Rent growth +2.5/5.0
- Schools +1.9/10.0
- Appreciation +0.0/10.0
$184,900
🖨 Deal sheet 📄 Offer letter ✓ Due diligence
Multi-family units
County records classify this as Multi-Family (2-4 Unit). Listing-text estimate: 2 units. confirmed
Listing remarks
Welcome to 77-79 Pullman Ave, an income-producing duplex opportunity in Rochester. This multi-family property features one spacious 3-bedroom, 1-bath unit and one 2-bedroom, 1-bath unit, each with separate entrances, basements, and attic spaces. Both units are currently tenant-occupied, providing immediate rental income and flexibility for investors or future owner-occupants. Recent improvements include an updated kitchen, new vinyl flooring, a brand-new water heater, and updated electrical breakers in one unit. Both units feature enclosed rear porches and separate access to basement and attic storage areas. Conveniently located near shopping, public transportation, schools, and major expre
Key facts
- Updated kitchen
- Separate entrances
- New vinyl flooring
Tags
Property features AI
Finance
- Financial info: Owner pays grounds care; Gardener included in rent; Operating expenses include insurance, licenses, maintenance, and professional management; Two rental units with current rents: one at $1,200 and one at $1,350
Exterior
- Parking: On-street parking
- Utilities: Public water connected; Sewer connected; Electric with circuit breakers
- Home design: Two-story multi-unit residence; Resale property; City street frontage; Rectangular residential lot near public transit
- Construction: Vinyl siding; Asphalt roof; Built (existing structure)
- Exterior features: Open porch; Porch
Interior
- Kitchen: Oven/Range; Refrigerator; Eat-in kitchen or dining area (unit-dependent); Formal dining room in one unit
- Bedrooms: Two 2-bedroom units (one unit has 2 bedrooms); One 3-bedroom unit (one unit has 3 bedrooms)
- Flooring: Vinyl; Varies by area/unit
- Bathrooms: Two full bathrooms total (each unit has 1 full bath)
- Heating & cooling: Gas forced-air heating
- Interior features: Full basement; Varied and vinyl flooring
- Laundry & utility: Washer hookup; Gas water heater
Neighborhood map
What this means for you Summary
Snapshot
- This is a 2 × 3-bed/1.0-bath units multifamily listed at $185k. Condition is rated average.
Deal economics
- At list price, monthly cash flow is $1k ($14k/yr) — positive. Per door: $599/mo.
- The deal already cash-flows at list — no discount required.
- Meets the 1% rule at list price ($3k rent vs $185k).
- Recommended offer: $179k (3.0% below list) — sets the bar for market timing.
- Cap rate 14.1% vs local median 9.3% in Rochester — top-decile yield for the area; either an underpriced asset or a hidden risk that comps aren't pricing in. Stress-test before assuming the spread holds.
Location & tenants
- Location reads 76/100 on livability (#222 in NY, #3,482 nationally) — a middle-class / working-renter tenant base. Strengths: commute A+, cost of living A+, housing A+; Watch: schools D+, crime F, employment F.
- Rochester City School District (urban): math 21% / reading 26% proficiency, ranked #589 of 590 in NY (top 100%) — low school quality limits family demand, transient renter base, plan for 1-2y turnover; 82% free/reduced lunch — lower-income household profile, screen leases tightly.
- Market conditions: 74 active listings in the ZIP; 5 comparable units currently listed for rent nearby; rentals at typical pace (median 24d on market — plan ~3-4 weeks tenant-placement turnaround); 40% of comp listings sitting > 30 days — soft ceiling on asking rent; 1,169 units permitted in Monroe County in 2024 (591 in 5+ unit buildings).
- At $3,135/mo this rent would consume 73% of the median local household income ($51k/yr) (locally 1245% of renters already pay >50% of income on rent) — very limited rent-growth headroom before tenants either downsize or default.
Forward outlook
- Local home prices are declining (-3.0%/yr); year-one equity from $1k of loan paydown is wiped out by about $6k of value loss. Plan a longer hold.
- Monroe County population projected to shrink 6% by 2050 — rents likely to lag national; underwrite the cash flow, not the appreciation.
- At projected returns (-3.0% appreciation + 3.0% rent growth), your $52k cash investment doubles in ~5 years — after that, you're playing with house money.
Negotiation context
- It's been on market 31 days — a 3% lower offer ($179k) is reasonable based on typical stale-listing flexibility.
Risks & watch-outs
- Watch-outs: built in 1911 — expect roof / HVAC / electrical / plumbing capex.
Questions for the listing agent
- It's been on market 31 days. Have you received any prior offers? Is the seller open to a 3% concession, seller financing, or rate buy-down credit?
- Can we see the unit-by-unit rent roll, current vacancy, and any below-market leases? What's the average tenancy length?
- What capital expenditures (roof, boiler, parking lot, exteriors) have been made in the last 5 years, and what's planned in the next 2?
- Built in 1911 — when were the roof, HVAC, electrical panel, plumbing, and water heater last replaced?
- Is there a deadline driving the sale (1031 exchange, divorce, estate, relocation)? That informs how much negotiation room exists.
- Schools are D-rated, which usually means shorter tenancies and higher turnover. Who's the typical renter profile here, and what's been the actual vacancy rate?
- Crime grade is F in this area — have there been break-ins, vandalism, or insurance claims at this property in the last 3 years? What carrier currently insures it and at what premium?
- What's the average days-on-market for RENTAL listings here right now (not sales)? A rising rental-DOM trend means longer vacancies and softer asking-rent achievability than the comps imply.
- What's the recent tenant-quality profile in this submarket — average credit score on applications, eviction rate, late-payment / NSF rate, and stable-employment percentage? A property-management company in the area should have these aggregated.
- How much new apartment / multifamily construction is in the pipeline within 1–3 miles? Heavy new supply (>2% of stock underway) typically softens rents 12–24 months out; light construction supports rent growth.
Investment metrics
- 1% rule
- 1.70% ✓
- Cap rate
- 14.07%
- Cash-on-cash
- 27.79%
- DSCR
- 2.24
- GRM
- 4.9
CMA / ARV
- ARV (on-the-fly)
- $167,660
- Comps found
- 11
Show comp detail 11 sales within ~0.75 mi
| Address | Dist | Beds/Ba | Sqft | Sold | Price | $/sf | Match |
|---|---|---|---|---|---|---|---|
| 165 Avis St | 0.32mi | 4/2.0 | 2,032 (+1%) | 13mo | $170,000 | $84 | 73 |
| 89 Clay Ave | 0.26mi | 4/2.0 | 1,846 (-9%) | 2mo | $183,000 | $99 | 71 |
| 173 Knickerbocker Ave | 0.52mi | 4/2.0 | 2,040 (+1%) | 8mo | $187,500 | $92 | 67 |
| 140-142 Avis St | 0.29mi | 4/2.0 | 1,872 (-7%) | 16mo | $155,000 | $83 | 61 |
| 333 Raines Park | 0.41mi | 3/2.0 (-1) | 1,800 (-11%) | 3mo | $195,000 | $108 | 55 |
| 189 Augustine St | 0.67mi | 4/2.0 | 2,134 (+6%) | 5mo | $135,900 | $64 | 55 |
| 473 Ridgeway Ave | 0.55mi | 3/2.0 (-1) | 1,880 (-7%) | 9mo | $150,000 | $80 | 50 |
| 107 Electric Ave #2 | 0.41mi | 3/2.0 (-1) | 2,159 (+7%) | 18mo | $116,000 | $54 | 49 |
| 392 Magee Ave | 0.58mi | 5/2.0 (+1) | 2,107 (+4%) | 18mo | $91,000 | $43 | 45 |
| 1361 Dewey Ave | 0.46mi | 4/2.0 | 1,768 (-12%) | 20mo | $84,000 | $48 | 41 |
| 191-193 Winchester St | 0.74mi | 4/2.0 | 2,268 (+12%) | 17mo | $205,000 | $90 | 31 |
Match score weights: distance 35% · size 25% · config 20% · recency 20%. Top-matched comps best support the ARV.
Projected returns pro-forma
-3.0% appreciation · 3.0% rent growth · sell at horizon
- IRR
- 21.9%
- Equity multiple
- 1.90×
- Total profit
- $46,441
- Equity at exit
- $27,569
- IRR
- 30.0%
- Equity multiple
- 3.68×
- Total profit
- $138,952
- Equity at exit
- $15,987
Cash invested: $51,772 (down + closing). Projections, not guarantees.
Landlord ↔ Tenant lean methodology
- Overall (STATE)
- 15 Strongly Tenant-Friendly
- State New York
- 15 Strongly Tenant-Friendly · D+10
- County
- — inherits STATE
- City
- — inherits STATE
ZIP-level market 14615
- Home prices YoY
- -11.7%
- Active inventory
- 74
- Price-to-rent
- 9.8×
Monthly cashflow live
- Estimated rent
- $3,135 high interval (Pro) →
- Mortgage (P&I)
- −$970
- Tax est. 1.5%
- −$231 /mo · $2,774/yr
- Insurance
- −$77
- HOA
- −$0
- Vacancy / Maint / Mgmt
- −$658
- Net cashflow
- $1,199
Break-even live
2-unit breakdown (identical units grouped — click to expand)
| Units | Beds | Baths | Est. rent |
|---|---|---|---|
| 2× units | 3 | 1 | $3,136 |
| #1 | 3 | 1 | $1,568 |
| #2 | 3 | 1 | $1,568 |
| Total (2 units) | $3,135 | ||
UW: 25.0% down · 7.5% · 30yr · 1.5% tax · 5.0% vac · 8.0% maint · 8.0% mgmt
Financing live
Cash to close
- Down payment
- $46,225
- Closing costs
- $5,547
- Reserves months
- —
- Total cash needed
- —
Loan-product check · same deal, 3 products live
Conventional
25% down · 7.5% · 30yr
- Down + closing
- —
- Monthly P&I
- —
- Monthly cashflow
- —
- DSCR
- —
- Eligible?
- —
Personal DTI + credit; lowest rate.
DSCR
20% down · 8.5% · 30yr
- Down + closing
- —
- Monthly P&I
- —
- Monthly cashflow
- —
- DSCR
- —
- Eligible?
- —
No personal income docs; deal must DSCR.
Hard money
10% down · 12.0% · 12mo
- Down + closing
- —
- Monthly P&I
- —
- Monthly cashflow
- —
- DSCR
- —
- Eligible?
- —
Short-term bridge; refi at stabilization.
Rent comps 5 comps
| Address | Beds | Baths | Sqft | Rent | $/sqft | DOM | Units | Dist |
|---|---|---|---|---|---|---|---|---|
| 235 Flower City Park Rochester, NY | 3.0 | 1.0 | 2000 | $1,360 | $0.68 | 43d | 1 | 0.18mi |
| 768 Flower City Park Rochester, NY | 3.0 | 1.0 | 1995 | $1,995 | $1.00 | 10d | 1 | 0.73mi |
| 98 Pierpont St Rochester, NY | 3.0 | 1.0 | 1973 | $1,295 | $0.66 | 43d | 1 | 0.97mi |
| 28-30 Carthage Dr Unit 28 Rochester, NY | 3.0 | 1.0 | 1415 | $1,600 | $1.13 | 23d | 1 | 1.14mi |
| 327 Glenwood Ave Rochester, NY | 3.0 | 1.0 | 2012 | $1,690 | $0.84 | 2d | 1 | 1.33mi |
Listing history 16 events
-
2026-06-18days on market $184,900 Active 31 DOM
-
2026-06-17days on market $184,900 Active 30 DOM
-
2026-06-16days on market $184,900 Active 29 DOM
-
2026-06-15days on market $184,900 Active 28 DOM
-
2026-06-13days on market $184,900 Active 26 DOM
-
2026-06-13days on market $184,900 Active 25 DOM
-
2026-06-10days on market $184,900 Active 23 DOM
-
2026-06-09days on market $184,900 Active 22 DOM
-
2026-06-09days on market $184,900 Active 21 DOM
-
2026-06-07days on market $184,900 Active 20 DOM
-
2026-06-05days on market $184,900 Active 17 DOM
-
2026-06-03days on market $184,900 Active 16 DOM
-
2026-06-03days on market $184,900 Active 15 DOM
-
2026-06-01days on market $184,900 Active 14 DOM
-
2026-05-31days on market $184,900 Active 13 DOM
-
2026-05-18$184,900 Active
ⓘ Source: listings_history table (triggers on properties + properties_extension) + one-shot
backfill from property_details.listing_events for pre-trigger history.
Climate risk First Street
- Flood 4/10 Moderate FEMA zone X (unshaded) · 22% chance over 30 yrs
- Wildfire 4/10 Moderate
- Heat 2/10 Low 7 d/yr ≥96°F today · 15 d/yr by 30 yrs out
- Wind 1/10 Low
- Air quality 2/10 Low 1 unhealthy d/yr today · 2 by 30 yrs out
Nearby sold comps map
Loading sold comps map…
Walkable amenities ~0.75 mi
Loading nearby amenities…
Taxation est. · year 1
- Rental income
- $37,620
- − Mortgage interest
- −$10,357
- − Property taxes
- −$2,774
- − Insurance
- −$924
- − Repairs & maintenance
- −$3,010
- − Management
- −$3,010
- − Depreciation
- −$5,379
- Taxable income
- $12,167
- Est. tax owed @ 24.0%
- −$2,920
- After-tax cash flow
- $11,466/yr
For passive investors: Depreciation is non-cash, so a rental often shows a tax loss while cash-flowing — sheltering income. Rental losses are passive: they offset passive income freely, and up to $25,000/yr can offset ordinary (W-2) income if you actively participate and your MAGI is under $100k (phasing out to $0 by $150k); unused losses carry forward. On sale, claimed depreciation is recaptured at up to 25%, and gains may owe capital-gains tax (a 1031 exchange can defer both). Figures are a year-1 estimate at your 24.0% rate — not tax advice; consult a CPA.
Condition & rehab AI · 3 photos
This multi-family property requires moderate renovations, focusing on exterior repairs and landscaping to improve its curb appeal and overall value.
Repairs flagged
- Minor Exterior siding — Siding appears slightly worn
- Minor Landscaping — Overgrown grass and debris
Value-add opportunities
- Both Paint exterior walls — Fresh paint can improve curb appeal and home value
- Both Landscaping — A well-maintained yard can increase both resale and rental value
Renovation cost estimate screening
| Repair item | Severity | Est. cost |
|---|---|---|
| Exterior siding · Siding appears slightly worn | Minor | $500–3,000 |
| Landscaping · Overgrown grass and debris | Minor | $500–3,000 |
| Total estimated repair cost · 2 items | $1,000–6,000 |
Value-add ROI direction
- Both Paint exterior walls — Fresh paint can improve curb appeal and home value ↑
- Both Landscaping — A well-maintained yard can increase both resale and rental value ↑
ⓘ Cost ranges are severity-bucket heuristics (US national rule-of-thumb). Get contractor quotes + a written scope before underwriting a rehab budget.
Schools (NCES district)
- District
- Rochester City School District
- NCES district ID
- 3624750
- Math proficiency
- 21% ▬ 0.00%
- Reading proficiency
- 26% ▲ 4.00%
- Median HH income
- $30,923
- Composite
- 18.98/100
- National rank
- #8850
- State rank
- #589 of 590 in NY
Livability — Rochester
- Score
- 76/100
- State rank
- #222
- US rank
- #3482
Category grades
Schools grade is shown separately in the Schools card above.
Census & demographics
- Census place
- Rochester, NY
- County
- Monroe County · 674,131 people
- City population
- 432,803
- Metro
- Rochester, NY
- Population (ZIP)
- 17,884
- Household income
- $51,262
- Rent vs Own
- Severe rent burden
- 1245.0
Population outlook (Monroe County) Hauer SSP2
- Today (2025)
- 759,460 people
- By 2030
- 757,154 · -0.3%
- By 2040
- 740,644 · -2.5%
- By 2050
- 714,443 · -5.9%
- By 2075
- 645,883 · -15.0%
- By 2100
- 547,084 · -28.0%
Race, ethnicity, and origin ACS 2023
- Neighborhood character
- Diverse neighborhood (Simpson 0.68)
- Race & ethnicity
- White 45% Black 27% Hispanic / Latino 20% Two or more races 9% Asian 3%
- Hispanic origin (detail)
- Puerto Rican 16% Cuban 2%
- Common ancestry
- Arab 3% Romanian 2% Subsaharan African 2%
- Foreign-born
- 10% · Canada, India, Vietnam
- Languages at home
- 81% English-only · Spanish 11% Arabic 2% Other Indo-European 2%
Political lean MEDSL · Monroe
- 2024 margin
- D (+19.1) · D 59.5% · R 40.5%
- 2008→2024 swing
- +1.4pp toward D · 2008: 17.7pp · 2024: 19.1pp
- All cycles
- 2024: D+19.1 2020: D+21.0 2016: D+14.1 2012: D+17.4 2008: D+17.7
Not yet ingested
- Civics
- —
Market trends
- HPI YoY
- ▼ -31.81%
- Current HPI
- 240.6896
- Rent YoY
- —
- Metro
- Rochester, NY
- State GDP YoY
- ▲ 2.60%
- F500 in state
- 92
Industry mix (Fortune 500 HQ in NY)
| Industry | F500 HQs | Revenue |
|---|---|---|
| Financial Services | 10 | $950B |
|
||
| Consumer Goods | 9 | $162B |
|
||
| Insurance | 4 | $225B |
|
||
| Telecommunications | 2 | $144B |
|
||
| Pharmaceuticals | 2 | $112B |
|
||
| Media / Entertainment | 2 | $69B |
|
||
Price history
1 event — show timeline
- 2026-05-18 Listed $184,900 UNYREIS
Cash-flow waterfall
monthlySold comps — $/sqft
last 12 mo · ≤1 miLoading sold comps…