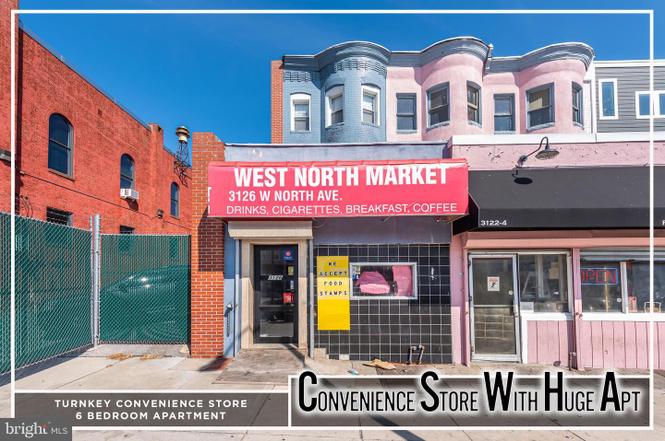
3126 W North Ave · Baltimore, MD
Flood risk No data
- FEMA flood zone
- —
- Chance of flooding over 30 yrs
- —
- Est. flood insurance / yr
- —
Fire risk No data
- Est. fire insurance / yr
- —
Heat risk No data
- Hot days now (above threshold)
- —
- Hot days in 30 yrs
- —
Wind risk No data
- Chance of severe wind over 30 yrs
- —
Air-quality risk No data
- Unhealthy air days now
- —
- Unhealthy air days in 30 yrs
- —
Risk factors via First Street. Map © Google.
Why this score? — see what drove the B+ grade
The composite is a weighted blend of 9 inputs, each scored 0–100. Each bar is that input's sub-score; the figure is the points it added to the 100-point composite (weight × sub-score).
- Cash flow +30.0/30.0
- ARV discount +15.0/15.0
- 1% rule +10.0/10.0
- DSCR +10.0/10.0
- Rent growth +4.0/5.0
- Livability +3.8/5.0
- Condition / age +2.5/5.0
- Schools +1.0/10.0
- Appreciation +0.0/10.0
$179,900
🖨 Deal sheet (PDF) 📄 Offer letter ✓ Due diligence
Listing remarks
INCREDIBLE INVESTMENT OPPORTUNITY! LARGE MIXED USE PROPERTY WITH TONS OF POSSIBLITIES! Property is currently set up as a street level convenience store and upstairs residential unit. The street level commercial space features a secure check out area, a larger rear retail food area with ample shelving and refrigerated units, a storage space, and a half bath. The upper level residential space has a kitchen and 1/2 bath located on one level and a total of 6 bedrooms and 2 full baths on the upper 2 levels along with a rear deck. This set up would be ideal for a rooming house. Located on highly traveled North Ave. and close to Coppin State, Gwynn Falls Park, & Hilton Parkway
Key facts
- Mixed use property
- Refrigerated units
- Ample shelving
Tags
Property features AI
Exterior
- Parking: On-street parking
- Utilities: Public water; Public sewer; Natural gas hot water; Natural gas heating
- Home design: End-of-row townhouse; Ownership: Fee simple; Year built: estimated
- Construction: Combination construction materials; Other foundation; Other above-grade structures
- Exterior features: Deck(s); No tidal water
Interior
- Bedrooms: Four bedrooms on the second (upper) level; Two bedrooms on the third (upper) level
- Flooring: Hardwood
- Bathrooms: Two full bathrooms; Two half bathrooms (one on main level, one on first upper level)
- Heating & cooling: Forced air heating; Cooling: other (unspecified)
- Interior features: Hardwood flooring; Finished living area (estimated); Basement (other)
Neighborhood map
What this means for you Summary
Snapshot
- This is a 6-bed/3.0-bath townhouse listed at $180k.
Deal economics
- At list price, monthly cash flow is $1k ($13k/yr) — positive.
- The deal already cash-flows at list — no discount required.
- Meets the 1% rule at list price ($3k rent vs $180k).
- Recommended offer: $169k (6.0% below list) — sets the bar for market timing.
- Cap rate 13.5% vs local median 6.0% in Baltimore — top-decile yield for the area; either an underpriced asset or a hidden risk that comps aren't pricing in. Stress-test before assuming the spread holds.
Location & tenants
- Location reads 76/100 on livability (#90 in MD, #3,396 nationally) — a middle-class / working-renter tenant base. Strengths: amenities A+, commute A+, housing A+; Watch: crime F.
- Baltimore City Public Schools (urban): math 7% / reading 16% proficiency, ranked #24 of 24 in MD (top 100%) — low school quality limits family demand, transient renter base, plan for 1-2y turnover; 79% free/reduced lunch — lower-income household profile, screen leases tightly.
- Zoned schools: Elmer A. Henderson: A Johns Hopkins Partnership (math 2% / reading 16%, grade F, #650 of 860 statewide, top 77%, 642 students, 80% FRL); Vanguard Collegiate Middle (math 3% / reading 15%, grade F, #212 of 225 statewide, top 95%, 343 students, 84% FRL); Baltimore Polytechnic Institute (math 71% / reading 84%, grade A-, #22 of 222 statewide, top 10%, 1,555 students, 43% FRL).
- Zoned-school proficiency averages 32% at this address vs 12% district-wide (+20 pts) — the actual schools serving this property are materially stronger than the Baltimore City Public Schools average implies; a family-tenant draw the district grade alone would hide.
- Market conditions: Rents rising fast (+6.1%/yr); 252 active listings in the ZIP; 3 comparable units currently listed for rent nearby; rentals lingering (median 46d on market — plan ~5-8 weeks vacancy on turnover, expect pricing pressure); 67% of comp listings sitting > 30 days — soft ceiling on asking rent; lower-income renter base — watch delinquency; 1,273 units permitted in Baltimore city in 2024 (1,104 in 5+ unit buildings).
- At $2,945/mo this rent would consume 84% of the median local household income ($42k/yr) (locally 2264% of renters already pay >50% of income on rent) — very limited rent-growth headroom before tenants either downsize or default.
Forward outlook
- Local home prices are declining (-3.0%/yr); year-one equity from $1k of loan paydown is wiped out by about $5k of value loss. Plan a longer hold.
- Baltimore County population projected to shrink 4% by 2050 — rents likely to lag national; underwrite the cash flow, not the appreciation.
- At projected returns (-3.0% appreciation + 6.1% rent growth), your $50k cash investment doubles in ~5 years — after that, you're playing with house money.
Negotiation context
- It's been on market 77 days — a 6% lower offer ($169k) is reasonable based on typical stale-listing flexibility.
- 7 sale attempts since 6y ago; this cycle's ask has dropped $45k (20%) from the opening price — seller is motivated, your offer sets the floor, not the list.
Risks & watch-outs
- Watch-outs: built in 1920 — expect roof / HVAC / electrical / plumbing capex.
Questions for the listing agent
- It's been on market 77 days. Have you received any prior offers? Is the seller open to a 6% concession, seller financing, or rate buy-down credit?
- Built in 1920 — when were the roof, HVAC, electrical panel, plumbing, and water heater last replaced?
- Why hasn't it sold? Are there any deal-killer items the seller is aware of (foundation, flood, title, zoning, code violations)?
- Is there a deadline driving the sale (1031 exchange, divorce, estate, relocation)? That informs how much negotiation room exists.
- Schools are D-rated, which usually means shorter tenancies and higher turnover. Who's the typical renter profile here, and what's been the actual vacancy rate?
- Crime grade is F in this area — have there been break-ins, vandalism, or insurance claims at this property in the last 3 years? What carrier currently insures it and at what premium?
- What's the average days-on-market for RENTAL listings here right now (not sales)? A rising rental-DOM trend means longer vacancies and softer asking-rent achievability than the comps imply.
- What's the recent tenant-quality profile in this submarket — average credit score on applications, eviction rate, late-payment / NSF rate, and stable-employment percentage? A property-management company in the area should have these aggregated.
- How much new for-sale + rental construction is in the pipeline within 1–3 miles? Heavy new supply typically softens prices + rents 12–24 months out; constrained supply supports both.
Investment metrics
- 1% rule
- 1.64% ✓
- Cap rate
- 13.52%
- Cash-on-cash
- 25.81%
- DSCR
- 2.15
- GRM
- 5.1
CMA / ARV
- ARV (on-the-fly)
- $290,928
- Comps found
- 3
Show comp detail 3 sales within ~0.75 mi
| Address | Dist | Beds/Ba | Sqft | Sold | Price | $/sf | Match |
|---|---|---|---|---|---|---|---|
| 3022 Walbrook Ave | 0.12mi | 5/4.5 (-1) | 2,200 (-12%) | 7mo | $255,000 | $116 | 57 |
| 2901 Windsor Ave | 0.29mi | 5/4.0 (-1) | 2,700 (+8%) | 12mo | $299,000 | $111 | 55 |
| 2528 N Ellamont St | 0.49mi | 6/4.0 | 2,300 (-8%) | 18mo | $302,000 | $131 | 44 |
Match score weights: distance 35% · size 25% · config 20% · recency 20%. Top-matched comps best support the ARV.
Projected returns pro-forma
-3.0% appreciation · 6.1% rent growth · sell at horizon
- IRR
- 22.9%
- Equity multiple
- 1.98×
- Total profit
- $49,371
- Equity at exit
- $26,824
- IRR
- 32.9%
- Equity multiple
- 4.44×
- Total profit
- $173,452
- Equity at exit
- $15,554
Cash invested: $50,372 (down + closing). Projections, not guarantees.
Landlord ↔ Tenant lean methodology
- Overall (CITY)
- 12 Strongly Tenant-Friendly
- State Maryland
- 27 Tenant-Leaning · D+14
- County
- — inherits STATE
- City Baltimore
- 12 Strongly Tenant-Friendly · D+58
ZIP-level market 21216
- Rents YoY
- 6.1%
- Active inventory
- 252
- Price-to-rent
- 5.1×
Monthly cashflow live
- Estimated rent
- $2,945 medium interval (Pro) →
- Mortgage (P&I)
- −$943
- Tax est. 1.5%
- −$225 /mo · $2,698/yr
- Insurance
- −$75
- HOA
- −$0
- Vacancy / Maint / Mgmt
- −$618
- Net cashflow
- $1,083
Break-even live
Sensitivity live
| Price | -10% $1,208 | -5% $1,146 | +0% $1,083 | +5% $1,021 | +10% $959 |
|---|---|---|---|---|---|
| Rent | -10% $851 | -5% $967 | +0% $1,083 | +5% $1,200 | +10% $1,316 |
| Rate | -1.0pp $1,174 | -0.5pp $1,129 | base $1,083 | +0.5pp $1,037 | +1.0pp $989 |
UW: 25.0% down · 7.5% · 30yr · 1.5% tax · 5.0% vac · 8.0% maint · 8.0% mgmt
Financing live
Cash to close
- Down payment
- $44,975
- Closing costs
- $5,397
- Reserves months
- —
- Total cash needed
- —
Loan-product check · same deal, 3 products live
Conventional
25% down · 7.5% · 30yr
- Down + closing
- —
- Monthly P&I
- —
- Monthly cashflow
- —
- DSCR
- —
- Eligible?
- —
Personal DTI + credit; lowest rate.
DSCR
20% down · 8.5% · 30yr
- Down + closing
- —
- Monthly P&I
- —
- Monthly cashflow
- —
- DSCR
- —
- Eligible?
- —
No personal income docs; deal must DSCR.
Hard money
10% down · 12.0% · 12mo
- Down + closing
- —
- Monthly P&I
- —
- Monthly cashflow
- —
- DSCR
- —
- Eligible?
- —
Short-term bridge; refi at stabilization.
Rent comps 3 comps
| Address | Beds | Baths | Sqft | Rent | $/sqft | DOM | Units | Dist |
|---|---|---|---|---|---|---|---|---|
| 2510 Roslyn Ave Baltimore, MD | 6.0 | 5.0 | 2663 | $4,200 | $1.58 | 45d | 1 | 0.72mi |
| 2401 W North Ave Baltimore, MD | 5.0 | 2.0 | 2037 | $1,800 | $0.88 | 6d | 1 | 0.74mi |
| 4029 Fairview Ave Baltimore, MD | 5.0 | 4.5 | 2653 | $3,200 | $1.21 | 45d | 1 | 1.27mi |
Listing history 32 events
-
2026-06-21days on market $179,900 Active 77 DOM
-
2026-06-18days on market $179,900 Active 74 DOM
-
2026-06-17days on market $179,900 Active 73 DOM
-
2026-06-16days on market $179,900 Active 72 DOM
-
2026-06-15days on market $179,900 Active 71 DOM
-
2026-06-13days on market $179,900 Active 69 DOM
-
2026-06-10price $179,900 Active 65 DOM
-
2026-06-09days on market $199,900 Active 65 DOM
-
2026-06-08days on market $199,900 Active 64 DOM
-
2026-06-07days on market $199,900 Active 63 DOM
-
2026-06-04days on market $199,900 Active 60 DOM
-
2026-06-03days on market $199,900 Active 59 DOM
-
2026-06-02days on market $199,900 Active 58 DOM
-
2026-06-01days on market $199,900 Active 57 DOM
-
2026-05-31days on market $199,900 Active 56 DOM
-
2026-05-19status Active
-
2026-05-01status Pending
-
2026-04-21price $199,900
-
2026-03-24status Active
-
2026-02-12historical
-
2026-02-06$224,900 Active
-
2025-01-31historical
-
2024-07-24price $249,900
-
2024-07-24status Active
-
2024-07-08status Pending
-
2023-09-22$299,900 Active
-
2023-05-10price $319,000
-
2023-05-09historical
-
2023-04-07$339,000 Active
-
2021-04-16soldstatus $210,000 Closed
-
2021-01-15status Pending
-
2020-12-06$230,000 Active
ⓘ Source: listings_history table (triggers on properties + properties_extension) + one-shot
backfill from property_details.listing_events for pre-trigger history.
Nearby sold comps map
Loading sold comps map…
Walkable amenities ~0.75 mi
Loading nearby amenities…
Taxation est. · year 1
- Rental income
- $35,343
- − Mortgage interest
- −$10,077
- − Property taxes
- −$2,698
- − Insurance
- −$900
- − Repairs & maintenance
- −$2,827
- − Management
- −$2,827
- − Depreciation
- −$5,233
- Taxable income
- $10,779
- Est. tax owed @ 24.0%
- −$2,587
- After-tax cash flow
- $10,415/yr
For passive investors: Depreciation is non-cash, so a rental often shows a tax loss while cash-flowing — sheltering income. Rental losses are passive: they offset passive income freely, and up to $25,000/yr can offset ordinary (W-2) income if you actively participate and your MAGI is under $100k (phasing out to $0 by $150k); unused losses carry forward. On sale, claimed depreciation is recaptured at up to 25%, and gains may owe capital-gains tax (a 1031 exchange can defer both). Figures are a year-1 estimate at your 24.0% rate — not tax advice; consult a CPA.
Schools (NCES district)
- District
- Baltimore City Public Schools
- NCES district ID
- 2400090
- Math proficiency
- 7% ▼ -9.00%
- Reading proficiency
- 16% ▼ -5.00%
- Median HH income
- $42,108
- Composite
- 10.08/100
- National rank
- #9805
- State rank
- #24 of 24 in MD
Livability — Baltimore
- Score
- 76/100
- State rank
- #90
- US rank
- #3396
Category grades
Schools grade is shown separately in the Schools card above.
Census & demographics
- Census place
- Baltimore, MD
- County
- Baltimore City · 558,601 people
- City population
- 588,727
- Metro
- Baltimore-Columbia-Towson, MD
- Population (ZIP)
- 29,426
- Household income
- $42,031
- Rent vs Own
- Severe rent burden
- 2264.0
Population outlook (Baltimore County) Hauer SSP2
- Today (2025)
- 624,249 people
- By 2030
- 621,541 · -0.4%
- By 2040
- 609,756 · -2.3%
- By 2050
- 597,249 · -4.3%
- By 2075
- 552,236 · -11.5%
- By 2100
- 513,934 · -17.7%
Race, ethnicity, and origin ACS 2023
- Neighborhood character
- Predominantly Black (91%)
- Race & ethnicity
- Black 91% Hispanic / Latino 4% Two or more races 3% White 2%
- Foreign-born
- 3% · Canada
- Languages at home
- 96% English-only · Spanish 3% French/Haitian/Cajun 1%
Political lean MEDSL · Baltimore
- 2024 margin
- Solid D (+73.0) · D 85.2% · R 12.2% · Other 2.6%
- 2008→2024 swing
- -2.5pp toward R · 2008: 75.5pp · 2024: 73.0pp
- All cycles
- 2024: D+73.0 2020: D+76.6 2016: D+74.6 2012: D+76.4 2008: D+75.5
Not yet ingested
- Civics
- —
Market trends
- HPI YoY
- ▼ -107.42%
- Current HPI
- 164.3933
- Rent YoY
- ▲ 6.10%
- Metro
- Baltimore-Columbia-Towson, MD
- State GDP YoY
- ▲ 2.97%
- F500 in state
- 12
Industry mix (Fortune 500 HQ in MD)
| Industry | F500 HQs | Revenue |
|---|---|---|
| Aerospace / Defense | 1 | $71B |
|
||
| Utilities | 1 | $25B |
|
||
| Hotels | 1 | $24B |
|
||
| Consumer Goods | 1 | $7B |
|
||
| Real Estate | 1 | $6B |
|
||
| Chemicals | 1 | $2B |
|
||
Price history
-13.1% since first listed17 events — show timeline
- 2026-05-19 Relisted — BRIGHT MLS
- 2026-05-01 Pending — BRIGHT MLS
- 2026-04-21 Price Changed $199,900 BRIGHT MLS
- 2026-03-24 Relisted — BRIGHT MLS
- 2026-02-12 Listing Removed — BRIGHT MLS
- 2026-02-06 Listed $224,900 BRIGHT MLS
- 2025-01-31 Listing Removed — BRIGHT MLS
- 2024-07-24 Price Changed $249,900 BRIGHT MLS
- 2024-07-24 Relisted — BRIGHT MLS
- 2024-07-08 Pending — BRIGHT MLS
- 2023-09-22 Listed $299,900 BRIGHT MLS
- 2023-05-10 Price Changed $319,000 BRIGHT MLS
- 2023-05-09 Listing Removed — BRIGHT MLS
- 2023-04-07 Listed $339,000 BRIGHT MLS
- 2021-04-16 Sold (MLS) $210,000 BRIGHT MLS
- 2021-01-15 Pending — BRIGHT MLS
- 2020-12-06 Listed $230,000 BRIGHT MLS
Cash-flow waterfall
monthlySold comps — $/sqft
last 12 mo · ≤1 miLoading sold comps…