 Duplex
12-14 Lincoln St · Granville, NY
Flood risk 1/10 · Minimal
- FEMA flood zone
- X
- Chance of flooding over 30 yrs
- 0.0%
- Est. flood insurance / yr
- $473 – $860
Fire risk 2/10 · Minimal
- Est. fire insurance / yr
- $691 – $1,283
Heat risk 3/10 · Minor
- Hot days now (above 94°F)
- 7 days/yr
- Hot days in 30 yrs
- 17 days/yr
Wind risk 2/10 · Minimal
- Chance of severe wind over 30 yrs
- 3.0%
Air-quality risk 2/10 · Minimal
- Unhealthy air days now
- 0 days/yr
- Unhealthy air days in 30 yrs
- 1 days/yr
Risk factors via First Street. Map © Google.
Why this score? — see what drove the B- grade
The composite is a weighted blend of 9 inputs, each scored 0–100. Each bar is that input's sub-score; the figure is the points it added to the 100-point composite (weight × sub-score).
- Cash flow +30.0/30.0
- 1% rule +10.0/10.0
- DSCR +10.0/10.0
- ARV discount +4.5/15.0
- Appreciation +4.4/10.0
- Schools +3.4/10.0
- Livability +3.1/5.0
- Rent growth +2.5/5.0
- Condition / age +2.0/5.0
$80,000
🖨 Deal sheet (PDF) 📄 Offer letter ✓ Due diligence
Multi-family units
County records classify this as Multi-Family (2-4 Unit). Listing-text estimate: 2 units. confirmed
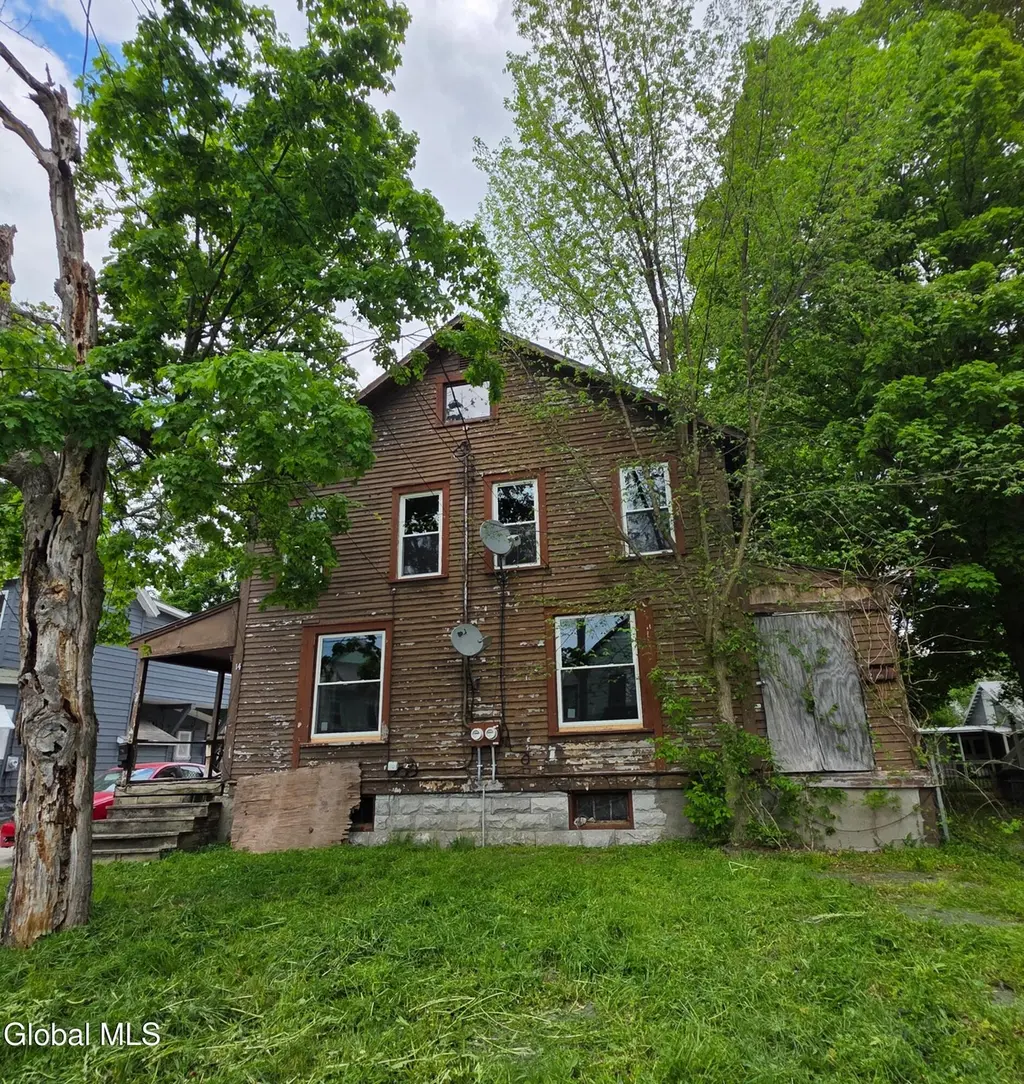
Listing remarks
Opportunity knocks on Lincoln Street! This two-family home has been taken down to the studs and is ready for its next chapter -- yours. The hardest, dirtiest work is done. New windows and exterior doors are already installed, the structure is exposed and ready to inspect, and the layout is yours to reimagine from the ground up. Whether you're an investor looking for a turnkey-ready rehab, a contractor seeking your next project, or a visionary homeowner dreaming of a custom owner-occupied duplex with rental income, the possibilities here are wide open. Design the space you've always wanted. Lay out the floor plan that works for modern living. Choose every finish, every fixture, every detail.
Key facts
- 7,840 sq ft lot
- 3 parking spots
- Built 1970
Property features AI
Exterior
- Parking: Three off-street parking spaces (driveway)
- Utilities: Public water; Public sewer
- Home design: Duplex; 2,588 living area; Slate roof; Wood siding construction
- Construction: Wood siding construction; Slate roof; Full, unfinished basement
- Exterior features: Side porch; Level lot
Interior
- Kitchen: Each unit has one kitchen
- Bedrooms: Two units each with three bedrooms (bedrooms located on the 2nd floor for both units)
- Bathrooms: Two full bathrooms total (one full bath in each unit on the 2nd floor)
- Interior features: ENERGY STAR qualified windows; Full, unfinished basement
- Laundry & utility: Basement utility space
Neighborhood map
What this means for you Summary
Snapshot
- This is a 2 × 3-bed/1.0-bath units multifamily listed at $80k. Condition is rated fair.
Deal economics
- At list price, monthly cash flow is $1k ($17k/yr) — positive. Per door: $713/mo.
- The deal already cash-flows at list — no discount required.
- Meets the 1% rule at list price ($3k rent vs $80k).
- Recommended offer: $79k (1.5% below list) — sets the bar for market timing.
Location & tenants
- Location reads 62/100 on livability (#846 in NY) — a middle-class / working-renter tenant base. Strengths: cost of living A+, housing A+, crime B+; Watch: employment D, amenities F, commute F.
- Granville Central School District (town): math 38% / reading 43% proficiency, ranked #521 of 590 in NY (top 88%) — families likely to look elsewhere, expect single-tenant / working-renter base with shorter leases.
- Zoned schools: Granville Junior-Senior High School (math 57% / reading 42%, grade D, #974 of 1,100 statewide, top 91%, 496 students, 40% FRL) — zoned schools at 40% FRL track the district average.
- Market conditions: 62 active listings in the ZIP; 106 units permitted in Washington County in 2024 (0 in 5+ unit buildings).
Forward outlook
- Local home prices are declining (-1.3%/yr); year-one equity from $553 of loan paydown is wiped out by about $1k of value loss. Plan a longer hold.
- Washington County population projected at -20% by 2050 — secular population decline; favor cash flow + early exit over multi-decade hold.
- At projected returns (-1.3% appreciation + 3.0% rent growth), your $22k cash investment doubles in ~2 years — after that, you're playing with house money.
Negotiation context
- It's been on market 30 days — a 2% lower offer ($79k) is reasonable based on typical stale-listing flexibility.
- 5 sale attempts since 21y ago; this cycle's ask has dropped $20k (20%) from the opening price — seller is motivated, your offer sets the floor, not the list.
- Current owner paid $65k; 23% above their basis — modest negotiation headroom, anchor on the comps not their cost.
Questions for the listing agent
- Can we see the unit-by-unit rent roll, current vacancy, and any below-market leases? What's the average tenancy length?
- What capital expenditures (roof, boiler, parking lot, exteriors) have been made in the last 5 years, and what's planned in the next 2?
- Have any recent inspections been done? Can we get a copy of the seller's disclosures and any deferred-maintenance estimates?
- Built in 1970 — when were the roof, HVAC, electrical panel, plumbing, and water heater last replaced?
- Is there a deadline driving the sale (1031 exchange, divorce, estate, relocation)? That informs how much negotiation room exists.
- Schools are D-rated, which usually means shorter tenancies and higher turnover. Who's the typical renter profile here, and what's been the actual vacancy rate?
- What's the average days-on-market for RENTAL listings here right now (not sales)? A rising rental-DOM trend means longer vacancies and softer asking-rent achievability than the comps imply.
- What's the recent tenant-quality profile in this submarket — average credit score on applications, eviction rate, late-payment / NSF rate, and stable-employment percentage? A property-management company in the area should have these aggregated.
- How much new apartment / multifamily construction is in the pipeline within 1–3 miles? Heavy new supply (>2% of stock underway) typically softens rents 12–24 months out; light construction supports rent growth.
Investment metrics
- 1% rule
- 3.13% ✓
- Cap rate
- 27.68%
- Cash-on-cash
- 76.40%
- DSCR
- 4.40
- GRM
- 2.7
CMA / ARV
- ARV (on-the-fly)
- $75,052
- Comps found
- 4
Show comp detail 4 sales within ~0.75 mi
| Address | Dist | Beds/Ba | Sqft | Sold | Price | $/sf | Match |
|---|---|---|---|---|---|---|---|
| 14 Lincoln St | 0.01mi | 6/4.0 | 2,588 (0%) | 16mo | $75,000 | $29 | 79 |
| 18 1/2 Mettowee St | 0.35mi | 6/2.0 | 2,624 (+1%) | 19mo | $62,500 | $24 | 65 |
| 5-7 Factory Street St | 0.34mi | 6/2.0 | 2,438 (-6%) | 13mo | $161,195 | $66 | 64 |
| 9-11 Factory St | 0.35mi | 6/2.0 | 2,368 (-8%) | 22mo | $55,000 | $23 | 51 |
Match score weights: distance 35% · size 25% · config 20% · recency 20%. Top-matched comps best support the ARV.
Projected returns pro-forma
-1.3% appreciation · 3.0% rent growth · sell at horizon
- IRR
- 77.6%
- Equity multiple
- 4.74×
- Total profit
- $83,775
- Equity at exit
- $18,176
- IRR
- 80.1%
- Equity multiple
- 9.73×
- Total profit
- $195,491
- Equity at exit
- $18,135
Cash invested: $22,400 (down + closing). Projections, not guarantees.
Landlord ↔ Tenant lean methodology
- Overall (STATE)
- 15 Strongly Tenant-Friendly
- State New York
- 15 Strongly Tenant-Friendly · D+10
- County
- — inherits STATE
- City
- — inherits STATE
ZIP-level market 12832
- Home prices YoY
- -0.4%
- Active inventory
- 62
- Price-to-rent
- 5.3×
Monthly cashflow live
- Estimated rent
- $2,505 medium interval (Pro) →
- Mortgage (P&I)
- −$420
- Tax est. 1.5%
- −$100 /mo · $1,200/yr
- Insurance
- −$33
- HOA
- −$0
- Vacancy / Maint / Mgmt
- −$526
- Net cashflow
- $1,426
Break-even live
Sensitivity live
| Price | -10% $1,481 | -5% $1,454 | +0% $1,426 | +5% $1,398 | +10% $1,371 |
|---|---|---|---|---|---|
| Rent | -10% $1,228 | -5% $1,327 | +0% $1,426 | +5% $1,525 | +10% $1,624 |
| Rate | -1.0pp $1,466 | -0.5pp $1,446 | base $1,426 | +0.5pp $1,405 | +1.0pp $1,384 |
2-unit breakdown (identical units grouped — click to expand)
| Units | Beds | Baths | Est. rent |
|---|---|---|---|
| 2× units | 3 | 1 | $2,506 |
| #1 | 3 | 1 | $1,253 |
| #2 | 3 | 1 | $1,253 |
| Total (2 units) | $2,505 | ||
UW: 25.0% down · 7.5% · 30yr · 1.5% tax · 5.0% vac · 8.0% maint · 8.0% mgmt
Financing live
Cash to close
- Down payment
- $20,000
- Closing costs
- $2,400
- Reserves months
- —
- Total cash needed
- —
Loan-product check · same deal, 3 products live
Conventional
25% down · 7.5% · 30yr
- Down + closing
- —
- Monthly P&I
- —
- Monthly cashflow
- —
- DSCR
- —
- Eligible?
- —
Personal DTI + credit; lowest rate.
DSCR
20% down · 8.5% · 30yr
- Down + closing
- —
- Monthly P&I
- —
- Monthly cashflow
- —
- DSCR
- —
- Eligible?
- —
No personal income docs; deal must DSCR.
Hard money
10% down · 12.0% · 12mo
- Down + closing
- —
- Monthly P&I
- —
- Monthly cashflow
- —
- DSCR
- —
- Eligible?
- —
Short-term bridge; refi at stabilization.
Listing history 24 events
-
2026-06-21days on market $80,000 Active 30 DOM
-
2026-06-18days on market $80,000 Active 28 DOM
-
2026-06-17days on market $80,000 Active 27 DOM
-
2026-06-16days on market $80,000 Active 26 DOM
-
2026-06-15days on market $80,000 Active 25 DOM
-
2026-06-13days on market $80,000 Active 23 DOM
-
2026-06-12days on market $80,000 Active 22 DOM
-
2026-06-09days on market $80,000 Active 19 DOM
-
2026-06-08days on market $80,000 Active 18 DOM
-
2026-06-07days on market $80,000 Active 17 DOM
-
2026-06-05pricedays on market $80,000 Active 15 DOM
-
2026-06-04days on market $100,000 Active 13 DOM
-
2026-06-02days on market $100,000 Active 12 DOM
-
2026-06-01days on market $100,000 Active 11 DOM
-
2026-05-31days on market $100,000 Active 10 DOM
-
2026-05-21$100,000 Active
-
2009-06-11historical
-
2008-09-11$99,000
-
2008-05-10historical
-
2007-05-10$99,000
-
2006-11-14soldstatus $65,000
-
2006-11-11soldstatus $65,000
-
2006-03-17$90,000
-
2005-12-05$90,000
ⓘ Source: listings_history table (triggers on properties + properties_extension) + one-shot
backfill from property_details.listing_events for pre-trigger history.
Climate risk First Street
- Flood 1/10 Low FEMA zone X · 0% chance over 30 yrs
- Wildfire 2/10 Low
- Heat 3/10 Moderate 7 d/yr ≥94°F today · 17 d/yr by 30 yrs out
- Wind 2/10 Low 3% chance of damaging wind over 30 yrs
- Air quality 2/10 Low 0 unhealthy d/yr today · 1 by 30 yrs out
Nearby sold comps map
Loading sold comps map…
Walkable amenities ~0.75 mi
Loading nearby amenities…
Taxation est. · year 1
- Rental income
- $30,060
- − Mortgage interest
- −$4,481
- − Property taxes
- −$1,200
- − Insurance
- −$400
- − Repairs & maintenance
- −$2,405
- − Management
- −$2,405
- − Depreciation
- −$2,327
- Taxable income
- $16,842
- Est. tax owed @ 24.0%
- −$4,042
- After-tax cash flow
- $13,071/yr
For passive investors: Depreciation is non-cash, so a rental often shows a tax loss while cash-flowing — sheltering income. Rental losses are passive: they offset passive income freely, and up to $25,000/yr can offset ordinary (W-2) income if you actively participate and your MAGI is under $100k (phasing out to $0 by $150k); unused losses carry forward. On sale, claimed depreciation is recaptured at up to 25%, and gains may owe capital-gains tax (a 1031 exchange can defer both). Figures are a year-1 estimate at your 24.0% rate — not tax advice; consult a CPA.
Condition & rehab AI · 12 photos
This two-family home is in poor condition and requires extensive repairs and updates to be move-in ready.
Repairs flagged
- Major Exterior siding — No siding visible
- Major Windows — Exposed framing, no windows
- Major Drywall — Exposed framing, no drywall
- Major Flooring — Exposed framing, no flooring
- Major Appliances — Exposed framing, no appliances
- Major Fixtures — Exposed framing, no fixtures
- Major HVAC — Exposed framing, no HVAC
Value-add opportunities
- Both Exterior siding — Enhances curb appeal and protects the structure
- Both Windows — Improves energy efficiency and security
- Both Drywall — Provides a clean, finished look and protects the structure
- Both Flooring — Enhances the living space and protects the structure
- Both Appliances — Completes the kitchen and makes it functional
- Both Fixtures — Completes the bathrooms and makes them functional
- Both HVAC — Improves comfort and energy efficiency
Renovation cost estimate screening
| Repair item | Severity | Est. cost |
|---|---|---|
| Exterior siding · No siding visible | Major | $15,000–50,000 |
| Windows · Exposed framing, no windows | Major | $15,000–50,000 |
| Drywall · Exposed framing, no drywall | Major | $15,000–50,000 |
| Flooring · Exposed framing, no flooring | Major | $15,000–50,000 |
| Appliances · Exposed framing, no appliances | Major | $15,000–50,000 |
| Fixtures · Exposed framing, no fixtures | Major | $15,000–50,000 |
| HVAC · Exposed framing, no HVAC | Major | $15,000–50,000 |
| Total estimated repair cost · 7 items | $105,000–350,000 |
Value-add ROI direction
- Both Exterior siding — Enhances curb appeal and protects the structure ↑
- Both Windows — Improves energy efficiency and security ↑
- Both Drywall — Provides a clean, finished look and protects the structure ↑
- Both Flooring — Enhances the living space and protects the structure ↑
- Both Appliances — Completes the kitchen and makes it functional ↑
- Both Fixtures — Completes the bathrooms and makes them functional ↑
- Both HVAC — Improves comfort and energy efficiency ↑
ⓘ Cost ranges are severity-bucket heuristics (US national rule-of-thumb). Get contractor quotes + a written scope before underwriting a rehab budget.
Schools (NCES district)
- District
- Granville Central School District
- NCES district ID
- 3612450
- Math proficiency
- 38% ▼ -5.00%
- Reading proficiency
- 43% ▼ -3.00%
- Median HH income
- $43,936
- Composite
- 34.32/100
- National rank
- #5237
- State rank
- #521 of 590 in NY
Livability — Granville
- Score
- 62/100
- State rank
- #846
- US rank
- #16391
Category grades
Schools grade is shown separately in the Schools card above.
Census & demographics
- Census place
- Granville, NY
- Population (ZIP)
- 6,395
Population outlook (Washington County) Hauer SSP2
- Today (2025)
- 59,576 people
- By 2030
- 57,618 · -3.3%
- By 2040
- 52,751 · -11.5%
- By 2050
- 47,514 · -20.2%
- By 2075
- 35,690 · -40.1%
- By 2100
- 24,807 · -58.4%
Race, ethnicity, and origin ACS 2023
- Neighborhood character
- Predominantly White (88%)
- Race & ethnicity
- White 88% Two or more races 6% Black 2% Hispanic / Latino 2% Asian 2%
- Common ancestry
- Lithuanian 7% Romanian 4% Iranian 1%
- Foreign-born
- 3% · Canada
- Languages at home
- 98% English-only · Spanish 1%
Political lean MEDSL · Washington
- 2024 margin
- Strong R (+21.2) · D 39.4% · R 60.6%
- 2008→2024 swing
- -22.0pp toward R · 2008: 0.8pp · 2024: -21.2pp
- All cycles
- 2024: R+21.2 2020: R+15.6 2016: R+20.2 2012: D+1.6 2008: D+0.8
Not yet ingested
- Civics
- —
Market trends
- HPI YoY
- ▼ -1.30%
- Current HPI
- 326.4556
- Rent YoY
- —
- Metro
- —
- State GDP YoY
- ▲ 2.60%
- F500 in state
- 92
Industry mix (Fortune 500 HQ in NY)
| Industry | F500 HQs | Revenue |
|---|---|---|
| Financial Services | 10 | $950B |
|
||
| Consumer Goods | 9 | $162B |
|
||
| Insurance | 4 | $225B |
|
||
| Telecommunications | 2 | $144B |
|
||
| Pharmaceuticals | 2 | $112B |
|
||
| Media / Entertainment | 2 | $69B |
|
||
Price history
+11.1% since first listed9 events — show timeline
- 2026-05-21 Listed $100,000 Global MLS
- 2009-06-11 Listing Removed — Global MLS
- 2008-09-11 Listed $99,000 Global MLS
- 2008-05-10 Listing Removed — Global MLS
- 2007-05-10 Listed $99,000 Global MLS
- 2006-11-14 Sold (MLS) $65,000 Global MLS
- 2006-11-11 Sold (MLS) $65,000 Global MLS
- 2006-03-17 Listed $90,000 Global MLS
- 2005-12-05 Listed $90,000 Global MLS
Cash-flow waterfall
monthlySold comps — $/sqft
last 12 mo · ≤1 miLoading sold comps…