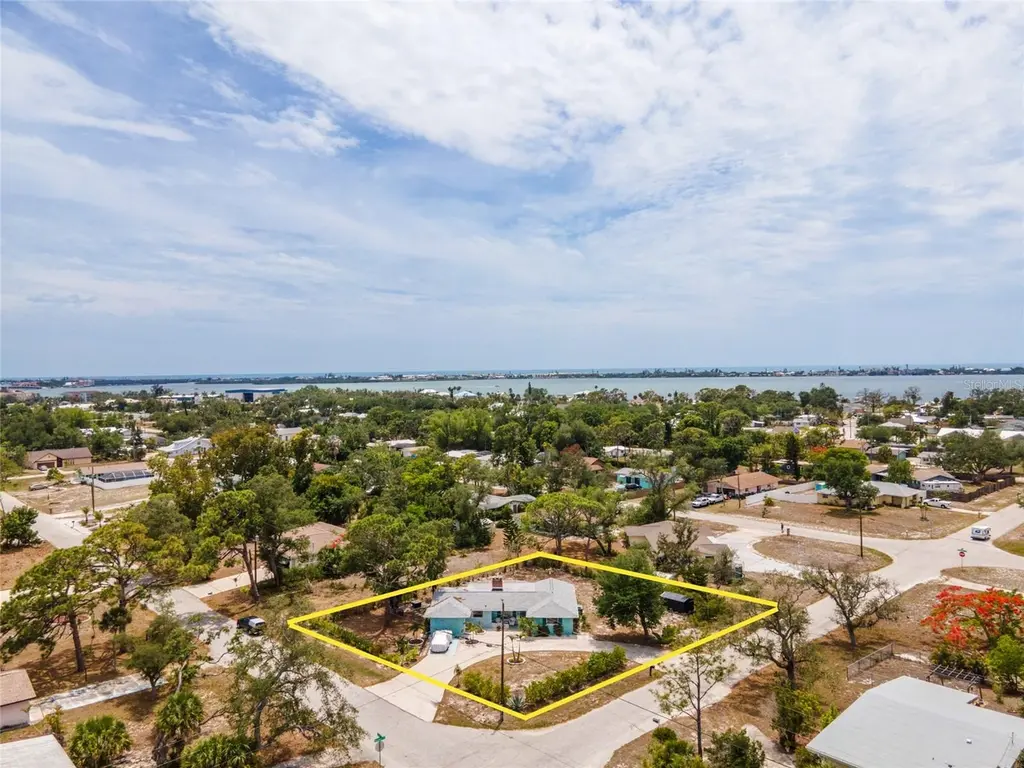
139 Hosmer Ave · Englewood, FL
Flood risk 5/10 · Moderate
- FEMA flood zone
- X (shaded)
- Chance of flooding over 30 yrs
- 0.23%
- Est. flood insurance / yr
- $507 – $1,088
Fire risk 1/10 · Minimal
- Est. fire insurance / yr
- $947 – $1,759
Heat risk 10/10 · Severe
- Hot days now (above 107°F)
- 7 days/yr
- Hot days in 30 yrs
- 29 days/yr
Wind risk 10/10 · Severe
- Chance of severe wind over 30 yrs
- 99.0%
Air-quality risk 3/10 · Minor
- Unhealthy air days now
- 2 days/yr
- Unhealthy air days in 30 yrs
- 2 days/yr
Risk factors via First Street. Map © Google.
Why this score? — see what drove the B+ grade
The composite is a weighted blend of 9 inputs, each scored 0–100. Each bar is that input's sub-score; the figure is the points it added to the 100-point composite (weight × sub-score).
- Cash flow +29.2/30.0
- ARV discount +11.8/15.0
- DSCR +10.0/10.0
- 1% rule +7.8/10.0
- Schools +5.4/10.0
- Rent growth +4.8/5.0
- Livability +3.7/5.0
- Condition / age +2.5/5.0
- Appreciation +0.0/10.0
$269,000
🖨 Deal sheet 📄 Offer letter ✓ Due diligence
Listing remarks
Under contract-accepting backup offers. Discover the perfect blend of comfort, convenience, and classic Florida charm in this beautifully maintained home situated on an OVERSIZED CORNER LOT with NO HOA restrictions in the heart of Englewood just minutes from Englewood Beach! Featuring A NEWER ROOF (2023), a BRAND NEW AIR CONDITIONER, NEWER STAINLESS STEEL APPLIANCES, and timeless TERRAZZO FLOORING, this property is move-in ready. Multiple sliding glass doors open to the FULLY SCREENED AND PARTIALLY COVERED LANAI, creating seamless indoor-outdoor living and the perfect space to relax or entertain year-round. The SPACIOUS YARD offers plenty of room to add the pool of your dreams while still l
Key facts
- Oversized corner lot
- Spacious yard
- Newer roof
Tags
Property features AI
Finance
- Other: Property type: Residential, single family; Zoning: RSF3; Lot approximately 0.33 acre (lot dimensions provided); Additional storage structures on site; Unit/floor info: floor 1
- Financial info: Furnished; Lease restrictions apply
- HOA & community: No HOA association indicated; Golf carts allowed; Cats and dogs allowed
Exterior
- Parking: Circular driveway; Driveway parking; On-street parking; Off-street guest parking; Ground level parking
- Security: Owned security system
- Utilities: Public water; Public sewer; Electricity connected; Water connected; Sewer connected; Cable available; Phone available; Broadband/high-speed internet available
- Home design: Single family residence; One-story; Northwest facing; Completed condition; Entry level on one level
- Construction: Block, concrete, and stucco construction; Shingle roof; Slab foundation; Built as completed (year not specified)
- Exterior features: Covered front and rear porches; Patio; Screened porch; Exterior lighting; Rain gutters; Sliding doors; Storage shed(s); Wire fencing; Landscaped with trees; Cleared, level, corner lot; Paved road access (public maintained)
Interior
- Kitchen: Cooktop; Range; Dishwasher; Microwave; Refrigerator; Stone countertops
- Bedrooms: 3 bedrooms
- Flooring: Concrete; Terrazzo
- Bathrooms: 2 full bathrooms
- Heating & cooling: Central electric heating; Central air; Mini-split unit(s)
- Interior features: Ceiling fans; Stone countertops; Thermostat; Walk-in closet(s); Blinds and drapes; Storage rooms; Electric fireplace in living room
- Laundry & utility: Inside laundry room; Washer; Dryer
Neighborhood map
What this means for you Summary
Snapshot
- This is a 3-bed/2.0-bath single-family listed at $269k.
Deal economics
- At list price, monthly cash flow is $940 ($11k/yr) — positive.
- The deal already cash-flows at list — no discount required.
- Meets the 1% rule at list price ($3k rent vs $269k).
- Cap rate 10.5% vs local median 3.8% in Englewood — top-decile yield for the area; either an underpriced asset or a hidden risk that comps aren't pricing in. Stress-test before assuming the spread holds.
Location & tenants
- Location reads 73/100 on livability (#321 in FL) — a middle-class / working-renter tenant base. Strengths: housing A+, cost of living A, health & safety A; Watch: employment C-, amenities F, commute F.
- Sarasota (urban): math 63% / reading 63% proficiency, ranked #7 of 73 in FL (top 10%) — acceptable for families but not a draw, mixed tenant base, ~2y average lease.
- Zoned schools: Englewood Elementary School (math 65% / reading 66%, grade B+, #500 of 2,144 statewide, top 24%, 587 students, 52% FRL).
- Market conditions: Rents rising fast (+9.0%/yr); 717 active listings in the ZIP; 11 comparable units currently listed for rent nearby; rentals at typical pace (median 21d on market — plan ~3-4 weeks tenant-placement turnaround); solid renter incomes; 7,466 units permitted in Sarasota County in 2024 (2,138 in 5+ unit buildings).
- At $3,441/mo this rent would consume 54% of the median local household income ($76k/yr) (locally 290% of renters already pay >50% of income on rent) — very limited rent-growth headroom before tenants either downsize or default.
Forward outlook
- Local home prices are declining (-3.0%/yr); year-one equity from $2k of loan paydown is wiped out by about $8k of value loss. Plan a longer hold.
- Sarasota County population projected at +20% by 2050 — long-run rental-demand tailwind backs the buy-and-hold thesis.
- At projected returns (-3.0% appreciation + 8.0% rent growth), your $75k cash investment doubles in ~6 years — after that, you're playing with house money.
Negotiation context
- Only 13 days on market — expect competitive offers; lowballing is unlikely to land.
- 2 sale attempts since 3y ago with the ask held roughly flat each time — persistent listings suggest the price (not the market) is what's stuck; bring a comps-based counter.
Risks & watch-outs
- Climate carrying-cost: moderate flood risk; severe wind risk, 99% chance of damaging wind over 30y; extreme-heat days projected 7→29/yr by 2055 (HVAC capex compounding) — expect insurance premiums to compound above CPI over the hold.
Questions for the listing agent
- Built in 1966 — when were the roof, HVAC, electrical panel, plumbing, and water heater last replaced?
- Is there a deadline driving the sale (1031 exchange, divorce, estate, relocation)? That informs how much negotiation room exists.
- Schools are A-rated — typically a magnet for longer-tenancy family renters. What's the average tenant stay here, and is there a school-zone premium baked into asking?
- What's the average days-on-market for RENTAL listings here right now (not sales)? A rising rental-DOM trend means longer vacancies and softer asking-rent achievability than the comps imply.
- What's the recent tenant-quality profile in this submarket — average credit score on applications, eviction rate, late-payment / NSF rate, and stable-employment percentage? A property-management company in the area should have these aggregated.
- How much new for-sale + rental construction is in the pipeline within 1–3 miles? Heavy new supply typically softens prices + rents 12–24 months out; constrained supply supports both.
Investment metrics
- 1% rule
- 1.28% ✓
- Cap rate
- 10.49%
- Cash-on-cash
- 14.98%
- DSCR
- 1.67
- GRM
- 6.5
CMA / ARV
- ARV (median comp)
- $297,156
- List price
- $269,000
- Delta
- -9.48%
- Verdict
- FAIR
- Comps
- 14 within 1.0 mi
Projected returns pro-forma
-3.0% appreciation · 8.0% rent growth · sell at horizon
- IRR
- 10.9%
- Equity multiple
- 1.46×
- Total profit
- $34,496
- Equity at exit
- $40,109
- IRR
- 23.6%
- Equity multiple
- 3.52×
- Total profit
- $189,943
- Equity at exit
- $23,258
Cash invested: $75,320 (down + closing). Projections, not guarantees.
Landlord ↔ Tenant lean methodology
- Overall (STATE)
- 87 Strongly Landlord-Friendly
- State Florida
- 87 Strongly Landlord-Friendly · R+3
- County
- — inherits STATE
- City
- — inherits STATE
ZIP-level market 34223
- Home prices YoY
- -34.2%
- Rents YoY
- 9.0%
- Active inventory
- 717
- Price-to-rent
- 6.5×
Monthly cashflow live
- Estimated rent
- $3,441 high interval (Pro) →
- Mortgage (P&I)
- −$1,411
- Tax from tax record
- −$255 /mo · $3,062/yr
- Insurance
- −$112
- HOA
- −$0
- Vacancy / Maint / Mgmt
- −$723
- Net cashflow
- $940
Break-even live
UW: 25.0% down · 7.5% · 30yr · 1.5% tax · 5.0% vac · 8.0% maint · 8.0% mgmt
Financing live
Cash to close
- Down payment
- $67,250
- Closing costs
- $8,070
- Reserves months
- —
- Total cash needed
- —
Loan-product check · same deal, 3 products live
Conventional
25% down · 7.5% · 30yr
- Down + closing
- —
- Monthly P&I
- —
- Monthly cashflow
- —
- DSCR
- —
- Eligible?
- —
Personal DTI + credit; lowest rate.
DSCR
20% down · 8.5% · 30yr
- Down + closing
- —
- Monthly P&I
- —
- Monthly cashflow
- —
- DSCR
- —
- Eligible?
- —
No personal income docs; deal must DSCR.
Hard money
10% down · 12.0% · 12mo
- Down + closing
- —
- Monthly P&I
- —
- Monthly cashflow
- —
- DSCR
- —
- Eligible?
- —
Short-term bridge; refi at stabilization.
Rent comps 11 comps
| Address | Beds | Baths | Sqft | Rent | $/sqft | DOM | Units | Dist |
|---|---|---|---|---|---|---|---|---|
| 1210 S Maryknoll Rd Englewood, FL | 2.0 | 2.0 | 1063 | $2,600 | $2.45 | 21d | 1 | 0.79mi |
| 1401 S McCall Rd Unit 301A Englewood, FL | 2.0 | 2.0 | 1093 | $3,300 | $3.02 | 21d | 1 | 0.86mi |
| 1575 Loralin Dr Englewood, FL | 3.0 | 2.0 | 1322 | $5,000 | $3.78 | 21d | 1 | 0.93mi |
| 858 E 7th St Englewood, FL | 3.0 | 2.0 | 1244 | $1,995 | $1.60 | 21d | 1 | 1.16mi |
| 5041 N Beach Rd Unit 3-A Englewood, FL | 2.0 | 1.0 | 864 | $3,000 | $3.47 | 21d | 1 | 1.34mi |
| 1120 Lampp Dr Englewood, FL | 3.0 | 2.0 | 1212 | $4,000 | $3.30 | 21d | 1 | 1.40mi |
| 5031 N Beach Rd #112 Englewood, FL | 2.0 | 2.0 | 1035 | $2,500 | $2.42 | 13d | 1 | 1.41mi |
| 1531 Placida Rd #204 Englewood, FL | 2.0 | 2.0 | 1056 | $3,500 | $3.31 | 21d | 1 | 1.42mi |
| 1531 Placida Rd #203 Englewood, FL | 2.0 | 2.0 | 1056 | $3,900 | $3.69 | 21d | 1 | 1.43mi |
| 2955 N Beach Rd Unit E122 Englewood, FL | 2.0 | 2.0 | 1060 | $2,850 | $2.69 | 21d | 1 | 1.46mi |
| 2955 N Beach Rd Unit 1546022P Englewood, FL | 2.0 | 2.0 | 1140 | $6,423 | $5.63 | 13d | 1 | 1.50mi |
Listing history 4 events
-
2026-05-14$269,000 Active 2096-char remark
-
2023-03-01soldstatus $265,000
-
2023-02-14$285,000
-
2001-11-27soldstatus $85,000
ⓘ Source: listings_history table (triggers on properties + properties_extension) + one-shot
backfill from property_details.listing_events for pre-trigger history.
Tax reassessment forecast FL · Resets to sale price
- Current annual tax
- $3,062 · $255/mo
- Projected year-2 tax
- $3,062 · $255/mo
- Expected delta
- $0/yr ($0/mo · 0.0%)
ⓘ Screening estimate from a state-policy table — verify with the county assessor before closing.
Climate risk First Street
- Flood 5/10 Major FEMA zone X (shaded) · 23% chance over 30 yrs
- Wildfire 1/10 Low
- Heat 10/10 Extreme 7 d/yr ≥107°F today · 29 d/yr by 30 yrs out
- Wind 10/10 Extreme 99% chance of damaging wind over 30 yrs
- Air quality 3/10 Moderate 2 unhealthy d/yr today · 2 by 30 yrs out
Nearby sold comps map
Loading sold comps map…
Walkable amenities ~0.75 mi
Loading nearby amenities…
Taxation est. · year 1
- Rental income
- $41,292
- − Mortgage interest
- −$15,068
- − Property taxes
- −$3,062
- − Insurance
- −$1,345
- − Repairs & maintenance
- −$3,303
- − Management
- −$3,303
- − Depreciation
- −$7,825
- Taxable income
- $7,384
- Est. tax owed @ 24.0%
- −$1,772
- After-tax cash flow
- $9,513/yr
For passive investors: Depreciation is non-cash, so a rental often shows a tax loss while cash-flowing — sheltering income. Rental losses are passive: they offset passive income freely, and up to $25,000/yr can offset ordinary (W-2) income if you actively participate and your MAGI is under $100k (phasing out to $0 by $150k); unused losses carry forward. On sale, claimed depreciation is recaptured at up to 25%, and gains may owe capital-gains tax (a 1031 exchange can defer both). Figures are a year-1 estimate at your 24.0% rate — not tax advice; consult a CPA.
Schools (NCES district)
- District
- Sarasota
- NCES district ID
- 1201680
- Math proficiency
- 63% ▼ -8.00%
- Reading proficiency
- 63% ▼ -3.00%
- Median HH income
- $51,167
- Composite
- 53.68/100
- National rank
- #1428
- State rank
- #7 of 73 in FL
Livability — Englewood
- Score
- 73/100
- State rank
- #321
- US rank
- #5655
Category grades
Schools grade is shown separately in the Schools card above.
Census & demographics
- Census place
- Englewood, FL
- County
- Sarasota County · 448,376 people
- City population
- 35,420
- Metro
- North Port-Sarasota-Bradenton, FL
- Population (ZIP)
- 19,884
- Household income
- $76,016
- Rent vs Own
- Severe rent burden
- 290.0
Population outlook (Sarasota County) Hauer SSP2
- Today (2025)
- 452,380 people
- By 2030
- 474,175 · +4.8%
- By 2040
- 511,577 · +13.1%
- By 2050
- 541,467 · +19.7%
- By 2075
- 604,947 · +33.7%
- By 2100
- 621,965 · +37.5%
Race, ethnicity, and origin ACS 2023
- Neighborhood character
- Predominantly White (94%)
- Race & ethnicity
- White 94% Two or more races 3% Hispanic / Latino 3% Asian 1%
- Common ancestry
- Romanian 7% Lithuanian 4% Iranian 2%
- Foreign-born
- 9% · Canada
- Languages at home
- 94% English-only · German/W. Germanic 2% Spanish 1% Other Indo-European 1%
Political lean MEDSL · Sarasota
- 2024 margin
- R (+18.2) · D 40.5% · R 58.7%
- 2008→2024 swing
- -18.1pp toward R · 2008: -0.1pp · 2024: -18.2pp
- All cycles
- 2024: R+18.2 2020: R+10.4 2016: R+11.6 2012: R+7.4 2008: R+0.1
Not yet ingested
- Civics
- —
Market trends
- HPI YoY
- ▼ -146.26%
- Current HPI
- 281.0529
- Rent YoY
- ▲ 9.02%
- Metro
- North Port-Sarasota-Bradenton, FL
- State GDP YoY
- ▲ 3.28%
- F500 in state
- 36
Industry mix (Fortune 500 HQ in FL)
| Industry | F500 HQs | Revenue |
|---|---|---|
| Industrial Technology | 2 | $29B |
|
||
| Insurance | 2 | $17B |
|
||
| Retail | 1 | $60B |
|
||
| Technology Distribution | 1 | $58B |
|
||
| Homebuilding | 1 | $35B |
|
||
| Technology Manufacturing | 1 | $35B |
|
||
Price history
+216.5% since first listed5 events — show timeline
- 2026-05-27 Pending — Stellar MLS as Distributed by MLS Grid
- 2026-05-14 Listed $269,000 Stellar MLS as Distributed by MLS Grid
- 2023-03-01 Sold (Public Records) $265,000 Public Records
- 2023-02-14 Listed $285,000 Stellar MLS as Distributed by MLS Grid
- 2001-11-27 Sold (Public Records) $85,000 Public Records
Property tax history
+9.6%/yrLatest (2025): $3,062 · -2.4% YoY. Source: county tax records.
Cash-flow waterfall
monthlySold comps — $/sqft
last 12 mo · ≤1 miLoading sold comps…