 Fourplex
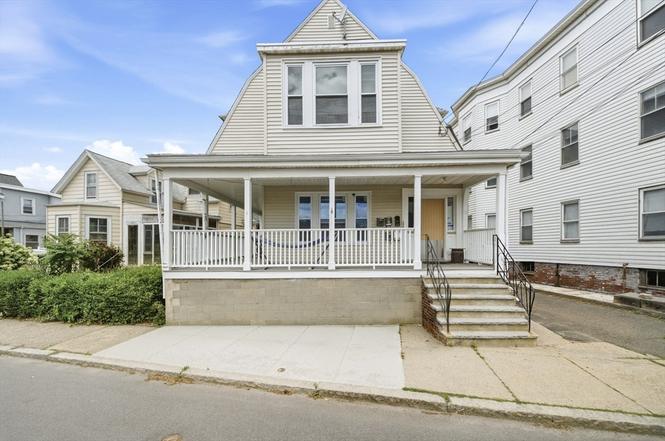
32 Irwin St · Winthrop Town, MA
Flood risk 7/10 · Major
- FEMA flood zone
- AE
- Chance of flooding over 30 yrs
- 0.95%
- Est. flood insurance / yr
- $1,737 – $8,500
Fire risk 1/10 · Minimal
- Est. fire insurance / yr
- $915 – $1,699
Heat risk 6/10 · Moderate
- Hot days now (above 96°F)
- 7 days/yr
- Hot days in 30 yrs
- 15 days/yr
Wind risk 8/10 · Major
- Chance of severe wind over 30 yrs
- 80.0%
Air-quality risk 3/10 · Minor
- Unhealthy air days now
- 3 days/yr
- Unhealthy air days in 30 yrs
- 3 days/yr
Risk factors via First Street. Map © Google.
Why this score? — see what drove the C+ grade
The composite is a weighted blend of 9 inputs, each scored 0–100. Each bar is that input's sub-score; the figure is the points it added to the 100-point composite (weight × sub-score).
- Cash flow +30.0/30.0
- DSCR +10.0/10.0
- 1% rule +8.4/10.0
- Rent growth +5.0/5.0
- Livability +3.8/5.0
- Schools +3.5/10.0
- Condition / age +2.5/5.0
- ARV discount +0.0/15.0
- Appreciation +0.0/10.0
$1,100,000
🖨 Deal sheet (PDF) 📄 Offer letter ✓ Due diligence
Multi-family units
County records classify this as Multi-Family (5+ Unit). Listing-text estimate: 4 units. estimate disagrees with records
5+ unit building — per-unit beds/baths from public records are typically unavailable; the breakdown below (if shown) is an estimate from the listing text.
Listing remarks
A rare opportunity to own a 4-unit multi-family investment property in one of Winthrop's most sought-after coastal locations, just minutes from downtown Boston and Logan Airport. This value-add asset offers an ideal mix for investors and owner-occupants alike. The property features one three-bedroom apartment, one two-bedroom apartment, and two studio units. The three-bedroom, two-bedroom, and one studio apartments are currently leased, and the remaining studio will be delivered vacant. Three off-street parking spaces come with the property. Set on a 4,075± sq ft lot in a supply-constrained market with strong, year-round rental demand, the property delivers a compelling blend of in-p
Key facts
- Coastal location
- Strong rental demand
- Steps to the beach
Tags
Property features AI
Finance
- Other: Any tenant-owned appliances are excluded from the sale; Property currently listed as Active
- Financial info: Tax details not included per instructions
- HOA & community: Not a senior community; Community amenities nearby include public transportation, shopping, golf, laundromat, house of worship, marina, and public schools
Exterior
- Parking: Off-street paved parking; Open parking available for 3 vehicles
- Security: No specific security features listed
- Utilities: Public water; Public sewer; Electric with circuit breakers
- Home design: 4-family property; 4 total stories; Building area approximately 2,949 (above grade finished area 2,949); Has waterview (ocean)
- Construction: Frame construction; Block and brick/mortar foundation; Shingle roof; Built year per public records
- Exterior features: Porch; Rain gutters; Level lot; Ocean view; 0 to 1/10 mile to the beach; Public beach access nearby; Public road frontage; Publicly maintained road
Interior
- Kitchen: Range; Dishwasher; Microwave; Refrigerator
- Bedrooms: Multiple units with bedroom counts not specified
- Flooring: Hardwood floors
- Bathrooms: 4 full bathrooms
- Heating & cooling: Baseboard heating (natural gas); 3 heating units/zones; Window air conditioning units
- Interior features: Living room; Kitchen; Office/Den; Sunroom; Total of 14 rooms; Unfinished basement
- Laundry & utility: Washer/dryer details not provided
Neighborhood map
What this means for you Summary
Snapshot
- This is a 4 × 5-bed/4.0-bath units multifamily listed at $1.10M.
Deal economics
- At list price, monthly cash flow is $4k ($54k/yr) — positive. Per door: $1k/mo.
- The deal already cash-flows at list — no discount required.
- Meets the 1% rule at list price ($15k rent vs $1.10M).
- Cap rate 11.6% vs local median 2.1% in Winthrop Town — top-decile yield for the area; either an underpriced asset or a hidden risk that comps aren't pricing in. Stress-test before assuming the spread holds.
Location & tenants
- Location reads 75/100 on livability (#72 in MA, #3,946 nationally) — a middle-class / working-renter tenant base. Strengths: crime A+, commute A+, employment A+; Watch: amenities F, cost of living F.
- Winthrop (suburban): math 30% / reading 49% proficiency, ranked #200 of 302 in MA (top 66%) — families likely to look elsewhere, expect single-tenant / working-renter base with shorter leases.
- Zoned schools: Winthrop Middle School (math 30% / reading 44%, grade F, #162 of 305 statewide, top 55%, 425 students, 0% FRL); Winthrop High School (math 52% / reading 72%, grade B-, #121 of 343 statewide, top 36%, 594 students, 0% FRL) — zoned schools average 0% FRL vs 28% district-wide (28 pts lower); this property's tenant base skews higher-income than the district average.
- Market conditions: Rents rising fast (+13.3%/yr); 58 active listings in the ZIP; 3 comparable units currently listed for rent nearby; rentals at typical pace (median 23d on market — plan ~3-4 weeks tenant-placement turnaround); high-income renter base; 2,207 units permitted in Suffolk County in 2024 (1,961 in 5+ unit buildings).
- At $14,760/mo this rent would consume 152% of the median local household income ($116k/yr) (locally 862% of renters already pay >50% of income on rent) — very limited rent-growth headroom before tenants either downsize or default.
Forward outlook
- Local home prices are declining (-3.0%/yr); year-one equity from $8k of loan paydown is wiped out by about $33k of value loss. Plan a longer hold.
- Suffolk County population projected at +37% by 2050 — long-run rental-demand tailwind backs the buy-and-hold thesis.
- At projected returns (-3.0% appreciation + 8.0% rent growth), your $308k cash investment doubles in ~6 years — after that, you're playing with house money.
Negotiation context
- Only 7 days on market — expect competitive offers; lowballing is unlikely to land.
Risks & watch-outs
- Watch-outs: flood insurance adds $427/mo; built in 1900 — expect roof / HVAC / electrical / plumbing capex.
- Climate carrying-cost: in FEMA flood zone AE (mandatory federal flood insurance); severe wind risk, 80% chance of damaging wind over 30y; extreme-heat days projected 7→15/yr by 2055 (HVAC capex compounding) — expect insurance premiums to compound above CPI over the hold.
Questions for the listing agent
- Can we see the unit-by-unit rent roll, current vacancy, and any below-market leases? What's the average tenancy length?
- What capital expenditures (roof, boiler, parking lot, exteriors) have been made in the last 5 years, and what's planned in the next 2?
- Built in 1900 — when were the roof, HVAC, electrical panel, plumbing, and water heater last replaced?
- What's the actual annual flood-insurance premium (NFIP or private), and is the property in a SFHA with mandatory coverage?
- Is there a deadline driving the sale (1031 exchange, divorce, estate, relocation)? That informs how much negotiation room exists.
- Schools are B-rated — typically a magnet for longer-tenancy family renters. What's the average tenant stay here, and is there a school-zone premium baked into asking?
- What's the average days-on-market for RENTAL listings here right now (not sales)? A rising rental-DOM trend means longer vacancies and softer asking-rent achievability than the comps imply.
- What's the recent tenant-quality profile in this submarket — average credit score on applications, eviction rate, late-payment / NSF rate, and stable-employment percentage? A property-management company in the area should have these aggregated.
- How much new apartment / multifamily construction is in the pipeline within 1–3 miles? Heavy new supply (>2% of stock underway) typically softens rents 12–24 months out; light construction supports rent growth.
Investment metrics
- 1% rule
- 1.34% ✓
- Cap rate
- 11.62%
- Cash-on-cash
- 19.04%
- DSCR
- 1.85
- GRM
- 6.2
CMA / ARV
- ARV (on-the-fly)
- $793,281
- Comps found
- 1
Show comp detail 1 sale within ~0.75 mi
| Address | Dist | Beds/Ba | Sqft | Sold | Price | $/sf | Match |
|---|---|---|---|---|---|---|---|
| 63 Terrace Ave | 0.42mi | 4/3.0 | 3,331 (+13%) | 16mo | $895,000 | $269 | 42 |
Match score weights: distance 35% · size 25% · config 20% · recency 20%. Top-matched comps best support the ARV.
Projected returns pro-forma
-3.0% appreciation · 8.0% rent growth · sell at horizon
- IRR
- 14.1%
- Equity multiple
- 1.60×
- Total profit
- $183,797
- Equity at exit
- $164,014
- IRR
- 26.3%
- Equity multiple
- 3.86×
- Total profit
- $880,754
- Equity at exit
- $95,108
Cash invested: $308,000 (down + closing). Projections, not guarantees.
Landlord ↔ Tenant lean methodology
- Overall (STATE)
- 20 Strongly Tenant-Friendly
- State Massachusetts
- 20 Strongly Tenant-Friendly · D+15
- County
- — inherits STATE
- City
- — inherits STATE
ZIP-level market 02152
- Home prices YoY
- -18.7%
- Rents YoY
- 13.3%
- Active inventory
- 58
- Price-to-rent
- 24.8×
Monthly cashflow live
- Estimated rent
- $14,760 medium interval (Pro) →
- Mortgage (P&I)
- −$5,769
- Tax from tax record
- −$547 /mo · $6,563/yr
- Insurance
- −$458
- Flood insurance flood zone
- −$427 /mo · $5,118/yr
- HOA
- −$0
- Vacancy / Maint / Mgmt
- −$3,100
- Net cashflow
- $4,460
Break-even live
Sensitivity live
| Price | -10% $5,083 | -5% $4,771 | +0% $4,460 | +5% $4,149 | +10% $3,837 |
|---|---|---|---|---|---|
| Rent | -10% $3,294 | -5% $3,877 | +0% $4,460 | +5% $5,043 | +10% $5,626 |
| Rate | -1.0pp $5,014 | -0.5pp $4,740 | base $4,460 | +0.5pp $4,175 | +1.0pp $3,885 |
4-unit breakdown (identical units grouped — click to expand)
| Units | Beds | Baths | Est. rent |
|---|---|---|---|
| 4× units | 5 | 4 | $14,760 |
| #1 | 5 | 4 | $3,690 |
| #2 | 5 | 4 | $3,690 |
| #3 | 5 | 4 | $3,690 |
| #4 | 5 | 4 | $3,690 |
| Total (4 units) | $14,760 | ||
UW: 25.0% down · 7.5% · 30yr · 1.5% tax · 5.0% vac · 8.0% maint · 8.0% mgmt
Financing live
Cash to close
- Down payment
- $275,000
- Closing costs
- $33,000
- Reserves months
- —
- Total cash needed
- —
Loan-product check · same deal, 3 products live
Conventional
25% down · 7.5% · 30yr
- Down + closing
- —
- Monthly P&I
- —
- Monthly cashflow
- —
- DSCR
- —
- Eligible?
- —
Personal DTI + credit; lowest rate.
DSCR
20% down · 8.5% · 30yr
- Down + closing
- —
- Monthly P&I
- —
- Monthly cashflow
- —
- DSCR
- —
- Eligible?
- —
No personal income docs; deal must DSCR.
Hard money
10% down · 12.0% · 12mo
- Down + closing
- —
- Monthly P&I
- —
- Monthly cashflow
- —
- DSCR
- —
- Eligible?
- —
Short-term bridge; refi at stabilization.
Rent comps 3 comps
| Address | Beds | Baths | Sqft | Rent | $/sqft | DOM | Units | Dist |
|---|---|---|---|---|---|---|---|---|
| 141 Grovers Ave Unit 141 Winthrop, MA | 3.0 | 3.0 | 2400 | $5,500 | $2.29 | 25d | 1 | 0.93mi |
| 103 Summer St Revere, MA | 4.0 | 3.5 | 4000 | $12,500 | $3.12 | 22d | 1 | 1.47mi |
| 285 Crescent Ave Unit 2 Revere, MA | 3.0 | 2.0 | 2400 | $3,700 | $1.54 | 15d | 1 | 1.49mi |
Listing history 7 events
-
2026-06-18days on market $1,100,000 Active 7 DOM
-
2026-06-17days on market $1,100,000 Active 6 DOM
-
2026-06-16days on market $1,100,000 Active 5 DOM
-
2026-06-15statusdays on market $1,100,000 Active 4 DOM
-
2026-06-13days on market $1,100,000 New 2 DOM
-
2026-06-13remarks 692-char remark
-
2026-06-13$1,100,000 New 1 DOM
ⓘ Source: listings_history table (triggers on properties + properties_extension) + one-shot
backfill from property_details.listing_events for pre-trigger history.
Tax reassessment forecast MA · Partial reset (capped growth)
- Current annual tax
- $6,563 · $547/mo
- Projected year-2 tax
- $10,046 · $837/mo
- Expected delta
- +$3,484/yr (+$290/mo · 53.1%)
ⓘ Screening estimate from a state-policy table — verify with the county assessor before closing.
Climate risk First Street
- Flood 7/10 Severe FEMA zone AE · 95% chance over 30 yrs
- Wildfire 1/10 Low
- Heat 6/10 Major 7 d/yr ≥96°F today · 15 d/yr by 30 yrs out
- Wind 8/10 Severe 80% chance of damaging wind over 30 yrs
- Air quality 3/10 Moderate 3 unhealthy d/yr today · 3 by 30 yrs out
Nearby sold comps map
Loading sold comps map…
Walkable amenities ~0.75 mi
Loading nearby amenities…
Taxation est. · year 1
- Rental income
- $177,120
- − Mortgage interest
- −$61,617
- − Property taxes
- −$6,563
- − Insurance
- −$10,618
- − Repairs & maintenance
- −$14,170
- − Management
- −$14,170
- − Depreciation
- −$32,000
- Taxable income
- $37,982
- Est. tax owed @ 24.0%
- −$9,116
- After-tax cash flow
- $44,405/yr
For passive investors: Depreciation is non-cash, so a rental often shows a tax loss while cash-flowing — sheltering income. Rental losses are passive: they offset passive income freely, and up to $25,000/yr can offset ordinary (W-2) income if you actively participate and your MAGI is under $100k (phasing out to $0 by $150k); unused losses carry forward. On sale, claimed depreciation is recaptured at up to 25%, and gains may owe capital-gains tax (a 1031 exchange can defer both). Figures are a year-1 estimate at your 24.0% rate — not tax advice; consult a CPA.
Schools (NCES district)
- District
- Winthrop
- NCES district ID
- 2513170
- Math proficiency
- 30% ▼ -23.00%
- Reading proficiency
- 49% ▼ -9.00%
- Median HH income
- $63,859
- Composite
- 35.33/100
- National rank
- #4960
- State rank
- #200 of 302 in MA
Livability — Winthrop Town
- Score
- 75/100
- State rank
- #72
- US rank
- #3946
Category grades
Schools grade is shown separately in the Schools card above.
Census & demographics
- Census place
- Winthrop Town, MA
- County
- Suffolk County · 777,335 people
- City population
- 18,807
- Metro
- Boston-Cambridge-Newton, MA-NH
- Population (ZIP)
- 18,759
- Household income
- $116,167
- Rent vs Own
- Severe rent burden
- 862.0
Population outlook (Suffolk County) Hauer SSP2
- Today (2025)
- 915,464 people
- By 2030
- 983,798 · +7.5%
- By 2040
- 1,119,602 · +22.3%
- By 2050
- 1,255,187 · +37.1%
- By 2075
- 1,534,434 · +67.6%
- By 2100
- 1,748,505 · +91.0%
Race, ethnicity, and origin ACS 2023
- Neighborhood character
- Predominantly White (71%)
- Race & ethnicity
- White 71% Hispanic / Latino 20% Two or more races 7% Black 3% Native American 2% Asian 2%
- Hispanic origin (detail)
- Puerto Rican 2% Cuban 3%
- Common ancestry
- Romanian 3% Russian 2% Lithuanian 1%
- Foreign-born
- 19% · Canada, Jamaica, China
- Languages at home
- 70% English-only · Spanish 18% Other Indo-European 5% Arabic 3%
Political lean MEDSL · Suffolk
- 2024 margin
- Solid D (+52.5) · D 74.8% · R 22.4% · Other 2.8%
- 2008→2024 swing
- -3.2pp toward R · 2008: 55.7pp · 2024: 52.5pp
- All cycles
- 2024: D+52.5 2020: D+63.2 2016: D+63.0 2012: D+56.7 2008: D+55.7
Not yet ingested
- Civics
- —
Market trends
- HPI YoY
- ▼ -79.09%
- Current HPI
- 344.6568
- Rent YoY
- ▲ 13.35%
- Metro
- Boston-Cambridge-Newton, MA-NH
- State GDP YoY
- ▲ 2.28%
- F500 in state
- 38
Industry mix (Fortune 500 HQ in MA)
| Industry | F500 HQs | Revenue |
|---|---|---|
| Technology | 3 | $17B |
|
||
| Insurance | 2 | $84B |
|
||
| Retail | 2 | $76B |
|
||
| Life Sciences | 1 | $43B |
|
||
| Energy Technology | 1 | $31B |
|
||
| Aerospace / Defense | 1 | $18B |
|
||
Price history
1 event — show timeline
- 2026-06-11 Listed $1,100,000 MLS PIN
Property tax history
+2.7%/yrLatest (2023): $6,563 · +3.8% YoY. Source: county tax records.
Cash-flow waterfall
monthlySold comps — $/sqft
last 12 mo · ≤1 miLoading sold comps…