107 Road 5580 · Crouch Mesa, NM
Flood risk No data
- FEMA flood zone
- —
- Chance of flooding over 30 yrs
- %
- Est. flood insurance / yr
- —
Fire risk No data
- Est. fire insurance / yr
- —
Heat risk No data
- Hot days now (above °F)
- days/yr
- Hot days in 30 yrs
- days/yr
Wind risk No data
- Chance of severe wind over 30 yrs
- %
Air-quality risk No data
- Unhealthy air days now
- days/yr
- Unhealthy air days in 30 yrs
- days/yr
Risk factors via First Street. Map © Google.
Why this score? — see what drove the B- grade
The composite is a weighted blend of 9 inputs, each scored 0–100. Each bar is that input's sub-score; the figure is the points it added to the 100-point composite (weight × sub-score).
- Cash flow +30.0/30.0
- 1% rule +10.0/10.0
- DSCR +10.0/10.0
- ARV discount +7.5/15.0
- Rent growth +3.8/5.0
- Schools +3.2/10.0
- Livability +2.5/5.0
- Condition / age +2.5/5.0
- Appreciation +0.0/10.0
$89,000
🖨 Deal sheet 📄 Offer letter ✓ Due diligence
Listing remarks
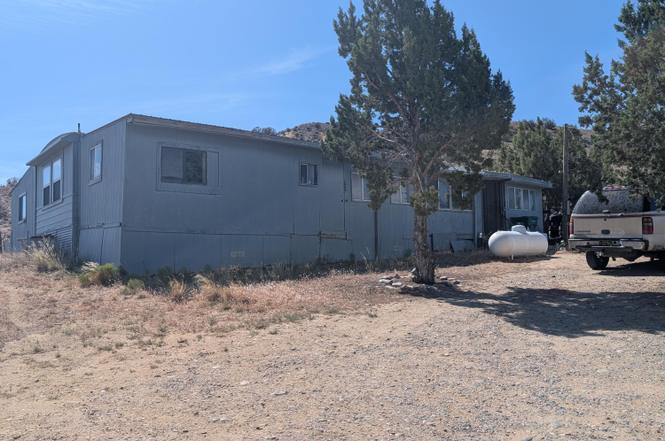
This home is in an Estate and is a 1977 14X70 Marlett with 2 additions, 60X10 plus 12X40 which makes it quite large. A total of 2060 sq. ft. with 2 acres, which borders BLM property and is located at the end of Road 5580. It features 3 BR's, 2.5 baths, one bath is non functional, a large 24X26 steel shed, plus a 16X16 shed, RV hook up, tons of tires as seller would use as a paint ball arena. Most of it is fenced, This home needs lots of TLC, for $89,000 is a great investment for someone. No showings until Monday 6-22-26
Key facts
- Fenced
- Large steel shed
- Rv hook up
Tags
Neighborhood map
What this means for you Summary
Snapshot
- This is a 3-bed/2.5-bath manufactured listed at $89k.
Deal economics
- At list price, monthly cash flow is $645 ($8k/yr) — positive.
- The deal already cash-flows at list — no discount required.
- Meets the 1% rule at list price ($2k rent vs $89k).
Location & tenants
- Location reads: area grade B — affects rentability + tenant quality, not the cash-flow math above.
- Farmington Municipal Schools (urban): math 23% / reading 43% proficiency, ranked #23 of 95 in NM (top 24%) — families likely to look elsewhere, expect single-tenant / working-renter base with shorter leases.
- Market conditions: Rents rising fast (+5.1%/yr); 238 active listings in the ZIP; 78 units permitted in San Juan County in 2024 (8 in 5+ unit buildings).
- This rent runs 31% of the median local income ($62k/yr) — at the standard rent-burdened threshold; future hikes will face affordability resistance.
Forward outlook
- Local home prices are declining (-3.0%/yr); year-one equity from $615 of loan paydown is wiped out by about $3k of value loss. Plan a longer hold.
- San Juan County population projected at -51% by 2050 — secular population decline; favor cash flow + early exit over multi-decade hold.
- At projected returns (-3.0% appreciation + 5.1% rent growth), your $25k cash investment doubles in ~4 years — after that, you're playing with house money.
Negotiation context
- Only 1 days on market — expect competitive offers; lowballing is unlikely to land.
Questions for the listing agent
- Built in 1977 — when were the roof, HVAC, electrical panel, plumbing, and water heater last replaced?
- Is there a deadline driving the sale (1031 exchange, divorce, estate, relocation)? That informs how much negotiation room exists.
- What's the average days-on-market for RENTAL listings here right now (not sales)? A rising rental-DOM trend means longer vacancies and softer asking-rent achievability than the comps imply.
- What's the recent tenant-quality profile in this submarket — average credit score on applications, eviction rate, late-payment / NSF rate, and stable-employment percentage? A property-management company in the area should have these aggregated.
- How much new for-sale + rental construction is in the pipeline within 1–3 miles? Heavy new supply typically softens prices + rents 12–24 months out; constrained supply supports both.
Investment metrics
- 1% rule
- 1.79% ✓
- Cap rate
- 14.99%
- Cash-on-cash
- 31.08%
- DSCR
- 2.38
- GRM
- 4.6
CMA / ARV
No comps found within radius.
Projected returns pro-forma
-3.0% appreciation · 5.08% rent growth · sell at horizon
- IRR
- 28.2%
- Equity multiple
- 2.21×
- Total profit
- $30,113
- Equity at exit
- $13,270
- IRR
- 36.9%
- Equity multiple
- 4.77×
- Total profit
- $93,839
- Equity at exit
- $7,695
Cash invested: $24,920 (down + closing). Projections, not guarantees.
Landlord ↔ Tenant lean methodology
- Overall (STATE)
- 55 Moderately Landlord-Leaning
- State New Mexico
- 55 Moderately Landlord-Leaning · D+3
- County
- — inherits STATE
- City
- — inherits STATE
ZIP-level market 87401
- Rents YoY
- 5.1%
- Active inventory
- 238
- Price-to-rent
- 4.6×
Monthly cashflow live
- Estimated rent
- $1,595 medium interval (Pro) →
- Mortgage (P&I)
- −$467
- Tax est. 1.5%
- −$111 /mo · $1,335/yr
- Insurance
- −$37
- HOA
- −$0
- Vacancy / Maint / Mgmt
- −$335
- Net cashflow
- $645
Break-even live
UW: 25.0% down · 7.5% · 30yr · 1.5% tax · 5.0% vac · 8.0% maint · 8.0% mgmt
Financing live
Cash to close
- Down payment
- $22,250
- Closing costs
- $2,670
- Reserves months
- —
- Total cash needed
- —
Loan-product check · same deal, 3 products live
Conventional
25% down · 7.5% · 30yr
- Down + closing
- —
- Monthly P&I
- —
- Monthly cashflow
- —
- DSCR
- —
- Eligible?
- —
Personal DTI + credit; lowest rate.
DSCR
20% down · 8.5% · 30yr
- Down + closing
- —
- Monthly P&I
- —
- Monthly cashflow
- —
- DSCR
- —
- Eligible?
- —
No personal income docs; deal must DSCR.
Hard money
10% down · 12.0% · 12mo
- Down + closing
- —
- Monthly P&I
- —
- Monthly cashflow
- —
- DSCR
- —
- Eligible?
- —
Short-term bridge; refi at stabilization.
Listing history 2 events
-
2026-06-19remarks 527-char remark
-
2026-06-19$89,000 Active 1 DOM
ⓘ Source: listings_history table (triggers on properties + properties_extension) + one-shot
backfill from property_details.listing_events for pre-trigger history.
Nearby sold comps map
Loading sold comps map…
Walkable amenities ~0.75 mi
Loading nearby amenities…
Taxation est. · year 1
- Rental income
- $19,145
- − Mortgage interest
- −$4,985
- − Property taxes
- −$1,335
- − Insurance
- −$445
- − Repairs & maintenance
- −$1,532
- − Management
- −$1,532
- − Depreciation
- −$2,589
- Taxable income
- $6,728
- Est. tax owed @ 24.0%
- −$1,615
- After-tax cash flow
- $6,130/yr
For passive investors: Depreciation is non-cash, so a rental often shows a tax loss while cash-flowing — sheltering income. Rental losses are passive: they offset passive income freely, and up to $25,000/yr can offset ordinary (W-2) income if you actively participate and your MAGI is under $100k (phasing out to $0 by $150k); unused losses carry forward. On sale, claimed depreciation is recaptured at up to 25%, and gains may owe capital-gains tax (a 1031 exchange can defer both). Figures are a year-1 estimate at your 24.0% rate — not tax advice; consult a CPA.
Schools (NCES district)
- District
- Farmington Municipal Schools
- NCES district ID
- 3500990
- Math proficiency
- 23% —
- Reading proficiency
- 43% —
- Median HH income
- $51,365
- Composite
- 31.5/100
- National rank
- #11178
- State rank
- #23 of 95 in NM
Livability — Crouch Mesa
No livability data for this city. (Only ~50 U.S. cities are tracked.)
Census & demographics
- Census place
- Crouch Mesa, NM
- County
- San Juan County · 45,229 people
- Metro
- Farmington, NM
- Population (ZIP)
- 45,229
- Household income
- $61,886
- Rent vs Own
- Severe rent burden
- 1190.0
Population outlook (San Juan County) Hauer SSP2
- Today (2025)
- 95,201 people
- By 2030
- 84,154 · -11.6%
- By 2040
- 63,810 · -33.0%
- By 2050
- 46,929 · -50.7%
- By 2075
- 21,097 · -77.8%
- By 2100
- 9,410 · -90.1%
Race, ethnicity, and origin ACS 2023
- Neighborhood character
- Highly diverse neighborhood (Simpson 0.80)
- Race & ethnicity
- White 38% Native American 32% Hispanic / Latino 24% Two or more races 12% Asian 1%
- Hispanic origin (detail)
- Mexican 14%
- Common ancestry
- Lithuanian 2% Slovak 2% Italian 2%
- Foreign-born
- 4% · Canada
- Languages at home
- 72% English-only · Spanish 13%
Political lean MEDSL · San Juan
- 2024 margin
- Solid R (+31.7) · D 33.0% · R 64.7% · Other 2.3%
- 2008→2024 swing
- -10.6pp toward R · 2008: -21.2pp · 2024: -31.7pp
- All cycles
- 2024: R+31.7 2020: R+28.3 2016: R+33.1 2012: R+28.5 2008: R+21.2
Not yet ingested
- Civics
- —
Market trends
- HPI YoY
- ▼ -224.62%
- Current HPI
- 170.162
- Rent YoY
- ▲ 5.08%
- Metro
- Farmington, NM
- State GDP YoY
- —
- F500 in state
- 0
Cash-flow waterfall
monthlySold comps — $/sqft
last 12 mo · ≤1 miLoading sold comps…