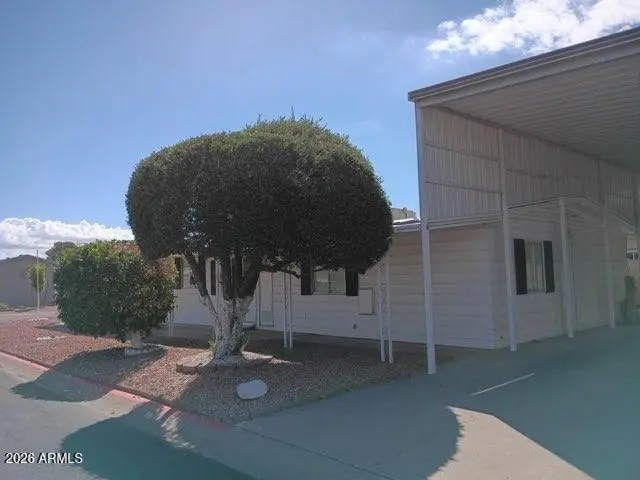
16246 N 33rd St · Phoenix, AZ
Flood risk 1/10 · Minimal
- FEMA flood zone
- X (shaded)
- Chance of flooding over 30 yrs
- 0.0%
- Est. flood insurance / yr
- $507 – $1,088
Fire risk 1/10 · Minimal
- Est. fire insurance / yr
- $610 – $1,132
Heat risk 8/10 · Major
- Hot days now (above 111°F)
- 6 days/yr
- Hot days in 30 yrs
- 15 days/yr
Wind risk 1/10 · Minimal
- Chance of severe wind over 30 yrs
- —
Air-quality risk 3/10 · Minor
- Unhealthy air days now
- 2 days/yr
- Unhealthy air days in 30 yrs
- 3 days/yr
Risk factors via First Street. Map © Google.
Why this score? — see what drove the D+ grade
The composite is a weighted blend of 9 inputs, each scored 0–100. Each bar is that input's sub-score; the figure is the points it added to the 100-point composite (weight × sub-score).
- ARV discount +15.0/15.0
- Cash flow +14.7/30.0
- DSCR +4.5/10.0
- Schools +3.8/10.0
- Livability +3.8/5.0
- 1% rule +3.4/10.0
- Condition / age +2.5/5.0
- Rent growth +2.1/5.0
- Appreciation +0.0/10.0
$195,000
🖨 Deal sheet (PDF) 📄 Offer letter ✓ Due diligence
Listing remarks MLS
Great Value Property located within Palm Lakes Village a 55-Plus retirement community. Easy parking for 4 cars or RV. Covered parking area has high roof to fit large RV. Covered Patio's on the North and the South side of home. Must see. Great home for the price. Two blocks from the clubhouse. Two Bedrooms.
Key facts
- 6,361 sq ft lot
- 8 parking spots
- Community pool
Neighborhood map
What this means for you Summary
Snapshot
- This is a 2-bed/2.0-bath manufactured listed at $195k.
Deal economics
- At list price, monthly cash flow is $51 ($608/yr) — positive.
- The deal already cash-flows at list — no discount required.
- To meet the 1% rule (rent ≥ 1% of price), the offer needs to be $164k (15.7% below list).
- Recommended offer: $164k (15.7% below list) — sets the bar for 1% rule.
- Cap rate 6.6% vs local median 3.3% in Phoenix — top-decile yield for the area; either an underpriced asset or a hidden risk that comps aren't pricing in. Stress-test before assuming the spread holds.
Location & tenants
- Location reads 75/100 on livability (#16 in AZ, #3,924 nationally) — a middle-class / working-renter tenant base. Strengths: amenities A+, commute A+, housing A+; Watch: health & safety C-, crime F.
- Paradise Valley Unified District (4241) (urban): math 39% / reading 46% proficiency, ranked #56 of 249 in AZ (top 22%) — families likely to look elsewhere, expect single-tenant / working-renter base with shorter leases.
- Market conditions: Rents soft (-1.5%/yr); 341 active listings in the ZIP; 40 comparable units currently listed for rent nearby; rentals at typical pace (median 23d on market — plan ~3-4 weeks tenant-placement turnaround); solid renter incomes; 36,011 units permitted in Maricopa County in 2024 (12,801 in 5+ unit buildings).
Forward outlook
- Local home prices are declining (-3.0%/yr); year-one equity from $1k of loan paydown is wiped out by about $6k of value loss. Plan a longer hold.
- Maricopa County population projected at +38% by 2050 — long-run rental-demand tailwind backs the buy-and-hold thesis.
Negotiation context
- It's been on market 116 days — a 9% lower offer ($177k) is reasonable based on typical stale-listing flexibility.
- 3 sale attempts since 2y ago; this cycle's ask has dropped $130k (40%) from the opening price — seller is motivated, your offer sets the floor, not the list.
Risks & watch-outs
- Climate carrying-cost: extreme-heat days projected 6→15/yr by 2055 (HVAC capex compounding) — expect insurance premiums to compound above CPI over the hold.
Questions for the listing agent
- It's been on market 116 days. Have you received any prior offers? Is the seller open to a 16% concession, seller financing, or rate buy-down credit?
- What does the HOA fee cover, when was the last increase, and are there any pending special assessments or reserve-fund shortfalls?
- Why hasn't it sold? Are there any deal-killer items the seller is aware of (foundation, flood, title, zoning, code violations)?
- Is there a deadline driving the sale (1031 exchange, divorce, estate, relocation)? That informs how much negotiation room exists.
- Crime grade is F in this area — have there been break-ins, vandalism, or insurance claims at this property in the last 3 years? What carrier currently insures it and at what premium?
- The area grade is low — what's the realistic commute time and amenity access for the typical tenant pool here? Any planned neighborhood developments (good or bad) we should know about?
- What's the average days-on-market for RENTAL listings here right now (not sales)? A rising rental-DOM trend means longer vacancies and softer asking-rent achievability than the comps imply.
- What's the recent tenant-quality profile in this submarket — average credit score on applications, eviction rate, late-payment / NSF rate, and stable-employment percentage? A property-management company in the area should have these aggregated.
- How much new for-sale + rental construction is in the pipeline within 1–3 miles? Heavy new supply typically softens prices + rents 12–24 months out; constrained supply supports both.
Investment metrics
- 1% rule
- 0.84% ✗
- Cap rate
- 6.60%
- Cash-on-cash
- 1.11%
- DSCR
- 1.05
- GRM
- 9.9
CMA / ARV
- ARV (median comp)
- $244,284
- List price
- $195,000
- Delta
- -20.17%
- Verdict
- UNDERPRICED
- Comps
- 20 within 1.0 mi
Show comp detail 12 sales within ~0.75 mi
| Address | Dist | Beds/Ba | Sqft | Sold | Price | $/sf | Match |
|---|---|---|---|---|---|---|---|
| 16230 N 33rd St | 0.03mi | 3/2.0 (+1) | 1,440 (0%) | 1mo | $252,500 | $175 | 93 |
| 16210 N 32nd Way | 0.09mi | 3/2.0 (+1) | 1,440 (0%) | 3mo | $225,000 | $156 | 88 |
| 16440 N 35th St | 0.26mi | 2/2.0 | 1,426 (-1%) | 1mo | $193,000 | $135 | 86 |
| 16230 N 35th Way | 0.34mi | 2/2.0 | 1,441 (+0%) | 4mo | $200,000 | $139 | 81 |
| 3449 E Kings Ave | 0.26mi | 3/2.0 (+1) | 1,418 (-2%) | 5mo | $227,000 | $160 | 77 |
| 16215 N 33rd St | 0.07mi | 2/2.0 | 1,296 (-10%) | 6mo | $265,000 | $204 | 75 |
| 16443 N 33rd Way | 0.17mi | 3/2.0 (+1) | 1,568 (+9%) | 4mo | $375,000 | $239 | 69 |
| 16208 N 35th Pl | 0.30mi | 3/2.0 (+1) | 1,537 (+7%) | 2mo | $211,500 | $138 | 68 |
| 16225 N 29th St #43 | 0.47mi | 3/2.0 (+1) | 1,392 (-3%) | 3mo | $80,000 | $57 | 65 |
| 16229 N 35th Pl | 0.32mi | 3/2.0 (+1) | 1,593 (+11%) | 6mo | $339,900 | $213 | 57 |
| 16225 N 29th St #59 | 0.44mi | 2/2.0 | 1,248 (-13%) | 4mo | $55,000 | $44 | 54 |
| 2729 E Juniper Ave | 0.71mi | 3/2.0 (+1) | 1,320 (-8%) | 7mo | $175,000 | $133 | 42 |
Match score weights: distance 35% · size 25% · config 20% · recency 20%. Top-matched comps best support the ARV.
Projected returns pro-forma
-3.0% appreciation · 0.0% rent growth · sell at horizon
- IRR
- -17.7%
- Equity multiple
- 0.39×
- Total profit
- $-33,228
- Equity at exit
- $29,075
- IRR
- -16.4%
- Equity multiple
- 0.20×
- Total profit
- $-43,552
- Equity at exit
- $16,860
Cash invested: $54,600 (down + closing). Projections, not guarantees.
Landlord ↔ Tenant lean methodology
- Overall (STATE)
- 87 Strongly Landlord-Friendly
- State Arizona
- 87 Strongly Landlord-Friendly · R+3
- County
- — inherits STATE
- City
- — inherits STATE
ZIP-level market 85032
- Rents YoY
- -1.5%
- Active inventory
- 341
- Price-to-rent
- 9.9×
Monthly cashflow live
- Estimated rent
- $1,645 high interval (Pro) →
- Mortgage (P&I)
- −$1,023
- Tax from tax record
- −$55 /mo · $656/yr
- Insurance
- −$81
- HOA
- −$90
- Vacancy / Maint / Mgmt
- −$345
- Net cashflow
- $51
Break-even live
Sensitivity live
| Price | -10% $161 | -5% $106 | +0% $51 | +5% $-5 | +10% $-60 |
|---|---|---|---|---|---|
| Rent | -10% $-79 | -5% $-14 | +0% $51 | +5% $116 | +10% $181 |
| Rate | -1.0pp $149 | -0.5pp $100 | base $51 | +0.5pp $0 | +1.0pp $-51 |
UW: 25.0% down · 7.5% · 30yr · 1.5% tax · 5.0% vac · 8.0% maint · 8.0% mgmt
Financing live
Cash to close
- Down payment
- $48,750
- Closing costs
- $5,850
- Reserves months
- —
- Total cash needed
- —
Loan-product check · same deal, 3 products live
Conventional
25% down · 7.5% · 30yr
- Down + closing
- —
- Monthly P&I
- —
- Monthly cashflow
- —
- DSCR
- —
- Eligible?
- —
Personal DTI + credit; lowest rate.
DSCR
20% down · 8.5% · 30yr
- Down + closing
- —
- Monthly P&I
- —
- Monthly cashflow
- —
- DSCR
- —
- Eligible?
- —
No personal income docs; deal must DSCR.
Hard money
10% down · 12.0% · 12mo
- Down + closing
- —
- Monthly P&I
- —
- Monthly cashflow
- —
- DSCR
- —
- Eligible?
- —
Short-term bridge; refi at stabilization.
Rent comps 40 comps
| Address | Beds | Baths | Sqft | Rent | $/sqft | DOM | Units | Dist |
|---|---|---|---|---|---|---|---|---|
| 3316 E Tierra Buena Ln Phoenix, AZ | 3.0 | 2.5 | 1621 | $2,495 | $1.54 | 19d | 1 | 0.30mi |
| 3027 E Grandview Rd Unit 3027-B Phoenix, AZ | 2.0 | 1.0 | 912 | $1,375 | $1.51 | 9d | 1 | 0.33mi |
| 16225 N 30th St #9 Phoenix, AZ | 2.0 | 1.5 | 968 | $1,350 | $1.39 | 25d | 1 | 0.35mi |
| 16402 N 31st St #119 Phoenix, AZ | 2.0 | 2.0 | 933 | $1,375 | $1.47 | 5d | 1 | 0.36mi |
| 16402 N 31st St #119 Phoenix, AZ | 2.0 | 2.0 | 933 | $1,375 | $1.47 | 19d | 1 | 0.36mi |
| 16015 N 30th St #123 Phoenix, AZ | 3.0 | 2.5 | 1426 | $1,950 | $1.37 | 23d | 1 | 0.36mi |
| 16021 N 30th St #119 Phoenix, AZ | 3.0 | 2.5 | 1426 | $1,950 | $1.37 | 25d | 1 | 0.39mi |
| 3003 E Kings Ave Phoenix, AZ | 3.0 | 2.0 | 1445 | $2,800 | $1.94 | 6d | 1 | 0.40mi |
| 15606 N 33rd Pl Phoenix, AZ | 3.0 | 2.0 | 1373 | $2,225 | $1.62 | 25d | 1 | 0.43mi |
| 3420 E Bell Rd Phoenix, AZ | 2.0 | 1.0–2.0 | 863 | $2,214 | $2.56 | 0d | 22 | 0.45mi |
| 3113 E Danbury Rd #22 Phoenix, AZ | 3.0 | 2.0 | 1353 | $5,000 | $3.70 | 25d | 1 | 0.50mi |
| 13440 N 44th St Unit 2 Phoenix, AZ | 2.0 | 2.0 | 1102 | $1,748 | $1.59 | 11d | 1 | 0.52mi |
| 15434 N 32nd St Phoenix, AZ | 1.0–2.0 | 1.0–2.0 | 835 | $1,255 | $1.50 | 0d | 8 | 0.53mi |
| 15801 N 29th St #1 Phoenix, AZ | 2.0 | 2.0 | 1108 | $1,650 | $1.49 | 23d | 1 | 0.54mi |
| 15626 N 29th Way Phoenix, AZ | 3.0 | 2.5 | 1271 | $2,150 | $1.69 | 25d | 1 | 0.57mi |
| 2844 E Marconi Ave Unit 101 Phoenix, AZ | 3.0 | 3.0 | 1123 | $1,550 | $1.38 | 23d | 1 | 0.58mi |
| 2827 E Le Marche Ave Unit 103 Phoenix, AZ | 3.0 | 3.0 | 1200 | $1,800 | $1.50 | 12d | 1 | 0.59mi |
| 2827 E Le Marche Ave Unit 203 Phoenix, AZ | 2.0 | 2.0 | 1200 | $1,450 | $1.21 | 4d | 1 | 0.59mi |
| 15601 N 30th St Unit 5 Phoenix, AZ | 2.0 | 2.0 | 950 | $1,375 | $1.45 | 16d | 1 | 0.60mi |
| 2846 E Kathleen Rd Unit 103 Phoenix, AZ | 2.0 | 1.5 | 1106 | $949 | $0.86 | 25d | 1 | 0.60mi |
| 2846 E Kathleen Rd Phoenix, AZ | 2.0 | 2.0 | 1106 | $949 | $0.86 | 25d | 1 | 0.60mi |
| 2854 E Phelps Rd Phoenix, AZ | 3.0 | 2.0 | 1488 | $1,811 | $1.22 | 23d | 1 | 0.60mi |
| 2826 E Monte Cristo Ave Phoenix, AZ | 2.0 | 2.0 | 929 | $1,295 | $1.39 | 16d | 1 | 0.60mi |
| 2826 E Monte Cristo Ave Unit 203 Phoenix, AZ | 2.0 | 2.0 | 929 | $1,295 | $1.39 | 18d | 1 | 0.60mi |
| 2837 E Marconi Ave Unit 203 Phoenix, AZ | 2.0 | 1.0 | 900 | $975 | $1.08 | 25d | 1 | 0.60mi |
| 2807 E Paradise Ln Unit 103 Phoenix, AZ | 3.0 | 3.0 | 1124 | $1,475 | $1.31 | 25d | 1 | 0.63mi |
| 2807 E Le Marche Ave Unit 103 Phoenix, AZ | 3.0 | 3.0 | 1157 | $1,099 | $0.95 | 25d | 1 | 0.65mi |
| 2807 E Le Marche Ave Unit 103 Phoenix, AZ | 3.0 | 3.0 | 1157 | $1,074 | $0.93 | 16d | 1 | 0.65mi |
| 15636 N 29th St #1 Phoenix, AZ | 3.0 | 2.5 | 1698 | $2,399 | $1.41 | 19d | 1 | 0.65mi |
| 2807 E Monte Cristo Ave Unit 102 Phoenix, AZ | 2.0 | 2.0 | 900 | $865 | $0.96 | 25d | 1 | 0.65mi |
| 2821 E Kathleen Rd Unit 101 Phoenix, AZ | 2.0 | 1.5 | 1106 | $900 | $0.81 | 25d | 1 | 0.66mi |
| 2821 E Kathleen Rd Phoenix, AZ | 2.0 | 2.0 | 1106 | $900 | $0.81 | 25d | 1 | 0.66mi |
| 2802 E Monte Cristo Ave Unit 102 Phoenix, AZ | 1.0 | 1.0 | 929 | $950 | $1.02 | 25d | 1 | 0.66mi |
| 2819 E Marconi Ave Unit 201 Phoenix, AZ | 2.0 | 2.0 | 900 | $950 | $1.06 | 25d | 1 | 0.66mi |
| 2807 E Marconi Ave Unit 101 Phoenix, AZ | 2.0 | 2.0 | 967 | $975 | $1.01 | 0d | 1 | 0.67mi |
| 2834 E Tracy Ln #1 Phoenix, AZ | 2.0 | 2.5 | 1254 | $1,550 | $1.24 | 25d | 1 | 0.68mi |
| 3316 E Helena Dr Phoenix, AZ | 3.0 | 2.0 | 1176 | $2,000 | $1.70 | 25d | 1 | 0.72mi |
| 2713 E Juniper Ave Phoenix, AZ | 3.0 | 3.5 | 1612 | $1,799 | $1.12 | 9d | 1 | 0.77mi |
| 2713 E Juniper Ave Phoenix, AZ | 3.0 | 2.0 | 1612 | $1,799 | $1.12 | 15d | 1 | 0.77mi |
| 2833 E Beck Ln #4 Phoenix, AZ | 3.0 | 2.0 | 1110 | $1,880 | $1.69 | 0d | 1 | 0.79mi |
HOA detail
- Monthly dues
- $90 · $1,080/yr
Listing history 34 events
-
2026-06-21days on market $195,000 Active 116 DOM
-
2026-06-18days on market $195,000 Active 113 DOM
-
2026-06-17days on market $195,000 Active 112 DOM
-
2026-06-16days on market $195,000 Active 111 DOM
-
2026-06-15days on market $195,000 Active 110 DOM
-
2026-06-13days on market $195,000 Active 108 DOM
-
2026-06-13days on market $195,000 Active 107 DOM
-
2026-06-09days on market $195,000 Active 104 DOM
-
2026-06-08days on market $195,000 Active 103 DOM
-
2026-06-07days on market $195,000 Active 102 DOM
-
2026-06-04days on market $195,000 Active 99 DOM
-
2026-06-03days on market $195,000 Active 98 DOM
-
2026-06-02days on market $195,000 Active 97 DOM
-
2026-06-01days on market $195,000 Active 96 DOM
-
2026-05-31days on market $195,000 Active 95 DOM
-
2026-05-14price $195,000
-
2026-05-03price $200,000
-
2026-04-21price $215,000
-
2026-04-16price $225,000
-
2026-04-13price $250,000
-
2026-04-07price $275,000
-
2026-04-01price $295,000
-
2026-03-18price $310,000
-
2026-02-25$325,000 Active
-
2026-02-25price $325,000
-
2024-04-23soldstatus $280,000
-
2024-04-19soldstatus $275,000 Closed 307-char remark
Show marketing remark (307 chars)
Great Value Property located within Palm Lakes Village a 55-Plus retirement community. Easy parking for 4 cars or RV. Covered parking area has high roof to fit large RV. Covered Patio's on the North and the South side of home. Must see. Great home for the price. Two blocks from the clubhouse. Two Bedrooms.
-
2024-04-16status Pending 307-char remark
Show marketing remark (307 chars)
Great Value Property located within Palm Lakes Village a 55-Plus retirement community. Easy parking for 4 cars or RV. Covered parking area has high roof to fit large RV. Covered Patio's on the North and the South side of home. Must see. Great home for the price. Two blocks from the clubhouse. Two Bedrooms.
-
2024-04-16$275,000 Active 307-char remark
Show marketing remark (307 chars)
Great Value Property located within Palm Lakes Village a 55-Plus retirement community. Easy parking for 4 cars or RV. Covered parking area has high roof to fit large RV. Covered Patio's on the North and the South side of home. Must see. Great home for the price. Two blocks from the clubhouse. Two Bedrooms.
-
2024-04-15soldstatus $275,000 Closed 307-char remark
Show marketing remark (307 chars)
Great Value Property located within Palm Lakes Village a 55-Plus retirement community. Easy parking for 4 cars or RV. Covered parking area has high roof to fit large RV. Covered Patio's on the North and the South side of home. Must see. Great home for the price. Two blocks from the clubhouse. Two Bedrooms.
-
2024-04-15status Pending 307-char remark
Show marketing remark (307 chars)
Great Value Property located within Palm Lakes Village a 55-Plus retirement community. Easy parking for 4 cars or RV. Covered parking area has high roof to fit large RV. Covered Patio's on the North and the South side of home. Must see. Great home for the price. Two blocks from the clubhouse. Two Bedrooms.
-
2024-02-27$275,000 Active 307-char remark
Show marketing remark (307 chars)
Great Value Property located within Palm Lakes Village a 55-Plus retirement community. Easy parking for 4 cars or RV. Covered parking area has high roof to fit large RV. Covered Patio's on the North and the South side of home. Must see. Great home for the price. Two blocks from the clubhouse. Two Bedrooms.
-
1989-06-02soldstatus $52,000
-
1978-11-29soldstatus $38,000
ⓘ Source: listings_history table (triggers on properties + properties_extension) + one-shot
backfill from property_details.listing_events for pre-trigger history.
Tax reassessment forecast AZ · Resets to sale price
- Current annual tax
- $656 · $55/mo
- Projected year-2 tax
- $1,287 · $107/mo
- Expected delta
- +$631/yr (+$53/mo · 96.2%)
ⓘ Screening estimate from a state-policy table — verify with the county assessor before closing.
Climate risk First Street
- Flood 1/10 Low FEMA zone X (shaded) · 0% chance over 30 yrs
- Wildfire 1/10 Low
- Heat 8/10 Severe 6 d/yr ≥111°F today · 15 d/yr by 30 yrs out
- Wind 1/10 Low
- Air quality 3/10 Moderate 2 unhealthy d/yr today · 3 by 30 yrs out
Nearby sold comps map
Loading sold comps map…
Walkable amenities ~0.75 mi
Loading nearby amenities…
Taxation est. · year 1
- Rental income
- $19,734
- − Mortgage interest
- −$10,923
- − Property taxes
- −$656
- − Insurance
- −$975
- − Repairs & maintenance
- −$1,579
- − Management
- −$1,579
- − HOA
- −$1,080
- − Depreciation
- −$5,673
- Taxable loss
- −$2,730
- Est. tax savings @ 24.0%
- +$655
- After-tax cash flow
- $1,263/yr
For passive investors: Depreciation is non-cash, so a rental often shows a tax loss while cash-flowing — sheltering income. Rental losses are passive: they offset passive income freely, and up to $25,000/yr can offset ordinary (W-2) income if you actively participate and your MAGI is under $100k (phasing out to $0 by $150k); unused losses carry forward. On sale, claimed depreciation is recaptured at up to 25%, and gains may owe capital-gains tax (a 1031 exchange can defer both). Figures are a year-1 estimate at your 24.0% rate — not tax advice; consult a CPA.
Schools (NCES district)
- District
- Paradise Valley Unified District (4241)
- NCES district ID
- 0405930
- Math proficiency
- 39% ▼ -11.00%
- Reading proficiency
- 46% ▼ -7.00%
- Median HH income
- $64,106
- Composite
- 37.89/100
- National rank
- #4316
- State rank
- #56 of 249 in AZ
Livability — Phoenix
- Score
- 75/100
- State rank
- #16
- US rank
- #3924
Category grades
Schools grade is shown separately in the Schools card above.
Census & demographics
- Census place
- Phoenix, AZ
- County
- Maricopa County · 4,537,380 people
- City population
- 1,500,198
- Metro
- Phoenix-Mesa-Chandler, AZ
- Population (ZIP)
- 70,839
- Household income
- $78,643
- Rent vs Own
- Severe rent burden
- 2887.0
Population outlook (Maricopa County) Hauer SSP2
- Today (2025)
- 4,979,203 people
- By 2030
- 5,378,229 · +8.0%
- By 2040
- 6,156,598 · +23.6%
- By 2050
- 6,872,376 · +38.0%
- By 2075
- 8,401,270 · +68.7%
- By 2100
- 9,247,439 · +85.7%
Race, ethnicity, and origin ACS 2023
- Neighborhood character
- Diverse neighborhood (Simpson 0.57)
- Race & ethnicity
- White 59% Hispanic / Latino 29% Two or more races 17% Asian 4% Black 3% Native American 2%
- Hispanic origin (detail)
- Mexican 25%
- Common ancestry
- Romanian 2% Slovak 2% Portuguese 2%
- Foreign-born
- 18% · Canada, China
- Languages at home
- 71% English-only · Spanish 21% Russian/Polish/Slavic 2% Other Indo-European 1%
Political lean MEDSL · Maricopa
- 2024 margin
- Toss-up / Even · D 47.7% · R 51.2% · Other 1.1%
- 2008→2024 swing
- +7.1pp toward D · 2008: -10.6pp · 2024: -3.5pp
- All cycles
- 2024: R+3.5 2020: D+2.2 2016: R+3.5 2012: R+12.0 2008: R+10.6
Not yet ingested
- Civics
- —
Market trends
- HPI YoY
- ▼ -488.65%
- Current HPI
- 339.4181
- Rent YoY
- ▼ -1.46%
- Metro
- Phoenix-Mesa-Chandler, AZ
- State GDP YoY
- ▲ 4.54%
- F500 in state
- 20
Industry mix (Fortune 500 HQ in AZ)
| Industry | F500 HQs | Revenue |
|---|---|---|
| Technology | 2 | $13B |
|
||
| Mining / Metals | 1 | $23B |
|
||
| Environmental Services | 1 | $16B |
|
||
| Metals / Steel | 1 | $14B |
|
||
| Technology Distribution | 1 | $9B |
|
||
| Homebuilding | 1 | $8B |
|
||
Price history
+413.2% since first listed19 events — show timeline
- 2026-05-14 Price Changed $195,000 ARMLS
- 2026-05-03 Price Changed $200,000 ARMLS
- 2026-04-21 Price Changed $215,000 ARMLS
- 2026-04-16 Price Changed $225,000 ARMLS
- 2026-04-13 Price Changed $250,000 ARMLS
- 2026-04-07 Price Changed $275,000 ARMLS
- 2026-04-01 Price Changed $295,000 ARMLS
- 2026-03-18 Price Changed $310,000 ARMLS
- 2026-02-25 Listed $325,000 ARMLS
- 2026-02-25 Price Changed $325,000 ARMLS
- 2024-04-23 Sold (Public Records) $280,000 Public Records
- 2024-04-19 Sold (MLS) $275,000 ARMLS
- 2024-04-16 Pending — ARMLS
- 2024-04-16 Listed $275,000 ARMLS
- 2024-04-15 Sold (MLS) $275,000 ARMLS
- 2024-04-15 Pending — ARMLS
- 2024-02-27 Listed $275,000 ARMLS
- 1989-06-02 Sold (Public Records) $52,000 Public Records
- 1978-11-29 Sold (Public Records) $38,000 Public Records
Property tax history
+0.1%/yrLatest (2025): $656 · +2.6% YoY. Source: county tax records.
Cash-flow waterfall
monthlySold comps — $/sqft
last 12 mo · ≤1 miLoading sold comps…