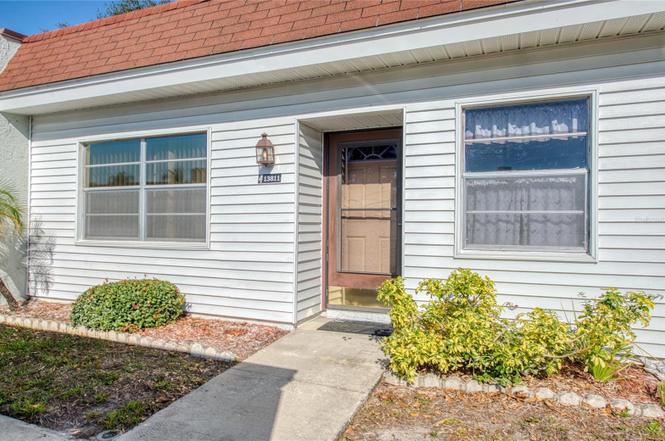
13811 Mission Oaks Blvd Unit E · Indian Shores, FL
Flood risk 1/10 · Minimal
- FEMA flood zone
- X (unshaded)
- Chance of flooding over 30 yrs
- 0.0%
- Est. flood insurance / yr
- $507 – $1,088
Fire risk 1/10 · Minimal
- Est. fire insurance / yr
- $947 – $1,759
Heat risk 10/10 · Severe
- Hot days now (above 107°F)
- 7 days/yr
- Hot days in 30 yrs
- 28 days/yr
Wind risk 10/10 · Severe
- Chance of severe wind over 30 yrs
- 99.0%
Air-quality risk 3/10 · Minor
- Unhealthy air days now
- 2 days/yr
- Unhealthy air days in 30 yrs
- 3 days/yr
Risk factors via First Street. Map © Google.
Why this score? — see what drove the C grade
The composite is a weighted blend of 9 inputs, each scored 0–100. Each bar is that input's sub-score; the figure is the points it added to the 100-point composite (weight × sub-score).
- Cash flow +19.3/30.0
- 1% rule +10.0/10.0
- ARV discount +7.5/15.0
- DSCR +6.1/10.0
- Schools +4.3/10.0
- Livability +3.8/5.0
- Rent growth +2.5/5.0
- Condition / age +2.5/5.0
- Appreciation +0.0/10.0
$90,000
🖨 Deal sheet 📄 Offer letter ✓ Due diligence
Listing remarks
This one-story, two-bedroom, two-bathroom villa is in a sought-after 55+ community of Mission Oaks. There are split bedrooms off the dining/living room combo area. An enclosed lanai to enjoy your morning coffee. This home has an assigned covered parking space steps from your front door, and there's plenty of guest parking. The community includes a clubhouse that offers activities, a pool, laundry facilities, and shuffleboard. This home is also close to shopping, transportation, and beaches.
Key facts
- Laundry facilities
- Clubhouse
- Community pool
Tags
Property features AI
Finance
- Other: Partially furnished
- Financial info: Total annual fees reported as $11,076; Lease restrictions apply
- HOA & community: Has HOA managed by Resource Property Management/Robert Shipman; Monthly condo/association fee of $923; Association approval required; Association amenities include cable TV, pool, shuffleboard court; Association fees cover cable TV, common area taxes, pool, insurance, maintenance (structure and grounds), sewer, trash, and water; Community features include buyer approval required, clubhouse, pool, sidewalks; Senior community; pets not allowed
Exterior
- Parking: Has carport (1 space)
- Utilities: Public water; Public sewer; Cable available; Electricity connected; Sewer connected; Water connected
- Home design: Residential condominium; One story; Faces south; Floor 1
- Construction: Block construction; Built-up roof; Slab foundation; Built in 7 (building number 7 listed)
- Exterior features: Sidewalk; Sliding doors; Asphalt road surface
Interior
- Kitchen: Disposal; Microwave; Range; Refrigerator; Electric water heater
- Bedrooms: 2 bedrooms
- Flooring: Carpet; Tile
- Bathrooms: 2 full bathrooms
- Heating & cooling: Electric heating; Central air conditioning
- Interior features: Living room/dining room combo; Split bedroom plan; Window treatments
- Laundry & utility: No laundry features listed
Neighborhood map
What this means for you Summary
Snapshot
- This is a 2-bed/2.0-bath condo listed at $90k.
Deal economics
- At list price, monthly cash flow is $99 ($1k/yr) — positive.
- The deal already cash-flows at list — no discount required.
- Meets the 1% rule at list price ($2k rent vs $90k).
- Recommended offer: $79k (12.0% below list) — sets the bar for market timing.
- Cap rate 7.6% vs local median 0.3% in Indian Shores — top-decile yield for the area; either an underpriced asset or a hidden risk that comps aren't pricing in. Stress-test before assuming the spread holds.
Location & tenants
- Location reads 76/100 on livability (#234 in FL, #3,685 nationally) — a middle-class / working-renter tenant base. Strengths: crime A+, employment A+, housing A+; Watch: amenities F, cost of living F.
- Pinellas (suburban): math 51% / reading 51% proficiency, ranked #31 of 73 in FL (top 42%) — acceptable for families but not a draw, mixed tenant base, ~2y average lease.
- Market conditions: 146 active listings in the ZIP; 12 comparable units currently listed for rent nearby; rentals at typical pace (median 20d on market — plan ~3-4 weeks tenant-placement turnaround); 2,676 units permitted in Pinellas County in 2024 (1,422 in 5+ unit buildings).
Forward outlook
- Local home prices are declining (-3.0%/yr); year-one equity from $622 of loan paydown is wiped out by about $3k of value loss. Plan a longer hold.
- Pinellas County population projected at +14% by 2050 — modest demand growth; plan on rents tracking national, not racing it.
Negotiation context
- It's been on market 151 days — a 12% lower offer ($79k) is reasonable based on typical stale-listing flexibility.
Risks & watch-outs
- Watch-outs: HOA is 44% of rent.
- Climate carrying-cost: severe wind risk, 99% chance of damaging wind over 30y; extreme-heat days projected 7→28/yr by 2055 (HVAC capex compounding) — expect insurance premiums to compound above CPI over the hold.
Questions for the listing agent
- It's been on market 151 days. Have you received any prior offers? Is the seller open to a 12% concession, seller financing, or rate buy-down credit?
- Built in 1974 — when were the roof, HVAC, electrical panel, plumbing, and water heater last replaced?
- What does the HOA fee cover, when was the last increase, and are there any pending special assessments or reserve-fund shortfalls?
- Any open or pending special assessments — roof, HVAC, plumbing, elevator, façade? What's the per-unit balance and payoff schedule, and is the seller paying it off at close or rolling it to the buyer?
- Why hasn't it sold? Are there any deal-killer items the seller is aware of (foundation, flood, title, zoning, code violations)?
- Is there a deadline driving the sale (1031 exchange, divorce, estate, relocation)? That informs how much negotiation room exists.
- What's the average days-on-market for RENTAL listings here right now (not sales)? A rising rental-DOM trend means longer vacancies and softer asking-rent achievability than the comps imply.
- What's the recent tenant-quality profile in this submarket — average credit score on applications, eviction rate, late-payment / NSF rate, and stable-employment percentage? A property-management company in the area should have these aggregated.
- How much new apartment / multifamily construction is in the pipeline within 1–3 miles? Heavy new supply (>2% of stock underway) typically softens rents 12–24 months out; light construction supports rent growth.
Investment metrics
- 1% rule
- 2.31% ✓
- Cap rate
- 7.61%
- Cash-on-cash
- 4.70%
- DSCR
- 1.21
- GRM
- 3.6
CMA / ARV
No comps found within radius.
Projected returns pro-forma
-3.0% appreciation · 3.0% rent growth · sell at horizon
- IRR
- -8.2%
- Equity multiple
- 0.69×
- Total profit
- $-7,694
- Equity at exit
- $13,419
- IRR
- 2.1%
- Equity multiple
- 1.15×
- Total profit
- $3,834
- Equity at exit
- $7,782
Cash invested: $25,200 (down + closing). Projections, not guarantees.
Landlord ↔ Tenant lean methodology
- Overall (STATE)
- 87 Strongly Landlord-Friendly
- State Florida
- 87 Strongly Landlord-Friendly · R+3
- County
- — inherits STATE
- City
- — inherits STATE
ZIP-level market 33776
- Active inventory
- 146
- Price-to-rent
- 3.6×
Monthly cashflow live
- Estimated rent
- $2,081 high interval (Pro) →
- Mortgage (P&I)
- −$472
- Tax est. 1.5%
- −$112 /mo · $1,350/yr
- Insurance
- −$38
- HOA
- −$923
- Vacancy / Maint / Mgmt
- −$437
- Net cashflow
- $99
Break-even live
UW: 25.0% down · 7.5% · 30yr · 1.5% tax · 5.0% vac · 8.0% maint · 8.0% mgmt
Financing live
Cash to close
- Down payment
- $22,500
- Closing costs
- $2,700
- Reserves months
- —
- Total cash needed
- —
Loan-product check · same deal, 3 products live
Conventional
25% down · 7.5% · 30yr
- Down + closing
- —
- Monthly P&I
- —
- Monthly cashflow
- —
- DSCR
- —
- Eligible?
- —
Personal DTI + credit; lowest rate.
DSCR
20% down · 8.5% · 30yr
- Down + closing
- —
- Monthly P&I
- —
- Monthly cashflow
- —
- DSCR
- —
- Eligible?
- —
No personal income docs; deal must DSCR.
Hard money
10% down · 12.0% · 12mo
- Down + closing
- —
- Monthly P&I
- —
- Monthly cashflow
- —
- DSCR
- —
- Eligible?
- —
Short-term bridge; refi at stabilization.
Rent comps 12 comps
| Address | Beds | Baths | Sqft | Rent | $/sqft | DOM | Units | Dist |
|---|---|---|---|---|---|---|---|---|
| 13850 Oakwood Ln Seminole, FL | 2.0 | 1.0 | 805 | $1,400 | $1.74 | 3d | 1 | 0.03mi |
| 9224 Mission Oaks Blvd Seminole, FL | 2.0 | 1.5 | 805 | $1,800 | $2.24 | 24d | 1 | 0.03mi |
| 13827 Mission Oaks Blvd Seminole, FL | 2.0 | 2.0 | 865 | $2,400 | $2.77 | 24d | 1 | 0.03mi |
| 13870 Oakwood Ln Seminole, FL | 2.0 | 2.0 | 865 | $2,600 | $3.01 | 4d | 1 | 0.08mi |
| 13925 Mission Oaks Blvd #13714 Seminole, FL | 2.0 | 2.0 | 865 | $2,200 | $2.54 | 24d | 1 | 0.12mi |
| 19451 Gulf Blvd #604 Indian Shores, FL | 1.0 | 1.0 | 725 | $2,000 | $2.76 | 4d | 1 | 0.78mi |
| 19610 Gulf Blvd #101 Indian Shores, FL | 2.0 | 2.0 | 1100 | $3,000 | $2.73 | 24d | 1 | 0.90mi |
| 10215 Regal Dr #4 Largo, FL | 2.0 | 2.0 | 1105 | $2,300 | $2.08 | 4d | 1 | 1.02mi |
| 10350 Imperial Point Dr W #8 Largo, FL | 1.0 | 1.5 | 860 | $1,675 | $1.95 | 24d | 1 | 1.02mi |
| 10350 Imperial Point Dr W #10 Largo, FL | 1.0 | 1.0 | 815 | $1,550 | $1.90 | 3d | 1 | 1.02mi |
| 10351 Regal Dr Largo, FL | 1.0 | 1.0–1.5 | 837 | $1,700 | $2.03 | 20d | 2 | 1.05mi |
| 10216 Regal Dr #201 Largo, FL | 2.0 | 2.0 | 1100 | $2,000 | $1.82 | 15d | 1 | 1.07mi |
HOA detail condo
- Monthly dues
- $923 · $11,076/yr
- Likely covers
- pool
- Assessments
- None detected in remarks — confirm with the listing agent.
Listing history 10 events
-
2026-06-13status $90,000 Pending 151 DOM
-
2026-06-09days on market $90,000 Active 151 DOM
-
2026-06-08days on market $90,000 Active 150 DOM
-
2026-06-07days on market $90,000 Active 149 DOM
-
2026-06-04days on market $90,000 Active 146 DOM
-
2026-06-03days on market $90,000 Active 145 DOM
-
2026-06-01days on market $90,000 Active 143 DOM
-
2026-05-31days on market $90,000 Active 142 DOM
-
2026-02-18price $90,000
-
2026-01-09$95,000 Active
ⓘ Source: listings_history table (triggers on properties + properties_extension) + one-shot
backfill from property_details.listing_events for pre-trigger history.
Climate risk First Street
- Flood 1/10 Low FEMA zone X (unshaded) · 0% chance over 30 yrs
- Wildfire 1/10 Low
- Heat 10/10 Extreme 7 d/yr ≥107°F today · 28 d/yr by 30 yrs out
- Wind 10/10 Extreme 99% chance of damaging wind over 30 yrs
- Air quality 3/10 Moderate 2 unhealthy d/yr today · 3 by 30 yrs out
Nearby sold comps map
Loading sold comps map…
Walkable amenities ~0.75 mi
Loading nearby amenities…
Taxation est. · year 1
- Rental income
- $24,968
- − Mortgage interest
- −$5,041
- − Property taxes
- −$1,350
- − Insurance
- −$450
- − Repairs & maintenance
- −$1,997
- − Management
- −$1,997
- − HOA
- −$11,076
- − Depreciation
- −$2,618
- Taxable income
- $438
- Est. tax owed @ 24.0%
- −$105
- After-tax cash flow
- $1,080/yr
For passive investors: Depreciation is non-cash, so a rental often shows a tax loss while cash-flowing — sheltering income. Rental losses are passive: they offset passive income freely, and up to $25,000/yr can offset ordinary (W-2) income if you actively participate and your MAGI is under $100k (phasing out to $0 by $150k); unused losses carry forward. On sale, claimed depreciation is recaptured at up to 25%, and gains may owe capital-gains tax (a 1031 exchange can defer both). Figures are a year-1 estimate at your 24.0% rate — not tax advice; consult a CPA.
Schools (NCES district)
- District
- Pinellas
- NCES district ID
- 1201560
- Math proficiency
- 51% ▼ -5.00%
- Reading proficiency
- 51% ▼ -3.00%
- Median HH income
- $46,270
- Composite
- 43.27/100
- National rank
- #3046
- State rank
- #31 of 73 in FL
Livability — Indian Shores
- Score
- 76/100
- State rank
- #234
- US rank
- #3685
Category grades
Schools grade is shown separately in the Schools card above.
Census & demographics
- Population (ZIP)
- 12,711
Population outlook (Pinellas County) Hauer SSP2
- Today (2025)
- 1,027,532 people
- By 2030
- 1,063,586 · +3.5%
- By 2040
- 1,125,020 · +9.5%
- By 2050
- 1,168,637 · +13.7%
- By 2075
- 1,265,188 · +23.1%
- By 2100
- 1,260,357 · +22.7%
Race, ethnicity, and origin ACS 2023
- Neighborhood character
- Predominantly White (84%)
- Race & ethnicity
- White 84% Hispanic / Latino 7% Two or more races 7% Asian 2% Black 2%
- Hispanic origin (detail)
- Mexican 3%
- Common ancestry
- Romanian 7% Lithuanian 3% Slovak 1%
- Foreign-born
- 9% · Canada, Jamaica
- Languages at home
- 89% English-only · Other Indo-European 4% Russian/Polish/Slavic 3% Spanish 2%
Political lean MEDSL · Pinellas
- 2024 margin
- Lean R (+5.2) · D 46.9% · R 52.1%
- 2008→2024 swing
- -13.5pp toward R · 2008: 8.3pp · 2024: -5.2pp
- All cycles
- 2024: R+5.2 2020: D+0.2 2016: R+1.1 2012: D+5.6 2008: D+8.3
Not yet ingested
- Civics
- —
Market trends
- HPI YoY
- ▼ -455.42%
- Current HPI
- 337.3149
- Rent YoY
- —
- Metro
- —
- State GDP YoY
- ▲ 3.28%
- F500 in state
- 36
Industry mix (Fortune 500 HQ in FL)
| Industry | F500 HQs | Revenue |
|---|---|---|
| Industrial Technology | 2 | $29B |
|
||
| Insurance | 2 | $17B |
|
||
| Retail | 1 | $60B |
|
||
| Technology Distribution | 1 | $58B |
|
||
| Homebuilding | 1 | $35B |
|
||
| Technology Manufacturing | 1 | $35B |
|
||
Price history
-5.3% since first listed2 events — show timeline
- 2026-02-18 Price Changed $90,000 Stellar MLS as Distributed by MLS Grid
- 2026-01-09 Listed $95,000 Stellar MLS as Distributed by MLS Grid
Cash-flow waterfall
monthlySold comps — $/sqft
last 12 mo · ≤1 miLoading sold comps…