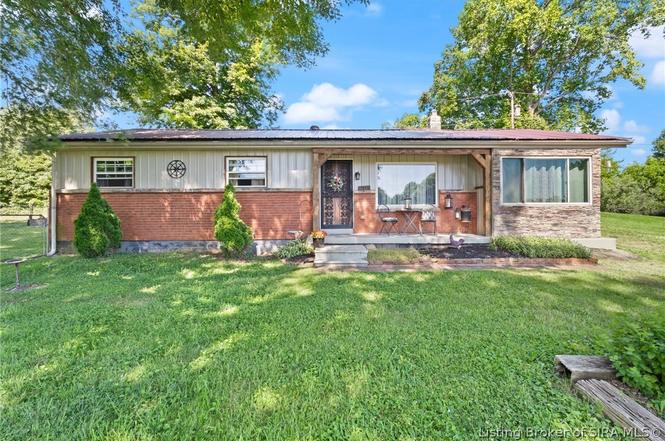
7465 E Sieveking Dr NE · New Salisbury, IN
Flood risk 1/10 · Minimal
- FEMA flood zone
- X (unshaded)
- Chance of flooding over 30 yrs
- 0.0%
- Est. flood insurance / yr
- $507 – $1,088
Fire risk 2/10 · Minimal
- Est. fire insurance / yr
- $717 – $1,331
Heat risk 5/10 · Moderate
- Hot days now (above 105°F)
- 7 days/yr
- Hot days in 30 yrs
- 19 days/yr
Wind risk 2/10 · Minimal
- Chance of severe wind over 30 yrs
- 3.0%
Air-quality risk 2/10 · Minimal
- Unhealthy air days now
- 1 days/yr
- Unhealthy air days in 30 yrs
- 1 days/yr
Risk factors via First Street. Map © Google.
Why this score? — see what drove the C grade
The composite is a weighted blend of 9 inputs, each scored 0–100. Each bar is that input's sub-score; the figure is the points it added to the 100-point composite (weight × sub-score).
- Cash flow +21.7/30.0
- ARV discount +15.0/15.0
- DSCR +6.9/10.0
- 1% rule +4.5/10.0
- Schools +3.7/10.0
- Livability +2.8/5.0
- Rent growth +2.5/5.0
- Condition / age +2.5/5.0
- Appreciation +0.0/10.0
$199,900
🖨 Deal sheet 📄 Offer letter ✓ Due diligence
Listing remarks MLS
Bank owned. Lots of potential. Sold - As is - Where Is. Needs some work. Mechanical systems condition unknown. All data to be confirmed by buyer and buyer's agent.
Key facts
- Woodburning stove
- Outdoor space
- Seasoned room
Tags
Property features AI
Exterior
- Parking: No garage
- Utilities: Public water connected; Septic tank sewage
- Home design: Single-story; Brick and frame construction
- Construction: Brick and frame construction
- Exterior features: Landscaped yard; Shed(s); Paved road access; Residential zoning
Interior
- Kitchen: Oven; Range; Refrigerator; Eat-in kitchen
- Bathrooms: 1 full bathroom; 1 half bathroom
- Interior features: Eat-in kitchen; Wood burning stove fireplace
- Laundry & utility: Washer; Dryer; Laundry on main level
Neighborhood map
What this means for you Summary
Snapshot
- This is a 3-bed/1.5-bath single-family listed at $200k.
Deal economics
- At list price, monthly cash flow is $308 ($4k/yr) — positive.
- The deal already cash-flows at list — no discount required.
- To meet the 1% rule (rent ≥ 1% of price), the offer needs to be $190k (5.0% below list).
- Recommended offer: $190k (5.0% below list) — sets the bar for 1% rule.
- Cap rate 8.1% vs local median 4.7% in New Salisbury — top-decile yield for the area; either an underpriced asset or a hidden risk that comps aren't pricing in. Stress-test before assuming the spread holds.
Location & tenants
- Location reads 56/100 on livability (#624 in IN) — a working-class tenant base; expect higher turnover. Strengths: cost of living A+; Watch: schools D, amenities F, commute F.
- North Harrison Community School Corporation (rural): math 40% / reading 46% proficiency, ranked #110 of 301 in IN (top 36%) — families likely to look elsewhere, expect single-tenant / working-renter base with shorter leases.
- Market conditions: 44 active listings in the ZIP; 2 comparable units currently listed for rent nearby; 158 units permitted in Harrison County in 2024 (0 in 5+ unit buildings).
Forward outlook
- Local home prices are declining (-3.0%/yr); year-one equity from $1k of loan paydown is wiped out by about $6k of value loss. Plan a longer hold.
- Harrison County population projected to shrink 6% by 2050 — rents likely to lag national; underwrite the cash flow, not the appreciation.
Negotiation context
- Only 3 days on market — expect competitive offers; lowballing is unlikely to land.
- 2 sale attempts since 10y ago with the ask held roughly flat each time — persistent listings suggest the price (not the market) is what's stuck; bring a comps-based counter.
- Current owner paid $40k; list at $200k implies a 406% gain — meaningful room to come down on a strong offer.
Risks & watch-outs
- Climate carrying-cost: extreme-heat days projected 7→19/yr by 2055 (HVAC capex compounding) — expect insurance premiums to compound above CPI over the hold.
Questions for the listing agent
- Built in 1972 — when were the roof, HVAC, electrical panel, plumbing, and water heater last replaced?
- Is there a deadline driving the sale (1031 exchange, divorce, estate, relocation)? That informs how much negotiation room exists.
- Schools are D-rated, which usually means shorter tenancies and higher turnover. Who's the typical renter profile here, and what's been the actual vacancy rate?
- What's the average days-on-market for RENTAL listings here right now (not sales)? A rising rental-DOM trend means longer vacancies and softer asking-rent achievability than the comps imply.
- What's the recent tenant-quality profile in this submarket — average credit score on applications, eviction rate, late-payment / NSF rate, and stable-employment percentage? A property-management company in the area should have these aggregated.
- How much new for-sale + rental construction is in the pipeline within 1–3 miles? Heavy new supply typically softens prices + rents 12–24 months out; constrained supply supports both.
Investment metrics
- 1% rule
- 0.95% ✗
- Cap rate
- 8.14%
- Cash-on-cash
- 6.59%
- DSCR
- 1.29
- GRM
- 8.8
CMA / ARV
- ARV (on-the-fly)
- $244,755
- Comps found
- 5
Show comp detail 5 sales within ~0.75 mi
| Address | Dist | Beds/Ba | Sqft | Sold | Price | $/sf | Match |
|---|---|---|---|---|---|---|---|
| 7387 Mockingbird Ct NE | 0.17mi | 3/2.0 | 1,344 (+2%) | 17mo | $223,000 | $166 | 73 |
| 7520 E Sieveking Dr | 0.07mi | 3/2.0 | 1,220 (-8%) | 18mo | $229,500 | $188 | 67 |
| 8174 Timber Ln NE #402 | 0.40mi | 2/2.0 (-1) | 1,240 (-6%) | 10mo | $229,900 | $185 | 55 |
| 8092 Wagner Ave NE | 0.74mi | 3/2.0 | 1,382 (+4%) | 8mo | $249,900 | $181 | 50 |
| 8095 Wagner Ave NE | 0.72mi | 3/2.0 | 1,382 (+4%) | 11mo | $280,000 | $203 | 48 |
Match score weights: distance 35% · size 25% · config 20% · recency 20%. Top-matched comps best support the ARV.
Projected returns pro-forma
-3.0% appreciation · 3.0% rent growth · sell at horizon
- IRR
- -6.2%
- Equity multiple
- 0.77×
- Total profit
- $-12,891
- Equity at exit
- $29,806
- IRR
- 3.4%
- Equity multiple
- 1.24×
- Total profit
- $13,644
- Equity at exit
- $17,284
Cash invested: $55,972 (down + closing). Projections, not guarantees.
Landlord ↔ Tenant lean methodology
- Overall (STATE)
- 90 Strongly Landlord-Friendly
- State Indiana
- 90 Strongly Landlord-Friendly · R+11
- County
- — inherits STATE
- City
- — inherits STATE
ZIP-level market 47161
- Home prices YoY
- -10.5%
- Active inventory
- 44
- Price-to-rent
- 8.8×
Monthly cashflow live
- Estimated rent
- $1,899 medium interval (Pro) →
- Mortgage (P&I)
- −$1,048
- Tax from tax record
- −$61 /mo · $733/yr
- Insurance
- −$83
- HOA
- −$0
- Vacancy / Maint / Mgmt
- −$399
- Net cashflow
- $308
Break-even live
UW: 25.0% down · 7.5% · 30yr · 1.5% tax · 5.0% vac · 8.0% maint · 8.0% mgmt
Financing live
Cash to close
- Down payment
- $49,975
- Closing costs
- $5,997
- Reserves months
- —
- Total cash needed
- —
Loan-product check · same deal, 3 products live
Conventional
25% down · 7.5% · 30yr
- Down + closing
- —
- Monthly P&I
- —
- Monthly cashflow
- —
- DSCR
- —
- Eligible?
- —
Personal DTI + credit; lowest rate.
DSCR
20% down · 8.5% · 30yr
- Down + closing
- —
- Monthly P&I
- —
- Monthly cashflow
- —
- DSCR
- —
- Eligible?
- —
No personal income docs; deal must DSCR.
Hard money
10% down · 12.0% · 12mo
- Down + closing
- —
- Monthly P&I
- —
- Monthly cashflow
- —
- DSCR
- —
- Eligible?
- —
Short-term bridge; refi at stabilization.
Rent comps 2 comps
| Address | Beds | Baths | Sqft | Rent | $/sqft | DOM | Units | Dist |
|---|---|---|---|---|---|---|---|---|
| 8206 Wagner Ave NE New Salisbury, IN | 3.0 | 2.0 | 1385 | $1,899 | $1.37 | 14d | 1 | 0.83mi |
| 8206 Wagner Ave NE New Salisbury, IN | 3.0 | 2.0 | 1383 | $1,899 | $1.37 | 23d | 1 | 0.83mi |
Listing history 4 events
-
2026-06-18days on market $199,900 Active 3 DOM
-
2026-06-17days on market $199,900 Active 2 DOM
-
2026-06-16remarks 554-char remark
-
2026-06-16$199,900 Active 1 DOM
ⓘ Source: listings_history table (triggers on properties + properties_extension) + one-shot
backfill from property_details.listing_events for pre-trigger history.
Tax reassessment forecast IN · Partial reset (capped growth)
- Current annual tax
- $733 · $61/mo
- Projected year-2 tax
- $1,216 · $101/mo
- Expected delta
- +$483/yr (+$40/mo · 66.0%)
ⓘ Screening estimate from a state-policy table — verify with the county assessor before closing.
Climate risk First Street
- Flood 1/10 Low FEMA zone X (unshaded) · 0% chance over 30 yrs
- Wildfire 2/10 Low
- Heat 5/10 Major 7 d/yr ≥105°F today · 19 d/yr by 30 yrs out
- Wind 2/10 Low 3% chance of damaging wind over 30 yrs
- Air quality 2/10 Low 1 unhealthy d/yr today · 1 by 30 yrs out
Nearby sold comps map
Loading sold comps map…
Walkable amenities ~0.75 mi
Loading nearby amenities…
Taxation est. · year 1
- Rental income
- $22,788
- − Mortgage interest
- −$11,198
- − Property taxes
- −$733
- − Insurance
- −$1,000
- − Repairs & maintenance
- −$1,823
- − Management
- −$1,823
- − Depreciation
- −$5,815
- Taxable income
- $397
- Est. tax owed @ 24.0%
- −$95
- After-tax cash flow
- $3,596/yr
For passive investors: Depreciation is non-cash, so a rental often shows a tax loss while cash-flowing — sheltering income. Rental losses are passive: they offset passive income freely, and up to $25,000/yr can offset ordinary (W-2) income if you actively participate and your MAGI is under $100k (phasing out to $0 by $150k); unused losses carry forward. On sale, claimed depreciation is recaptured at up to 25%, and gains may owe capital-gains tax (a 1031 exchange can defer both). Figures are a year-1 estimate at your 24.0% rate — not tax advice; consult a CPA.
Schools (NCES district)
- District
- North Harrison Community School Corporation
- NCES district ID
- 1800690
- Math proficiency
- 40% ▼ -16.00%
- Reading proficiency
- 46% ▼ -13.00%
- Median HH income
- $51,643
- Composite
- 37.12/100
- National rank
- #4493
- State rank
- #110 of 301 in IN
Livability — New Salisbury
- Score
- 56/100
- State rank
- #624
- US rank
- #23062
Category grades
Schools grade is shown separately in the Schools card above.
Census & demographics
- Census place
- New Salisbury, IN
- City population
- 3,362
- Population (ZIP)
- 3,362
Population outlook (Harrison County) Hauer SSP2
- Today (2025)
- 40,288 people
- By 2030
- 40,265 · -0.1%
- By 2040
- 39,538 · -1.9%
- By 2050
- 37,781 · -6.2%
- By 2075
- 33,200 · -17.6%
- By 2100
- 26,668 · -33.8%
Race, ethnicity, and origin ACS 2023
- Neighborhood character
- Predominantly White (100%)
- Race & ethnicity
- White 100%
- Common ancestry
- Portuguese 2% Lithuanian 2% Italian 2%
- Foreign-born
- 0%
Political lean MEDSL · Harrison
- 2024 margin
- Solid R (+47.0) · D 25.6% · R 72.5% · Other 1.8%
- 2008→2024 swing
- -28.9pp toward R · 2008: -18.0pp · 2024: -47.0pp
- All cycles
- 2024: R+47.0 2020: R+45.6 2016: R+44.4 2012: R+22.8 2008: R+18.0
Not yet ingested
- Civics
- —
Market trends
- HPI YoY
- ▼ -25.82%
- Current HPI
- 221.0899
- Rent YoY
- —
- Metro
- —
- State GDP YoY
- ▲ 2.90%
- F500 in state
- 18
Industry mix (Fortune 500 HQ in IN)
| Industry | F500 HQs | Revenue |
|---|---|---|
| Industrial Machinery | 2 | $37B |
|
||
| Healthcare | 1 | $177B |
|
||
| Pharmaceuticals | 1 | $45B |
|
||
| Metals / Steel | 1 | $18B |
|
||
| Agriculture | 1 | $17B |
|
||
| Packaging | 1 | $12B |
|
||
Price history
+371.5% since first listed3 events — show timeline
- 2026-06-15 Listed $199,900 SIRA
- 2016-09-02 Sold (MLS) $39,509 SIRA
- 2016-07-06 Listed $42,400 SIRA
Property tax history
+6.4%/yrLatest (2024): $733 · -3.3% YoY. Source: county tax records.
Cash-flow waterfall
monthlySold comps — $/sqft
last 12 mo · ≤1 miLoading sold comps…