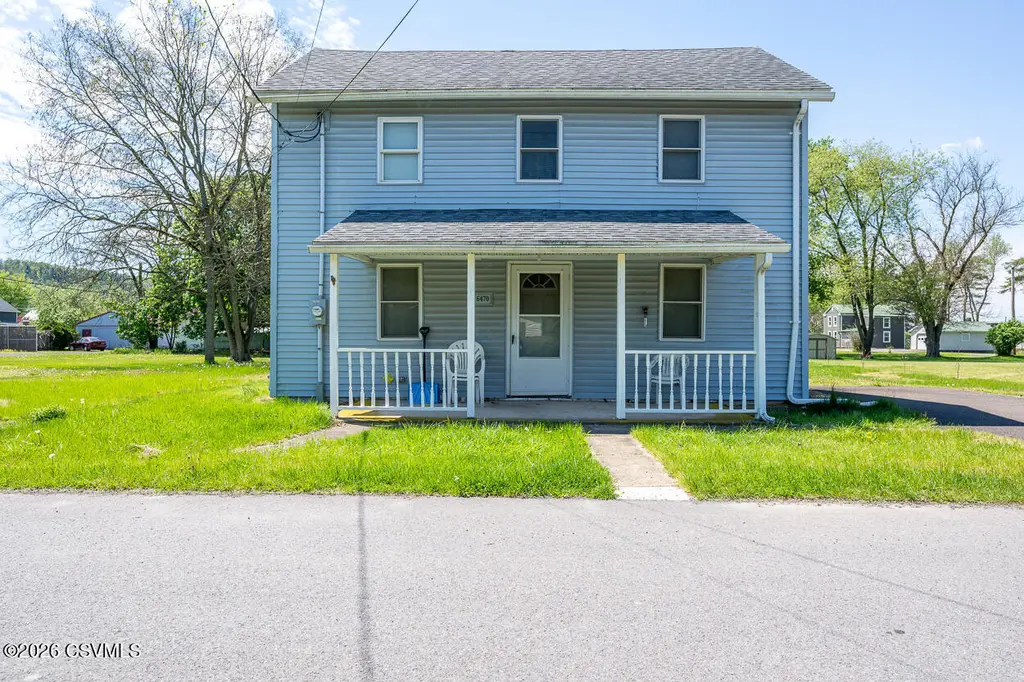
6470 Main St · South Centre, PA
Flood risk 4/10 · Minor
- FEMA flood zone
- X (unshaded)
- Chance of flooding over 30 yrs
- 0.23%
- Est. flood insurance / yr
- $473 – $860
Fire risk 1/10 · Minimal
- Est. fire insurance / yr
- $511 – $949
Heat risk 4/10 · Minor
- Hot days now (above 99°F)
- 7 days/yr
- Hot days in 30 yrs
- 16 days/yr
Wind risk 3/10 · Minor
- Chance of severe wind over 30 yrs
- 4.0%
Air-quality risk 2/10 · Minimal
- Unhealthy air days now
- 1 days/yr
- Unhealthy air days in 30 yrs
- 1 days/yr
Risk factors via First Street. Map © Google.
Why this score? — see what drove the C- grade
The composite is a weighted blend of 9 inputs, each scored 0–100. Each bar is that input's sub-score; the figure is the points it added to the 100-point composite (weight × sub-score).
- Cash flow +16.3/30.0
- ARV discount +10.9/15.0
- Schools +5.6/10.0
- DSCR +5.1/10.0
- Rent growth +4.2/5.0
- 1% rule +3.5/10.0
- Livability +2.5/5.0
- Condition / age +2.5/5.0
- Appreciation +0.0/10.0
$175,000
🖨 Deal sheet (PDF) 📄 Offer letter ✓ Due diligence
Listing remarks
This property offers a great opportunity for a first-time buyer or anyone looking for a home they can personalize and make their own over time. Situated on a generous . 30 acre in-town lot on a quiet street, the property offers a rare combination of convenience and outdoor space while still being close to Bloomsburg amenities, schools, and major highways. The home features a solid structure with some existing updates and is comfortably livable while offering opportunity for cosmetic updates and improvements over time--providing plenty of potential to build value and customize to your style. Outside, you'll appreciate the spacious yard, paved driveway, and inviting setting with room for gard
Key facts
- Spacious yard
- Paved driveway
- 0.32 acre lot
Tags
Property features AI
Exterior
- Parking: No garage; Paved off-street parking
- Utilities: Public water
- Home design: Single-family residence; Residential property
- Construction: Vinyl siding and frame construction; Shingle roof; No foundation details listed; Built area above grade: 1,440
- Exterior features: Porch; Shed(s)
Interior
- Kitchen: Refrigerator
- Bathrooms: 1 full bathroom; 1 three-quarter bathroom
- Heating & cooling: Has heating
- Interior features: Gas water heater; Refrigerator; Porch; Exterior-entry basement
- Laundry & utility: Gas water heater
Neighborhood map
What this means for you Summary
Snapshot
- This is a 3-bed/2.0-bath other listed at $175k.
Deal economics
- At list price, monthly cash flow is $97 ($1k/yr) — positive.
- The deal already cash-flows at list — no discount required.
- To meet the 1% rule (rent ≥ 1% of price), the offer needs to be $150k (14.5% below list).
- Recommended offer: $150k (14.5% below list) — sets the bar for 1% rule.
Location & tenants
- Location reads: area grade C — affects rentability + tenant quality, not the cash-flow math above.
- Central Columbia SD (suburban): math 58% / reading 73% proficiency, ranked #51 of 539 in PA (top 10%) — acceptable for families but not a draw, mixed tenant base, ~2y average lease.
- Zoned schools: Central Columbia El Sch (math 61% / reading 74%, grade B+, #192 of 1,518 statewide, top 13%, 699 students, 37% FRL); Central Columbia Ms (math 51% / reading 73%, grade B+, #32 of 512 statewide, top 7%, 612 students, 37% FRL); Central Columbia Shs (math 82%, 597 students, 27% FRL).
- Market conditions: Rents rising fast (+6.8%/yr); 125 active listings in the ZIP; 82 units permitted in Columbia County in 2024 (0 in 5+ unit buildings).
Forward outlook
- Local home prices are declining (-3.0%/yr); year-one equity from $1k of loan paydown is wiped out by about $5k of value loss. Plan a longer hold.
- Columbia County population projected at -12% by 2050 — secular population decline; favor cash flow + early exit over multi-decade hold.
Negotiation context
- It's been on market 44 days — a 3% lower offer ($170k) is reasonable based on typical stale-listing flexibility.
- 2 sale attempts with the ask held roughly flat each time — persistent listings suggest the price (not the market) is what's stuck; bring a comps-based counter.
- Current owner paid $58k; list at $175k implies a 202% gain — meaningful room to come down on a strong offer.
Risks & watch-outs
- Watch-outs: built in 1900 — expect roof / HVAC / electrical / plumbing capex.
Questions for the listing agent
- It's been on market 44 days. Have you received any prior offers? Is the seller open to a 15% concession, seller financing, or rate buy-down credit?
- Built in 1900 — when were the roof, HVAC, electrical panel, plumbing, and water heater last replaced?
- Is there a deadline driving the sale (1031 exchange, divorce, estate, relocation)? That informs how much negotiation room exists.
- What's the average days-on-market for RENTAL listings here right now (not sales)? A rising rental-DOM trend means longer vacancies and softer asking-rent achievability than the comps imply.
- What's the recent tenant-quality profile in this submarket — average credit score on applications, eviction rate, late-payment / NSF rate, and stable-employment percentage? A property-management company in the area should have these aggregated.
- How much new for-sale + rental construction is in the pipeline within 1–3 miles? Heavy new supply typically softens prices + rents 12–24 months out; constrained supply supports both.
Investment metrics
- 1% rule
- 0.85% ✗
- Cap rate
- 6.96%
- Cash-on-cash
- 2.38%
- DSCR
- 1.11
- GRM
- 9.8
CMA / ARV
- ARV (median comp)
- $189,263
- List price
- $175,000
- Delta
- -7.54%
- Verdict
- FAIR
- Comps
- 18 within 1.0 mi
Projected returns pro-forma
-3.0% appreciation · 6.8% rent growth · sell at horizon
- IRR
- -8.8%
- Equity multiple
- 0.67×
- Total profit
- $-16,288
- Equity at exit
- $26,093
- IRR
- 4.8%
- Equity multiple
- 1.41×
- Total profit
- $19,908
- Equity at exit
- $15,131
Cash invested: $49,000 (down + closing). Projections, not guarantees.
Landlord ↔ Tenant lean methodology
- Overall (STATE)
- 62 Landlord-Friendly
- State Pennsylvania
- 62 Landlord-Friendly · EVEN
- County
- — inherits STATE
- City
- — inherits STATE
ZIP-level market 17815
- Home prices YoY
- -33.0%
- Rents YoY
- 6.8%
- Active inventory
- 125
- Price-to-rent
- 9.8×
Monthly cashflow live
- Estimated rent
- $1,495 medium interval (Pro) →
- Mortgage (P&I)
- −$918
- Tax from tax record
- −$94 /mo · $1,123/yr
- Insurance
- −$73
- HOA
- −$0
- Vacancy / Maint / Mgmt
- −$314
- Net cashflow
- $97
Break-even live
Sensitivity live
| Price | -10% $196 | -5% $147 | +0% $97 | +5% $48 | +10% $-2 |
|---|---|---|---|---|---|
| Rent | -10% $-21 | -5% $38 | +0% $97 | +5% $156 | +10% $215 |
| Rate | -1.0pp $185 | -0.5pp $142 | base $97 | +0.5pp $52 | +1.0pp $6 |
UW: 25.0% down · 7.5% · 30yr · 1.5% tax · 5.0% vac · 8.0% maint · 8.0% mgmt
Financing live
Cash to close
- Down payment
- $43,750
- Closing costs
- $5,250
- Reserves months
- —
- Total cash needed
- —
Loan-product check · same deal, 3 products live
Conventional
25% down · 7.5% · 30yr
- Down + closing
- —
- Monthly P&I
- —
- Monthly cashflow
- —
- DSCR
- —
- Eligible?
- —
Personal DTI + credit; lowest rate.
DSCR
20% down · 8.5% · 30yr
- Down + closing
- —
- Monthly P&I
- —
- Monthly cashflow
- —
- DSCR
- —
- Eligible?
- —
No personal income docs; deal must DSCR.
Hard money
10% down · 12.0% · 12mo
- Down + closing
- —
- Monthly P&I
- —
- Monthly cashflow
- —
- DSCR
- —
- Eligible?
- —
Short-term bridge; refi at stabilization.
Listing history 19 events
-
2026-06-22days on market $175,000 Active 44 DOM
-
2026-06-19days on market $175,000 Active 41 DOM
-
2026-06-18days on market $175,000 Active 40 DOM
-
2026-06-17days on market $175,000 Active 39 DOM
-
2026-06-16days on market $175,000 Active 38 DOM
-
2026-06-15days on market $175,000 Active 37 DOM
-
2026-06-14days on market $175,000 Active 35 DOM
-
2026-06-12days on market $175,000 Active 34 DOM
-
2026-06-09pricedays on market $175,000 Active 31 DOM
-
2026-06-08days on market $182,500 Active 30 DOM
-
2026-06-07days on market $182,500 Active 29 DOM
-
2026-06-03days on market $182,500 Active 25 DOM
-
2026-06-02days on market $182,500 Active 24 DOM
-
2026-06-01days on market $182,500 Active 23 DOM
-
2026-05-31days on market $182,500 Active 22 DOM
-
2026-05-30days on market $182,500 Active 21 DOM
-
2026-05-09$182,500 Active 1185-char remark
-
2026-05-07$182,500 Active
-
2004-09-13soldstatus $58,000
ⓘ Source: listings_history table (triggers on properties + properties_extension) + one-shot
backfill from property_details.listing_events for pre-trigger history.
Tax reassessment forecast PA · Partial reset (capped growth)
- Current annual tax
- $1,123 · $94/mo
- Projected year-2 tax
- $1,944 · $162/mo
- Expected delta
- +$821/yr (+$68/mo · 73.1%)
ⓘ Screening estimate from a state-policy table — verify with the county assessor before closing.
Climate risk First Street
- Flood 4/10 Moderate FEMA zone X (unshaded) · 23% chance over 30 yrs
- Wildfire 1/10 Low
- Heat 4/10 Moderate 7 d/yr ≥99°F today · 16 d/yr by 30 yrs out
- Wind 3/10 Moderate 4% chance of damaging wind over 30 yrs
- Air quality 2/10 Low 1 unhealthy d/yr today · 1 by 30 yrs out
Nearby sold comps map
Loading sold comps map…
Walkable amenities ~0.75 mi
Loading nearby amenities…
Taxation est. · year 1
- Rental income
- $17,945
- − Mortgage interest
- −$9,803
- − Property taxes
- −$1,123
- − Insurance
- −$875
- − Repairs & maintenance
- −$1,436
- − Management
- −$1,436
- − Depreciation
- −$5,091
- Taxable loss
- −$1,818
- Est. tax savings @ 24.0%
- +$436
- After-tax cash flow
- $1,602/yr
For passive investors: Depreciation is non-cash, so a rental often shows a tax loss while cash-flowing — sheltering income. Rental losses are passive: they offset passive income freely, and up to $25,000/yr can offset ordinary (W-2) income if you actively participate and your MAGI is under $100k (phasing out to $0 by $150k); unused losses carry forward. On sale, claimed depreciation is recaptured at up to 25%, and gains may owe capital-gains tax (a 1031 exchange can defer both). Figures are a year-1 estimate at your 24.0% rate — not tax advice; consult a CPA.
Schools (NCES district)
- District
- Central Columbia SD
- NCES district ID
- 4205370
- Math proficiency
- 58% ▼ -7.00%
- Reading proficiency
- 73% ▼ -4.00%
- Median HH income
- $54,278
- Composite
- 55.99/100
- National rank
- #1195
- State rank
- #51 of 539 in PA
Livability — South Centre
No livability data for this city. (Only ~50 U.S. cities are tracked.)
Census & demographics
- Census place
- Lime Ridge, PA
- County
- Columbia County · 29,790 people
- Metro
- Bloomsburg-Berwick, PA
- Population (ZIP)
- 29,790
- Household income
- $67,510
- Rent vs Own
- Severe rent burden
- 801.0
Population outlook (Columbia County) Hauer SSP2
- Today (2025)
- 65,170 people
- By 2030
- 64,054 · -1.7%
- By 2040
- 61,131 · -6.2%
- By 2050
- 57,526 · -11.7%
- By 2075
- 50,259 · -22.9%
- By 2100
- 44,756 · -31.3%
Race, ethnicity, and origin ACS 2023
- Neighborhood character
- Predominantly White (89%)
- Race & ethnicity
- White 89% Hispanic / Latino 5% Two or more races 4% Black 2% Asian 2%
- Common ancestry
- Romanian 5% Iranian 2% Polish 2%
- Foreign-born
- 3% · Canada, China
- Languages at home
- 97% English-only · Spanish 1% Other Indo-European 1% German/W. Germanic 1%
Political lean MEDSL · Columbia
- 2024 margin
- Solid R (+31.0) · D 34.0% · R 65.0%
- 2008→2024 swing
- -26.6pp toward R · 2008: -4.5pp · 2024: -31.0pp
- All cycles
- 2024: R+31.0 2020: R+30.7 2016: R+32.8 2012: R+12.4 2008: R+4.5
Not yet ingested
- Civics
- —
Market trends
- HPI YoY
- ▼ -108.98%
- Current HPI
- 220.8076
- Rent YoY
- ▲ 6.80%
- Metro
- Bloomsburg-Berwick, PA
- State GDP YoY
- ▲ 1.68%
- F500 in state
- 34
Industry mix (Fortune 500 HQ in PA)
| Industry | F500 HQs | Revenue |
|---|---|---|
| Healthcare | 2 | $309B |
|
||
| Insurance | 2 | $27B |
|
||
| Telecommunications / Media | 1 | $124B |
|
||
| Industrial Distribution | 1 | $22B |
|
||
| Financial Services | 1 | $20B |
|
||
| Chemicals / Materials | 1 | $18B |
|
||
Price history
+201.7% since first listed4 events — show timeline
- 2026-06-09 Price Changed $175,000 CSVBR
- 2026-05-09 Listed $182,500 CSVBR
- 2026-05-07 Listed $182,500 CSVBR
- 2004-09-13 Sold (Public Records) $58,000 Public Records
Property tax history
+3.0%/yrLatest (2026): $1,123 · +2.8% YoY. Source: county tax records.
Cash-flow waterfall
monthlySold comps — $/sqft
last 12 mo · ≤1 miLoading sold comps…