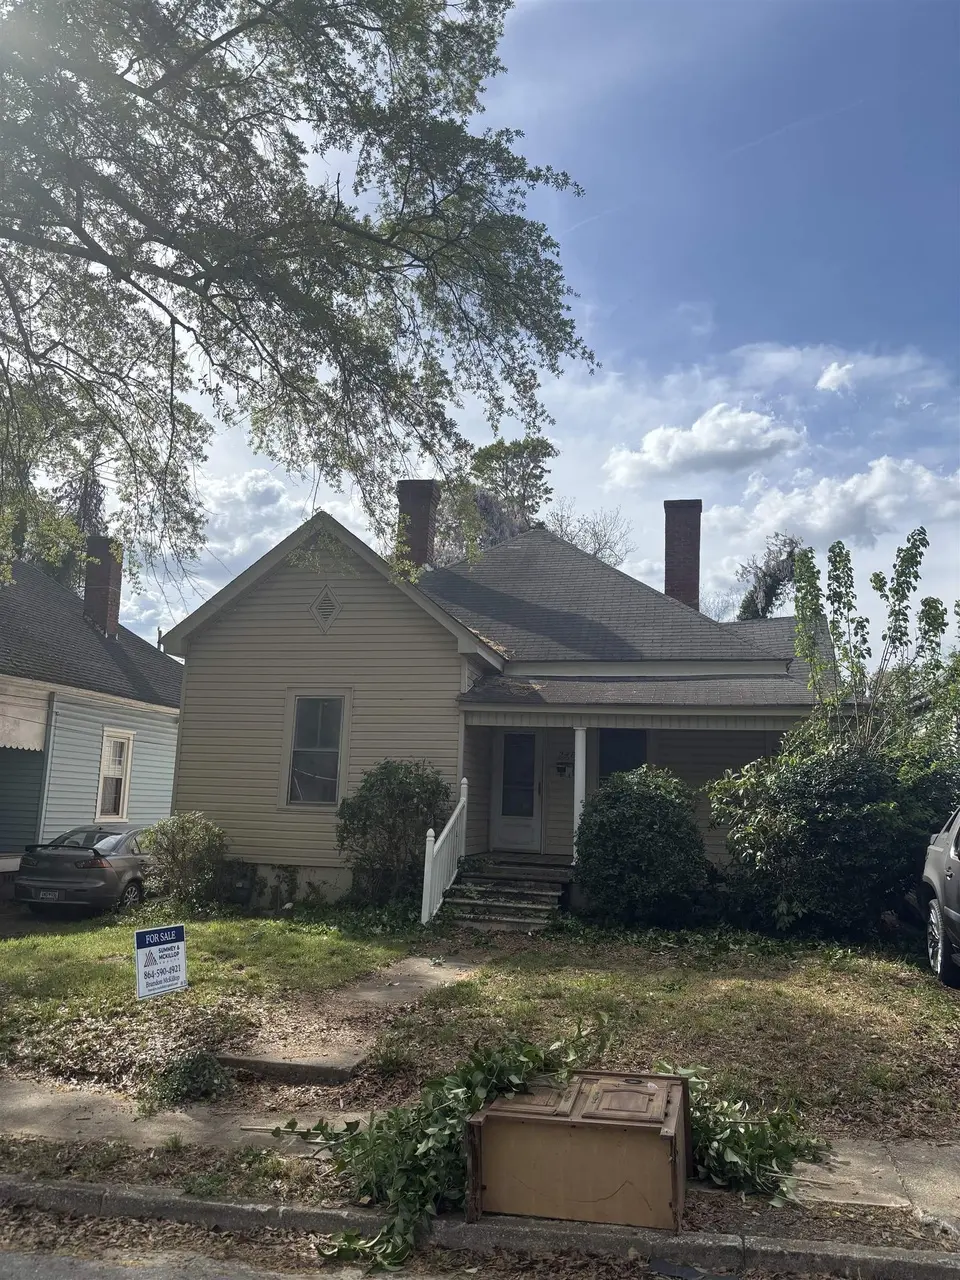
248 Rigby Ave · Spartanburg, SC
Flood risk 1/10 · Minimal
- FEMA flood zone
- X (unshaded)
- Chance of flooding over 30 yrs
- 0.0%
- Est. flood insurance / yr
- $507 – $1,088
Fire risk 2/10 · Minimal
- Est. fire insurance / yr
- $783 – $1,453
Heat risk 6/10 · Moderate
- Hot days now (above 105°F)
- 7 days/yr
- Hot days in 30 yrs
- 16 days/yr
Wind risk 2/10 · Minimal
- Chance of severe wind over 30 yrs
- 2.0%
Air-quality risk 4/10 · Minor
- Unhealthy air days now
- 4 days/yr
- Unhealthy air days in 30 yrs
- 4 days/yr
Risk factors via First Street. Map © Google.
Why this score? — see what drove the B grade
The composite is a weighted blend of 9 inputs, each scored 0–100. Each bar is that input's sub-score; the figure is the points it added to the 100-point composite (weight × sub-score).
- Cash flow +30.0/30.0
- 1% rule +10.0/10.0
- DSCR +10.0/10.0
- ARV discount +7.5/15.0
- Livability +3.8/5.0
- Rent growth +3.4/5.0
- Schools +3.1/10.0
- Condition / age +2.5/5.0
- Appreciation +0.0/10.0
$97,500
🖨 Deal sheet 📄 Offer letter ✓ Due diligence
Listing remarks
Investor special in a prime Spartanburg location! 248 Rigby St is a 3BR/1BA home just a short walk to downtown shops, dining, and amenities. House has a ton of character and curb appeal with the wrap around porch, tall ceilings and strong potential for renovation. Property needs significant work and is being sold as-is—ideal for investors, flippers, or cash buyers looking for their next project. Great opportunity to add value in a growing area! Will not qualify for conventional financing. Please be careful in back bedroom with floor damage from roof leak that has since been patched. Property sold at the 2020 delinquent tax sale. Agent owned.
Key facts
- Wrap around porch
- Tall ceilings
- 6,534 sq ft lot
Tags
Property features AI
Finance
- Other: Directions: From downtown Spartanburg take Church St. south to E Lee St. TL on E Lee St. This becomes S Converse. TR on Rigby. House on right.
- Financial info: Property tax approximately $2,178 annually
- HOA & community: HOA/community details not specified
Exterior
- Parking: Parking details not specified
- Security: Security details not specified
- Utilities: Utilities details not specified
- Home design: Single-family residence; Residential property; One story
- Construction: Construction details not specified; Year built not specified
- Exterior features: Lot dimensions approximately 45 x 151; Lot area about 0.15 acre
Interior
- Kitchen: Kitchen details not specified
- Bedrooms: Bedrooms not specified
- Flooring: Flooring details not specified
- Bathrooms: 1 full bathroom
- Heating & cooling: Heating and cooling details not specified
- Interior features: One-level living
- Laundry & utility: Laundry/utility details not specified
Neighborhood map
What this means for you Summary
Snapshot
- This is a 4-bed/1.0-bath single-family listed at $98k.
Deal economics
- At list price, monthly cash flow is $634 ($8k/yr) — positive.
- The deal already cash-flows at list — no discount required.
- Meets the 1% rule at list price ($2k rent vs $98k).
- Recommended offer: $95k (3.0% below list) — sets the bar for market timing.
- Cap rate 14.1% vs local median 3.9% in Spartanburg — top-decile yield for the area; either an underpriced asset or a hidden risk that comps aren't pricing in. Stress-test before assuming the spread holds.
Location & tenants
- Location reads 76/100 on livability (#24 in SC, #3,679 nationally) — a middle-class / working-renter tenant base. Strengths: amenities A+, commute A+, cost of living A+; Watch: crime F, employment F.
- Spartanburg 07 (urban): math 34% / reading 41% proficiency, ranked #39 of 80 in SC (top 49%) — families likely to look elsewhere, expect single-tenant / working-renter base with shorter leases; 62% free/reduced lunch — lower-income household profile, screen leases tightly.
- Zoned schools: Mary H. Wright Elementary (math 22% / reading 22%, grade F, #475 of 597 statewide, top 81%, 455 students, 100% FRL); Spartanburg High (math 67% / reading 79%, grade B+, #44 of 196 statewide, top 23%, 2,056 students, 85% FRL) — zoned schools average 93% FRL vs 62% district-wide (31 pts higher); higher-poverty schools than district average — tighter screening recommended.
- Market conditions: Rents rising (+3.5%/yr); 234 active listings in the ZIP; 14 comparable units currently listed for rent nearby; rentals at typical pace (median 22d on market — plan ~3-4 weeks tenant-placement turnaround); lower-income renter base — watch delinquency; 3,129 units permitted in Spartanburg County in 2024 (40 in 5+ unit buildings).
- At $1,731/mo this rent would consume 50% of the median local household income ($41k/yr) (locally 1064% of renters already pay >50% of income on rent) — very limited rent-growth headroom before tenants either downsize or default.
Forward outlook
- Local home prices are declining (-3.0%/yr); year-one equity from $674 of loan paydown is wiped out by about $3k of value loss. Plan a longer hold.
- Spartanburg County population projected at +18% by 2050 — long-run rental-demand tailwind backs the buy-and-hold thesis.
- At projected returns (-3.0% appreciation + 3.5% rent growth), your $27k cash investment doubles in ~5 years — after that, you're playing with house money.
Negotiation context
- It's been on market 50 days — a 3% lower offer ($95k) is reasonable based on typical stale-listing flexibility.
Risks & watch-outs
- Watch-outs: built in 1910 — expect roof / HVAC / electrical / plumbing capex.
- Climate carrying-cost: extreme-heat days projected 7→16/yr by 2055 (HVAC capex compounding) — expect insurance premiums to compound above CPI over the hold.
Questions for the listing agent
- It's been on market 50 days. Have you received any prior offers? Is the seller open to a 3% concession, seller financing, or rate buy-down credit?
- Built in 1910 — when were the roof, HVAC, electrical panel, plumbing, and water heater last replaced?
- Is there a deadline driving the sale (1031 exchange, divorce, estate, relocation)? That informs how much negotiation room exists.
- Schools are D-rated, which usually means shorter tenancies and higher turnover. Who's the typical renter profile here, and what's been the actual vacancy rate?
- Crime grade is F in this area — have there been break-ins, vandalism, or insurance claims at this property in the last 3 years? What carrier currently insures it and at what premium?
- What's the average days-on-market for RENTAL listings here right now (not sales)? A rising rental-DOM trend means longer vacancies and softer asking-rent achievability than the comps imply.
- What's the recent tenant-quality profile in this submarket — average credit score on applications, eviction rate, late-payment / NSF rate, and stable-employment percentage? A property-management company in the area should have these aggregated.
- How much new for-sale + rental construction is in the pipeline within 1–3 miles? Heavy new supply typically softens prices + rents 12–24 months out; constrained supply supports both.
Investment metrics
- 1% rule
- 1.78% ✓
- Cap rate
- 14.09%
- Cash-on-cash
- 27.86%
- DSCR
- 2.24
- GRM
- 4.7
CMA / ARV
- ARV (on-the-fly)
- $215,096
- Comps found
- 12
Show comp detail 12 sales within ~0.75 mi
| Address | Dist | Beds/Ba | Sqft | Sold | Price | $/sf | Match |
|---|---|---|---|---|---|---|---|
| 245 Rigby Ave | 0.03mi | 3/2.0 (-1) | 1,188 (-11%) | 8mo | $180,000 | $152 | 64 |
| 405 E Hampton Ave | 0.20mi | 3/2.0 (-1) | 1,237 (-7%) | 7mo | $198,900 | $161 | 64 |
| 386 S Converse St | 0.13mi | 3/2.0 (-1) | 1,253 (-6%) | 14mo | $245,000 | $196 | 63 |
| 529 Hampton Dr | 0.54mi | 3/2.0 (-1) | 1,366 (+2%) | 1mo | $247,000 | $181 | 61 |
| 197 Brookwood Ter | 0.44mi | 3/1.0 (-1) | 1,369 (+2%) | 14mo | $225,000 | $164 | 59 |
| 432 Virginia St | 0.68mi | 3/1.0 (-1) | 1,374 (+3%) | 2mo | $154,500 | $112 | 57 |
| 235 Brookwood Ter | 0.50mi | 3/2.0 (-1) | 1,361 (+2%) | 11mo | $205,000 | $151 | 55 |
| 322 Brown Ave | 0.07mi | 3/2.5 (-1) | 1,513 (+13%) | 12mo | $267,000 | $176 | 53 |
| 199 Brookwood Ter | 0.45mi | 3/1.0 (-1) | 1,453 (+9%) | 9mo | $202,000 | $139 | 52 |
| 437 Saint Andrews St | 0.65mi | 3/1.0 (-1) | 1,399 (+5%) | 6mo | $112,000 | $80 | 51 |
| 298 Marion Ave | 0.40mi | 4/2.5 | 1,530 (+14%) | 12mo | $260,000 | $170 | 42 |
| 129 George St | 0.72mi | 3/2.0 (-1) | 1,278 (-4%) | 14mo | $199,900 | $156 | 38 |
Match score weights: distance 35% · size 25% · config 20% · recency 20%. Top-matched comps best support the ARV.
Projected returns pro-forma
-3.0% appreciation · 3.46% rent growth · sell at horizon
- IRR
- 22.6%
- Equity multiple
- 1.93×
- Total profit
- $25,436
- Equity at exit
- $14,538
- IRR
- 30.9%
- Equity multiple
- 3.85×
- Total profit
- $77,718
- Equity at exit
- $8,430
Cash invested: $27,300 (down + closing). Projections, not guarantees.
Landlord ↔ Tenant lean methodology
- Overall (STATE)
- 90 Strongly Landlord-Friendly
- State South Carolina
- 90 Strongly Landlord-Friendly · R+6
- County
- — inherits STATE
- City
- — inherits STATE
ZIP-level market 29306
- Home prices YoY
- -29.9%
- Rents YoY
- 3.5%
- Active inventory
- 234
- Price-to-rent
- 4.7×
Monthly cashflow live
- Estimated rent
- $1,731 high interval (Pro) →
- Mortgage (P&I)
- −$511
- Tax from tax record
- −$182 /mo · $2,178/yr
- Insurance
- −$41
- HOA
- −$0
- Vacancy / Maint / Mgmt
- −$363
- Net cashflow
- $634
Break-even live
UW: 25.0% down · 7.5% · 30yr · 1.5% tax · 5.0% vac · 8.0% maint · 8.0% mgmt
Financing live
Cash to close
- Down payment
- $24,375
- Closing costs
- $2,925
- Reserves months
- —
- Total cash needed
- —
Loan-product check · same deal, 3 products live
Conventional
25% down · 7.5% · 30yr
- Down + closing
- —
- Monthly P&I
- —
- Monthly cashflow
- —
- DSCR
- —
- Eligible?
- —
Personal DTI + credit; lowest rate.
DSCR
20% down · 8.5% · 30yr
- Down + closing
- —
- Monthly P&I
- —
- Monthly cashflow
- —
- DSCR
- —
- Eligible?
- —
No personal income docs; deal must DSCR.
Hard money
10% down · 12.0% · 12mo
- Down + closing
- —
- Monthly P&I
- —
- Monthly cashflow
- —
- DSCR
- —
- Eligible?
- —
Short-term bridge; refi at stabilization.
Rent comps 14 comps
| Address | Beds | Baths | Sqft | Rent | $/sqft | DOM | Units | Dist |
|---|---|---|---|---|---|---|---|---|
| 249 E Hampton Ave Spartanburg, SC | 3.0 | 2.0 | 1450 | $1,475 | $1.02 | 21d | 1 | 0.22mi |
| 318 Alexander Ave Spartanburg, SC | 4.0 | 2.0 | 1480 | $1,695 | $1.15 | 21d | 1 | 0.33mi |
| 196 Silver Hill St Spartanburg, SC | 3.0 | 3.0 | 1492 | $1,900 | $1.27 | 21d | 1 | 0.69mi |
| 201 N Liberty St Spartanburg, SC | 3.0 | 1.0–2.0 | 1153 | $2,330 | $2.02 | 14d | 32 | 0.75mi |
| 124 Lucky Penny Ln Spartanburg, SC | 3.0 | 2.5 | 1580 | $1,708 | $1.08 | 21d | 1 | 1.01mi |
| 163 Avant St Spartanburg, SC | 3.0 | 2.5 | 1580 | $1,708 | $1.08 | 21d | 1 | 1.02mi |
| 128 Oakwood Ave Spartanburg, SC | 3.0 | 2.5 | 1580 | $1,708 | $1.08 | 14d | 1 | 1.04mi |
| 717 Connecticut Ave Spartanburg, SC | 3.0 | 1.0 | 1320 | $1,895 | $1.44 | 14d | 1 | 1.19mi |
| 500 Howard St Spartanburg, SC | 1.0–3.0 | 1.0–2.0 | 999 | $1,650 | $1.65 | 14d | 1 | 1.20mi |
| 515 Howard St Spartanburg, SC | 3.0–4.0 | 2.5–3.5 | 1729 | $2,195 | $1.27 | 14d | 70 | 1.22mi |
| 488 Brawley St Unit B Spartanburg, SC | 3.0 | 2.5 | 1200 | $1,300 | $1.08 | 14d | 1 | 1.24mi |
| 522 Pennwood Dr Spartanburg, SC | 3.0 | 1.0 | 1153 | $1,400 | $1.21 | 21d | 1 | 1.35mi |
| 235 High St Spartanburg, SC | 3.0 | 1.5 | 1726 | $1,650 | $0.96 | 21d | 1 | 1.41mi |
| 458 Arch St Spartanburg, SC | 4.0 | 1.5 | 1380 | $1,325 | $0.96 | 21d | 1 | 1.45mi |
Listing history 5 events
-
2026-06-02days on market $97,500 Active 50 DOM
-
2026-06-01days on market $97,500 Active 49 DOM
-
2026-05-31days on market $97,500 Active 48 DOM
-
2026-05-30days on market $97,500 Active 47 DOM
-
2026-04-13$97,500 Active
ⓘ Source: listings_history table (triggers on properties + properties_extension) + one-shot
backfill from property_details.listing_events for pre-trigger history.
Tax reassessment forecast SC · Resets to sale price
- Current annual tax
- $2,178 · $182/mo
- Projected year-2 tax
- $2,178 · $182/mo
- Expected delta
- $0/yr ($0/mo · 0.0%)
ⓘ Screening estimate from a state-policy table — verify with the county assessor before closing.
Climate risk First Street
- Flood 1/10 Low FEMA zone X (unshaded) · 0% chance over 30 yrs
- Wildfire 2/10 Low
- Heat 6/10 Major 7 d/yr ≥105°F today · 16 d/yr by 30 yrs out
- Wind 2/10 Low 2% chance of damaging wind over 30 yrs
- Air quality 4/10 Moderate 4 unhealthy d/yr today · 4 by 30 yrs out
Nearby sold comps map
Loading sold comps map…
Walkable amenities ~0.75 mi
Loading nearby amenities…
Taxation est. · year 1
- Rental income
- $20,768
- − Mortgage interest
- −$5,462
- − Property taxes
- −$2,178
- − Insurance
- −$488
- − Repairs & maintenance
- −$1,661
- − Management
- −$1,661
- − Depreciation
- −$2,836
- Taxable income
- $6,482
- Est. tax owed @ 24.0%
- −$1,556
- After-tax cash flow
- $6,050/yr
For passive investors: Depreciation is non-cash, so a rental often shows a tax loss while cash-flowing — sheltering income. Rental losses are passive: they offset passive income freely, and up to $25,000/yr can offset ordinary (W-2) income if you actively participate and your MAGI is under $100k (phasing out to $0 by $150k); unused losses carry forward. On sale, claimed depreciation is recaptured at up to 25%, and gains may owe capital-gains tax (a 1031 exchange can defer both). Figures are a year-1 estimate at your 24.0% rate — not tax advice; consult a CPA.
Schools (NCES district)
- District
- Spartanburg 07
- NCES district ID
- 4503660
- Math proficiency
- 34% ▼ -1.00%
- Reading proficiency
- 41% ▼ -1.00%
- Median HH income
- $35,825
- Composite
- 31.04/100
- National rank
- #6087
- State rank
- #39 of 80 in SC
Livability — Spartanburg
- Score
- 76/100
- State rank
- #24
- US rank
- #3679
Category grades
Schools grade is shown separately in the Schools card above.
Census & demographics
- Census place
- Spartanburg, SC
- County
- Spartanburg County · 258,607 people
- City population
- 120,406
- Metro
- Spartanburg, SC
- Population (ZIP)
- 16,714
- Household income
- $41,356
- Rent vs Own
- Severe rent burden
- 1064.0
Population outlook (Spartanburg County) Hauer SSP2
- Today (2025)
- 325,495 people
- By 2030
- 338,800 · +4.1%
- By 2040
- 363,471 · +11.7%
- By 2050
- 384,156 · +18.0%
- By 2075
- 430,137 · +32.1%
- By 2100
- 442,733 · +36.0%
Race, ethnicity, and origin ACS 2023
- Neighborhood character
- Diverse neighborhood (Simpson 0.61)
- Race & ethnicity
- Black 50% White 36% Hispanic / Latino 10% Two or more races 9% Asian 1%
- Hispanic origin (detail)
- Mexican 7% Puerto Rican 2%
- Common ancestry
- Slovak 1% Serbian 1% Iranian 1%
- Foreign-born
- 7% · Canada
- Languages at home
- 90% English-only · Spanish 7% Other Indo-European 2%
Political lean MEDSL · Spartanburg
- 2024 margin
- Solid R (+33.6) · D 32.6% · R 66.2% · Other 1.2%
- 2008→2024 swing
- -12.0pp toward R · 2008: -21.6pp · 2024: -33.6pp
- All cycles
- 2024: R+33.6 2020: R+27.3 2016: R+30.0 2012: R+23.1 2008: R+21.6
Not yet ingested
- Civics
- —
Market trends
- HPI YoY
- ▼ -90.67%
- Current HPI
- 213.1266
- Rent YoY
- ▲ 3.46%
- Metro
- Spartanburg, SC
- State GDP YoY
- ▲ 4.51%
- F500 in state
- 2
Industry mix (Fortune 500 HQ in SC)
| Industry | F500 HQs | Revenue |
|---|---|---|
| Packaging | 1 | $7B |
|
||
Price history
1 event — show timeline
- 2026-04-13 Listed $97,500 SPMLS
Property tax history
+17.2%/yrLatest (2025): $2,178 · +0.6% YoY. Source: county tax records.
Cash-flow waterfall
monthlySold comps — $/sqft
last 12 mo · ≤1 miLoading sold comps…