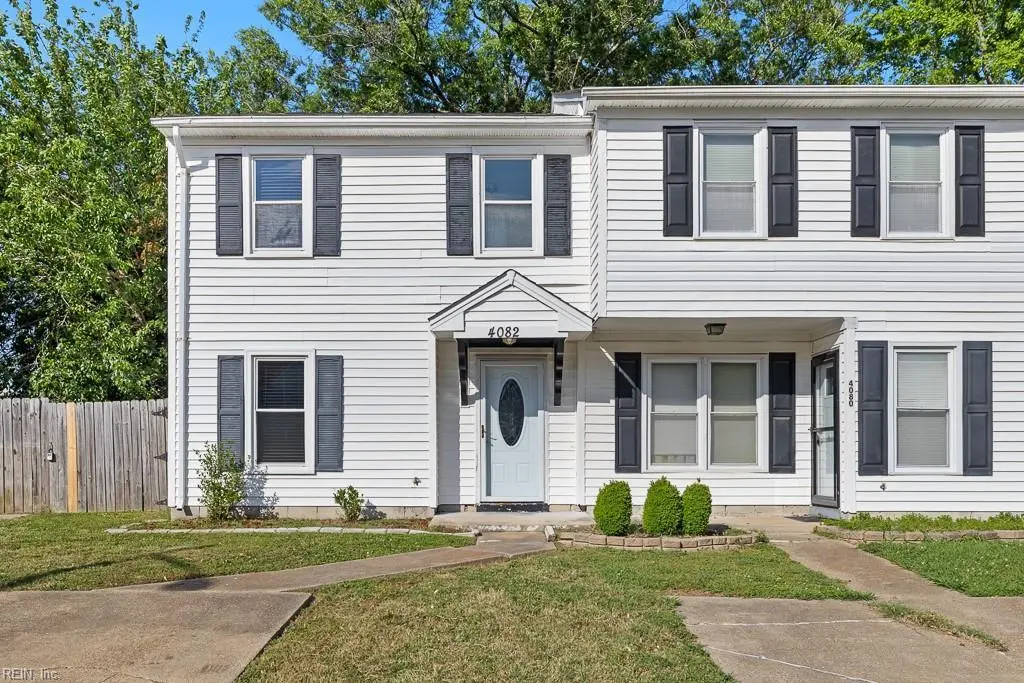
4082 Concordia Way · Virginia Beach, VA
Flood risk 1/10 · Minimal
- FEMA flood zone
- X (unshaded)
- Chance of flooding over 30 yrs
- 0.0%
- Est. flood insurance / yr
- $507 – $1,088
Fire risk 1/10 · Minimal
- Est. fire insurance / yr
- $666 – $1,236
Heat risk 9/10 · Severe
- Hot days now (above 104°F)
- 7 days/yr
- Hot days in 30 yrs
- 16 days/yr
Wind risk 8/10 · Major
- Chance of severe wind over 30 yrs
- 98.0%
Air-quality risk 3/10 · Minor
- Unhealthy air days now
- 2 days/yr
- Unhealthy air days in 30 yrs
- 4 days/yr
Risk factors via First Street. Map © Google.
Why this score? — see what drove the D grade
The composite is a weighted blend of 9 inputs, each scored 0–100. Each bar is that input's sub-score; the figure is the points it added to the 100-point composite (weight × sub-score).
- Cash flow +11.1/30.0
- ARV discount +6.6/15.0
- Schools +6.4/10.0
- Rent growth +4.9/5.0
- Livability +4.2/5.0
- DSCR +3.2/10.0
- 1% rule +2.7/10.0
- Condition / age +2.5/5.0
- Appreciation +0.0/10.0
$274,900
🖨 Deal sheet (PDF) 📄 Offer letter ✓ Due diligence
Listing remarks
This centrally located 3 bedroom end-unit townhouse has been thoughtfully upgraded throughout with a beautifully updated kitchen with granite countertops and stainless steel appliances, bathrooms with sleek modern fixtures and a large living area with fireplace and rich dark LVP flooring adding warmth and elegance. Enjoy indoor-outdoor living with charming French doors that open to a fenced backyard—ideal for relaxing, gardening, or hosting gatherings. As an end unit, you’ll appreciate the added privacy and extra natural light. Move-in ready and ideally situated near shopping, dining, and major routes—this is one you won’t want to miss!
Key facts
- Large living area
- Updated kitchen
- Granite countertops
Tags
Property features AI
Finance
- HOA & community: Part of Green Run Homeowners Association; HOA fee: $45 monthly; Community pool
Exterior
- Parking: Off-street parking; Driveway space
- Utilities: City/County water; City/County sewer; Electric water heater
- Home design: Attached townhouse; 2 stories; 2 living levels; Slab foundation; Simple ownership
- Construction: Asphalt shingle roof
- Exterior features: Patio; Vinyl siding; Back yard fully fenced with privacy fencing
Interior
- Kitchen: Dishwasher; Disposal; Microwave; Electric range; Refrigerator
- Bedrooms: No bedroom and full bathroom on first floor; Total rooms: 6
- Flooring: Carpet; Ceramic; Laminate
- Bathrooms: 1 full bathroom; 1 half bathroom
- Heating & cooling: Heat pump heating; Central air conditioning
- Interior features: Ceiling fan; Wood fireplace; Window treatments; Assigned storage; Breakfast area; Utility closet
- Laundry & utility: Washer; Dryer
Neighborhood map
What this means for you Summary
Snapshot
- This is a 3-bed/1.5-bath townhouse listed at $275k.
Deal economics
- At list price, monthly cash flow is $-112 ($-1k/yr) — negative.
- To cash-flow at today's rent, offer at most $255k (7.2% below list).
- To meet the 1% rule (rent ≥ 1% of price), the offer needs to be $212k (22.7% below list).
- Recommended offer: $212k (22.7% below list) — sets the bar for 1% rule.
- Cap rate 5.8% vs local median 3.5% in Virginia Beach — top-decile yield for the area; either an underpriced asset or a hidden risk that comps aren't pricing in. Stress-test before assuming the spread holds.
Location & tenants
- Location reads 83/100 on livability (#38 in VA, #880 nationally) — a professional / high-income tenant draw. Strengths: amenities A+, employment A+, housing A+; Watch: cost of living C-, commute F.
- Va Beach City Public School District (urban): math 69% / reading 78% proficiency, ranked #10 of 131 in VA (top 8%) — strong family-tenant draw, lease renewals of 3-5y typical.
- Zoned schools: Parkway Elementary (math 37% / reading 52%, grade F, #827 of 1,108 statewide, top 77%, 469 students, 98% FRL); Larkspur Middle (math 60% / reading 72%, grade A-, #113 of 342 statewide, top 33%, 1,536 students, 60% FRL); Green Run High (math 64% / reading 69%, grade B, #195 of 319 statewide, top 62%, 1,517 students, 69% FRL) — zoned schools average 76% FRL vs 28% district-wide (48 pts higher); higher-poverty schools than district average — tighter screening recommended.
- Zoned-school proficiency averages 59% at this address vs 74% district-wide (-14 pts) — the specific schools serving this property underperform the Va Beach City Public School District average; the district grade overstates school quality for this exact location.
- Market conditions: Rents rising fast (+9.7%/yr); 103 active listings in the ZIP; 40 comparable units currently listed for rent nearby; rentals at typical pace (median 17d on market — plan ~3-4 weeks tenant-placement turnaround); solid renter incomes; 666 units permitted in Virginia Beach city in 2024 (347 in 5+ unit buildings).
Forward outlook
- Local home prices are declining (-3.0%/yr); year-one equity from $2k of loan paydown is wiped out by about $8k of value loss. Plan a longer hold.
- Virginia Beach County population projected at +6% by 2050 — modest demand growth; plan on rents tracking national, not racing it.
Negotiation context
- It's been on market 21 days — a 2% lower offer ($271k) is reasonable based on typical stale-listing flexibility.
- 3 sale attempts since 4y ago with the ask held roughly flat each time — persistent listings suggest the price (not the market) is what's stuck; bring a comps-based counter.
- Current owner paid $203k; 35% above their basis — modest negotiation headroom, anchor on the comps not their cost.
Risks & watch-outs
- Climate carrying-cost: severe wind risk, 98% chance of damaging wind over 30y; extreme-heat days projected 7→16/yr by 2055 (HVAC capex compounding) — expect insurance premiums to compound above CPI over the hold.
Questions for the listing agent
- What do current leases actually rent for vs. the listed asking? Can we see a recent rent roll and the last 12 months of T-12 income?
- What does the HOA fee cover, when was the last increase, and are there any pending special assessments or reserve-fund shortfalls?
- Is there a deadline driving the sale (1031 exchange, divorce, estate, relocation)? That informs how much negotiation room exists.
- Schools are A-rated — typically a magnet for longer-tenancy family renters. What's the average tenant stay here, and is there a school-zone premium baked into asking?
- The area grade is low — what's the realistic commute time and amenity access for the typical tenant pool here? Any planned neighborhood developments (good or bad) we should know about?
- What's the average days-on-market for RENTAL listings here right now (not sales)? A rising rental-DOM trend means longer vacancies and softer asking-rent achievability than the comps imply.
- What's the recent tenant-quality profile in this submarket — average credit score on applications, eviction rate, late-payment / NSF rate, and stable-employment percentage? A property-management company in the area should have these aggregated.
- How much new for-sale + rental construction is in the pipeline within 1–3 miles? Heavy new supply typically softens prices + rents 12–24 months out; constrained supply supports both.
Investment metrics
- 1% rule
- 0.77% ✗
- Cap rate
- 5.81%
- Cash-on-cash
- -1.74%
- DSCR
- 0.92
- GRM
- 10.8
CMA / ARV
- ARV (on-the-fly)
- $269,248
- Comps found
- 12
Show comp detail 12 sales within ~0.75 mi
| Address | Dist | Beds/Ba | Sqft | Sold | Price | $/sf | Match |
|---|---|---|---|---|---|---|---|
| 4082 Concordia Way | 0.00mi | 3/1.5 | 1,202 (0%) | 1mo | $275,000 | $229 | 99 |
| 3614 Windmill Dr | 0.39mi | 3/1.5 | 1,146 (-5%) | 3mo | $240,000 | $209 | 72 |
| 1320 Pershing Ct | 0.55mi | 3/2.0 | 1,210 (+1%) | 3mo | $279,000 | $231 | 69 |
| 3640 Sylvan Ct | 0.70mi | 3/1.5 | 1,158 (-4%) | 4mo | $259,900 | $224 | 58 |
| 3658 Sylvan Ct | 0.73mi | 3/1.5 | 1,158 (-4%) | 4mo | $243,000 | $210 | 57 |
| 1315 Ivywood Rd | 0.60mi | 2/2.0 (-1) | 1,162 (-3%) | 4mo | $230,000 | $198 | 56 |
| 1379 Ivywood Rd | 0.66mi | 2/2.0 (-1) | 1,162 (-3%) | 1mo | $225,000 | $194 | 56 |
| 807 Foxmoore Ct | 0.52mi | 2/2.5 (-1) | 1,125 (-6%) | 2mo | $260,000 | $231 | 54 |
| 1509 Penrose Arch Unit 14E | 0.68mi | 2/2.0 (-1) | 1,165 (-3%) | 2mo | $225,000 | $193 | 54 |
| 808 Federal Ct | 0.54mi | 2/2.5 (-1) | 1,124 (-6%) | 1mo | $265,000 | $236 | 54 |
| 1419 Ivywood Rd | 0.71mi | 2/2.0 (-1) | 1,162 (-3%) | 4mo | $229,900 | $198 | 51 |
| 809 Christa Ct | 0.63mi | 2/2.5 (-1) | 1,124 (-6%) | 2mo | $260,000 | $231 | 50 |
Match score weights: distance 35% · size 25% · config 20% · recency 20%. Top-matched comps best support the ARV.
Projected returns pro-forma
-3.0% appreciation · 8.0% rent growth · sell at horizon
- IRR
- -14.1%
- Equity multiple
- 0.47×
- Total profit
- $-40,461
- Equity at exit
- $40,988
- IRR
- 1.0%
- Equity multiple
- 1.09×
- Total profit
- $6,560
- Equity at exit
- $23,768
Cash invested: $76,972 (down + closing). Projections, not guarantees.
Landlord ↔ Tenant lean methodology
- Overall (STATE)
- 55 Moderately Landlord-Leaning
- State Virginia
- 55 Moderately Landlord-Leaning · D+2
- County
- — inherits STATE
- City
- — inherits STATE
ZIP-level market 23453
- Home prices YoY
- -13.4%
- Rents YoY
- 9.7%
- Active inventory
- 103
- Price-to-rent
- 10.8×
Monthly cashflow live
- Estimated rent
- $2,124 high interval (Pro) →
- Mortgage (P&I)
- −$1,442
- Tax from tax record
- −$188 /mo · $2,259/yr
- Insurance
- −$115
- HOA
- −$45
- Lot rent
- −$0
- Vacancy / Maint / Mgmt
- −$446
- Net cashflow
- $-112
Break-even live
Sensitivity live
| Price | -10% $44 | -5% $-34 | +0% $-112 | +5% $-189 | +10% $-267 |
|---|---|---|---|---|---|
| Rent | -10% $-279 | -5% $-195 | +0% $-112 | +5% $-28 | +10% $56 |
| Rate | -1.0pp $27 | -0.5pp $-42 | base $-112 | +0.5pp $-183 | +1.0pp $-255 |
UW: 25.0% down · 7.5% · 30yr · 1.5% tax · 5.0% vac · 8.0% maint · 8.0% mgmt
Financing live
Cash to close
- Down payment
- $68,725
- Closing costs
- $8,247
- Reserves months
- —
- Total cash needed
- —
Loan-product check · same deal, 3 products live
Conventional
25% down · 7.5% · 30yr
- Down + closing
- —
- Monthly P&I
- —
- Monthly cashflow
- —
- DSCR
- —
- Eligible?
- —
Personal DTI + credit; lowest rate.
DSCR
20% down · 8.5% · 30yr
- Down + closing
- —
- Monthly P&I
- —
- Monthly cashflow
- —
- DSCR
- —
- Eligible?
- —
No personal income docs; deal must DSCR.
Hard money
10% down · 12.0% · 12mo
- Down + closing
- —
- Monthly P&I
- —
- Monthly cashflow
- —
- DSCR
- —
- Eligible?
- —
Short-term bridge; refi at stabilization.
Rent comps 40 comps
| Address | Beds | Baths | Sqft | Rent | $/sqft | DOM | Units | Dist |
|---|---|---|---|---|---|---|---|---|
| 3596 Windmill Dr Virginia Beach, VA | 2.0 | 1.5 | 1088 | $1,850 | $1.70 | 0d | 1 | 0.34mi |
| 3560 Windmill Dr Virginia Beach, VA | 3.0 | 1.5 | 1080 | $2,000 | $1.85 | 0d | 1 | 0.37mi |
| 3638 Windmill Dr Virginia Beach, VA | 2.0 | 1.0 | 934 | $1,695 | $1.81 | 13d | 1 | 0.41mi |
| 846 Crashaw St Virginia Beach, VA | 2.0 | 2.0 | 1346 | $1,895 | $1.41 | 17d | 1 | 0.53mi |
| 807 Foxmoore Ct Virginia Beach, VA | 2.0 | 2.5 | 1125 | $2,000 | $1.78 | 5d | 1 | 0.54mi |
| 3528 Dublin Ct Virginia Beach, VA | 2.0 | 1.0 | 752 | $1,700 | $2.26 | 14d | 1 | 0.65mi |
| 1012 Grassland Ct Virginia Beach, VA | 3.0 | 2.0 | 1021 | $2,050 | $2.01 | 26d | 1 | 0.72mi |
| 1523 Penrose Arch Virginia Beach, VA | 2.0 | 2.0 | 1126 | $1,550 | $1.38 | 6d | 1 | 0.72mi |
| 3500 Irvington Ct Virginia Beach, VA | 2.0 | 2.0 | 999 | $2,000 | $2.00 | 26d | 1 | 0.73mi |
| 3816 Banyan Grove Ln Virginia Beach, VA | 1.0–3.0 | 1.0–2.0 | 1021 | $3,082 | $3.02 | 0d | 17 | 0.73mi |
| 1401 Wendfield Dr #103 Virginia Beach, VA | 3.0 | 1.5 | 1344 | $1,850 | $1.38 | 22d | 1 | 0.74mi |
| 724 Harbor Springs Trl Virginia Beach, VA | 2.0 | 2.0 | 1200 | $1,795 | $1.50 | 14d | 1 | 0.75mi |
| 3849 Clarendon Way Unit 1 Virginia Beach, VA | 2.0 | 2.5 | 1349 | $2,200 | $1.63 | 14d | 1 | 0.78mi |
| 3700 Snowdrift Cir Virginia Beach, VA | 1.0–3.0 | 1.0–2.0 | 887 | $2,599 | $2.93 | 26d | 1 | 0.79mi |
| 1404 Wendfield Dr #102 Virginia Beach, VA | 3.0 | 1.5 | 1344 | $2,000 | $1.49 | 26d | 1 | 0.79mi |
| 1404 Wendfield Dr #102 Virginia Beach, VA | 3.0 | 1.5 | 1344 | $2,000 | $1.49 | 6d | 1 | 0.79mi |
| 1404 Wendfield Dr Virginia Beach, VA | 3.0 | 1.5 | 1344 | $2,000 | $1.49 | 6d | 1 | 0.79mi |
| 1728 Vankar Dr #104 Virginia Beach, VA | 2.0 | 2.0 | 1293 | $2,495 | $1.93 | 10d | 1 | 0.79mi |
| 1728 Vankar Dr #307 Virginia Beach, VA | 2.0 | 2.0 | 1316 | $2,500 | $1.90 | 19d | 1 | 0.79mi |
| 1400 Dewitt Way Virginia Beach, VA | 2.0–3.0 | 2.0–2.5 | 1212 | $2,225 | $1.84 | 26d | 1 | 0.84mi |
| 3521 Sierra Arch Virginia Beach, VA | 3.0 | 1.5 | 1420 | $1,650 | $1.16 | 26d | 1 | 0.86mi |
| 4156 Clarendon Way Virginia Beach, VA | 2.0 | 2.5 | 1329 | $2,400 | $1.81 | 26d | 1 | 0.86mi |
| 4425 Duffy Dr Virginia Beach, VA | 2.0 | 2.5 | 1388 | $2,050 | $1.48 | 14d | 1 | 0.89mi |
| 1752 Halesworth Ln Virginia Beach, VA | 2.0 | 2.5 | 1324 | $2,190 | $1.65 | 26d | 1 | 0.90mi |
| 1752 Halesworth Ln Unit 1 Virginia Beach, VA | 2.0 | 2.5 | 1329 | $2,200 | $1.66 | 26d | 1 | 0.90mi |
| 713 Willow Lake Cir Virginia Beach, VA | 1.0–2.0 | 1.0–2.0 | 1041 | $2,475 | $2.38 | 26d | 1 | 0.95mi |
| 4581 Duffy Dr Virginia Beach, VA | 2.0 | 2.5 | 1388 | $2,100 | $1.51 | 23d | 1 | 0.95mi |
| 3702 Canadian Arch Virginia Beach, VA | 2.0 | 1.5 | 1100 | $1,700 | $1.55 | 6d | 1 | 1.04mi |
| 3517 Plum Cres Virginia Beach, VA | 3.0 | 2.0 | 1450 | $2,200 | $1.52 | 14d | 1 | 1.04mi |
| 3829 Shooting Star Dr Virginia Beach, VA | 4.0 | 1.5 | 1296 | $2,950 | $2.28 | 17d | 1 | 1.09mi |
| 3745 Edenberry Ct Virginia Beach, VA | 2.0 | 2.0 | 1044 | $1,899 | $1.82 | 6d | 1 | 1.09mi |
| 1434 Peony Arch Virginia Beach, VA | 3.0 | 2.0 | 1407 | $2,600 | $1.85 | 26d | 1 | 1.11mi |
| 3500 Green Garden Cir Virginia Beach, VA | 2.0 | 1.0 | 980 | $1,685 | $1.72 | 26d | 1 | 1.11mi |
| 4016 Richard Lee Ct Virginia Beach, VA | 3.0 | 1.5 | 1470 | $2,100 | $1.43 | 4d | 1 | 1.15mi |
| 629 Counselor Sq Virginia Beach, VA | 3.0 | 1.5 | 1326 | $1,995 | $1.50 | 26d | 1 | 1.16mi |
| 640 Counselor Sq Virginia Beach, VA | 3.0 | 1.5 | 1320 | $2,000 | $1.52 | 17d | 1 | 1.16mi |
| 726 Hayes Ave Virginia Beach, VA | 2.0 | 1.5 | 1008 | $1,700 | $1.69 | 26d | 1 | 1.16mi |
| 621 Chancery Sq Virginia Beach, VA | 3.0 | 1.0 | 1320 | $1,970 | $1.49 | 19d | 1 | 1.17mi |
| 1785 River Rock Arch Virginia Beach, VA | 3.0 | 2.0 | 1438 | $2,350 | $1.63 | 17d | 1 | 1.19mi |
| 3923 Lake Front Cir Virginia Beach, VA | 1.0–2.0 | 1.0 | 918 | $1,845 | $2.01 | 13d | 1 | 1.21mi |
HOA detail
- Monthly dues
- $45 · $540/yr
Listing history 10 events
-
2026-05-14status Under Contract
-
2026-04-28historical Active Under Contract
-
2026-04-23$274,900 Active
-
2024-02-23historical $1,650
-
2024-02-20$1,650
-
2022-02-28soldstatus $203,000
-
2022-02-16status Under Contract
-
2022-01-17historical Active Under Contract
-
2022-01-14$195,000 Active
-
2015-02-28price $149,900
ⓘ Source: listings_history table (triggers on properties + properties_extension) + one-shot
backfill from property_details.listing_events for pre-trigger history.
Tax reassessment forecast VA · Resets to sale price
- Current annual tax
- $2,259 · $188/mo
- Projected year-2 tax
- $2,259 · $188/mo
- Expected delta
- $0/yr ($0/mo · 0.0%)
ⓘ Screening estimate from a state-policy table — verify with the county assessor before closing.
Climate risk First Street
- Flood 1/10 Low FEMA zone X (unshaded) · 0% chance over 30 yrs
- Wildfire 1/10 Low
- Heat 9/10 Extreme 7 d/yr ≥104°F today · 16 d/yr by 30 yrs out
- Wind 8/10 Severe 98% chance of damaging wind over 30 yrs
- Air quality 3/10 Moderate 2 unhealthy d/yr today · 4 by 30 yrs out
Nearby sold comps map
Loading sold comps map…
Walkable amenities ~0.75 mi
Loading nearby amenities…
Taxation est. · year 1
- Rental income
- $25,487
- − Mortgage interest
- −$15,399
- − Property taxes
- −$2,259
- − Insurance
- −$1,374
- − Repairs & maintenance
- −$2,039
- − Management
- −$2,039
- − HOA
- −$540
- − Depreciation
- −$7,997
- Taxable loss
- −$6,161
- Est. tax savings @ 24.0%
- +$1,479
- After-tax cash flow
- $140/yr
For passive investors: Depreciation is non-cash, so a rental often shows a tax loss while cash-flowing — sheltering income. Rental losses are passive: they offset passive income freely, and up to $25,000/yr can offset ordinary (W-2) income if you actively participate and your MAGI is under $100k (phasing out to $0 by $150k); unused losses carry forward. On sale, claimed depreciation is recaptured at up to 25%, and gains may owe capital-gains tax (a 1031 exchange can defer both). Figures are a year-1 estimate at your 24.0% rate — not tax advice; consult a CPA.
Schools (NCES district)
- District
- Va Beach City Public School District
- NCES district ID
- 5103840
- Math proficiency
- 69% ▼ -19.00%
- Reading proficiency
- 78% ▼ -7.00%
- Median HH income
- $66,452
- Composite
- 63.81/100
- National rank
- #594
- State rank
- #10 of 131 in VA
Livability — Virginia Beach
- Score
- 83/100
- State rank
- #38
- US rank
- #880
Category grades
Schools grade is shown separately in the Schools card above.
Census & demographics
- Census place
- Virginia Beach, VA
- County
- Virginia Beach City · 448,227 people
- City population
- 448,227
- Metro
- Virginia Beach-Norfolk-Newport News, VA-NC
- Population (ZIP)
- 34,482
- Household income
- $93,838
- Rent vs Own
- Severe rent burden
- 799.0
Population outlook (Virginia Beach County) Hauer SSP2
- Today (2025)
- 480,401 people
- By 2030
- 491,221 · +2.3%
- By 2040
- 504,882 · +5.1%
- By 2050
- 508,847 · +5.9%
- By 2075
- 504,831 · +5.1%
- By 2100
- 465,867 · -3.0%
Race, ethnicity, and origin ACS 2023
- Neighborhood character
- Highly diverse neighborhood (Simpson 0.72)
- Race & ethnicity
- White 46% Black 22% Two or more races 14% Asian 12% Hispanic / Latino 10%
- Hispanic origin (detail)
- Mexican 2% Puerto Rican 3%
- Common ancestry
- Slovak 2% Romanian 2% Italian 1%
- Foreign-born
- 11% · Canada, China, Vietnam
- Languages at home
- 84% English-only · Tagalog/Filipino 6% Spanish 5% Other Indo-European 1%
Political lean MEDSL · Virginia Beach
- 2024 margin
- Toss-up / Even · D 50.7% · R 48.0% · Other 1.3%
- 2008→2024 swing
- +3.4pp toward D · 2008: -0.7pp · 2024: 2.6pp
- All cycles
- 2024: D+2.6 2020: D+5.4 2016: R+4.5 2012: R+2.5 2008: R+0.7
Not yet ingested
- Civics
- —
Market trends
- HPI YoY
- ▼ -52.96%
- Current HPI
- 341.8757
- Rent YoY
- ▲ 9.69%
- Metro
- Virginia Beach-Norfolk-Newport News, VA-NC
- State GDP YoY
- ▲ 2.40%
- F500 in state
- 50
Industry mix (Fortune 500 HQ in VA)
| Industry | F500 HQs | Revenue |
|---|---|---|
| Aerospace / Defense | 4 | $236B |
|
||
| Technology / Defense | 3 | $32B |
|
||
| Financial Services | 2 | $176B |
|
||
| Utilities | 2 | $27B |
|
||
| Insurance | 2 | $25B |
|
||
| Technology | 2 | $15B |
|
||
Price history
+83.4% since first listed10 events — show timeline
- 2026-05-14 Pending — REINMLS
- 2026-04-28 Contingent — REINMLS
- 2026-04-23 Listed $274,900 REINMLS
- 2024-02-23 Rental Removed $1,650 REINMLS
- 2024-02-20 Listed for Rent $1,650 REINMLS
- 2022-02-28 Sold (Public Records) $203,000 Public Records
- 2022-02-16 Pending — REINMLS
- 2022-01-17 Contingent — REINMLS
- 2022-01-14 Listed $195,000 REINMLS
- 2015-02-28 Price Changed $149,900 REINMLS
Property tax history
+4.7%/yrLatest (2025): $2,259 · +3.6% YoY. Source: county tax records.
Cash-flow waterfall
monthlySold comps — $/sqft
last 12 mo · ≤1 miLoading sold comps…