6635 Coulter Dr · Wylie, TX
Flood risk 1/10 · Minimal
- FEMA flood zone
- X (unshaded)
- Chance of flooding over 30 yrs
- 0.0%
- Est. flood insurance / yr
- $507 – $1,088
Fire risk 4/10 · Minor
- Est. fire insurance / yr
- $1,222 – $2,270
Heat risk 8/10 · Major
- Hot days now (above 110°F)
- 8 days/yr
- Hot days in 30 yrs
- 26 days/yr
Wind risk 6/10 · Moderate
- Chance of severe wind over 30 yrs
- 27.0%
Air-quality risk 3/10 · Minor
- Unhealthy air days now
- 3 days/yr
- Unhealthy air days in 30 yrs
- 3 days/yr
Risk factors via First Street. Map © Google.
Why this score? — see what drove the D grade
The composite is a weighted blend of 9 inputs, each scored 0–100. Each bar is that input's sub-score; the figure is the points it added to the 100-point composite (weight × sub-score).
- Cash flow +12.2/30.0
- ARV discount +8.8/15.0
- 1% rule +5.1/10.0
- Schools +4.2/10.0
- Condition / age +4.0/5.0
- DSCR +3.6/10.0
- Livability +3.5/5.0
- Rent growth +2.2/5.0
- Appreciation +0.0/10.0
$190,900
🖨 Deal sheet (PDF) 📄 Offer letter ✓ Due diligence
Listing remarks MLS
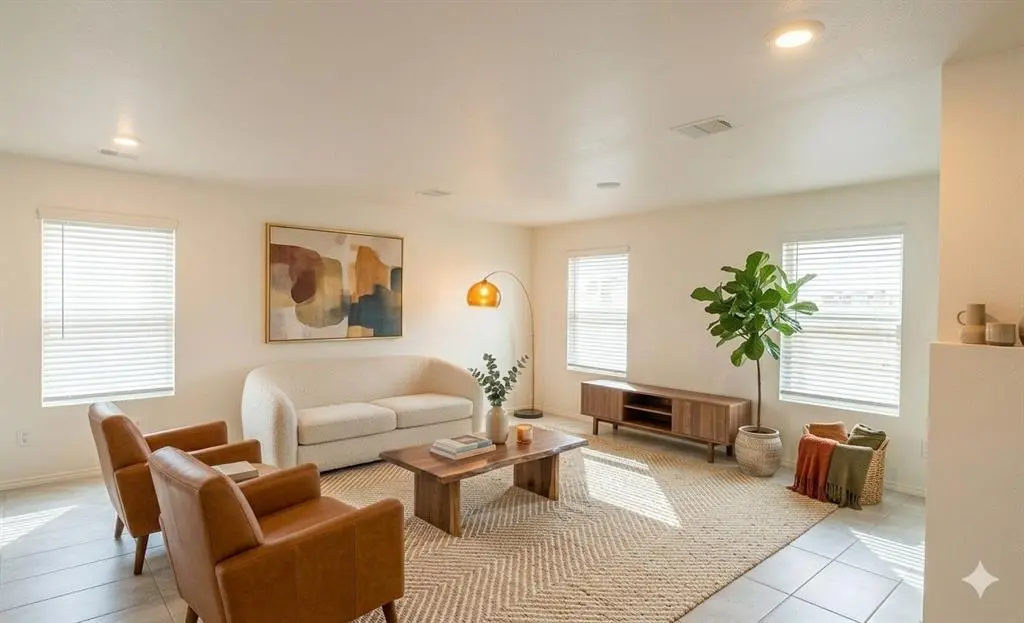
Step into the charm of this 3-bedroom, 2-bath home designed with first-time buyers in mind. Built in 2023 and thoughtfully refreshed with new bedroom flooring, energy-efficient exterior doors, and fresh paint throughout—it’s move-in ready and full of potential. Tucked into the growing community of Tillage Farms, this home is your blank canvas to create something special. Limited photos? Even better—come experience the warmth, flow, and light in person.
Key facts
- Fresh paint
- New bedroom flooring
- 3,311 sq ft lot
Tags
Neighborhood map
What this means for you Summary
Snapshot
- This is a 4-bed/2.0-bath single-family listed at $191k. Condition is rated good.
Deal economics
- At list price, monthly cash flow is $-38 ($-453/yr) — negative.
- To cash-flow at today's rent, offer at most $184k (3.5% below list).
- Meets the 1% rule at list price ($2k rent vs $191k).
- Recommended offer: $168k (12.0% below list) — sets the bar for market timing.
- Cap rate 6.1% vs local median 4.0% in Wylie — top-decile yield for the area; either an underpriced asset or a hidden risk that comps aren't pricing in. Stress-test before assuming the spread holds.
Location & tenants
- Location reads 69/100 on livability (#419 in TX) — a middle-class / working-renter tenant base. Strengths: crime A+, employment A+, housing A+; Watch: amenities F, commute F, health & safety F.
- Princeton ISD (suburban): math 51% / reading 47% proficiency, ranked #188 of 826 in TX (top 23%) — families likely to look elsewhere, expect single-tenant / working-renter base with shorter leases.
- Zoned schools: Harper El (math 50% / reading 41%, grade D-, #1,112 of 4,322 statewide, top 26%, 436 students, 56% FRL); Clark Middle (math 53% / reading 42%, grade C-, #408 of 1,662 statewide, top 25%, 707 students, 66% FRL); Princeton H S (math 52% / reading 54%, grade C-, #437 of 1,632 statewide, top 27%, 1,521 students, 57% FRL) — zoned schools at 60% FRL track the district average.
- Market conditions: Rents soft (-1.0%/yr); 1410 active listings in the ZIP; 40 comparable units currently listed for rent nearby; rentals at typical pace (median 26d on market — plan ~3-4 weeks tenant-placement turnaround); 40% of comp listings sitting > 30 days — soft ceiling on asking rent; solid renter incomes; 19,194 units permitted in Collin County in 2024 (3,988 in 5+ unit buildings).
Forward outlook
- Local home prices are declining (-3.0%/yr); year-one equity from $1k of loan paydown is wiped out by about $6k of value loss. Plan a longer hold.
- Collin County population projected at +60% by 2050 — long-run rental-demand tailwind backs the buy-and-hold thesis.
Negotiation context
- It's been on market 323 days — a 12% lower offer ($168k) is reasonable based on typical stale-listing flexibility.
- 2 sale attempts; this cycle's ask is 10809% above the opening price — seller raised mid-cycle; expect resistance to lowballs.
Risks & watch-outs
- Climate carrying-cost: major wind risk, 27% chance of damaging wind over 30y; extreme-heat days projected 8→26/yr by 2055 (HVAC capex compounding) — expect insurance premiums to compound above CPI over the hold.
Questions for the listing agent
- What do current leases actually rent for vs. the listed asking? Can we see a recent rent roll and the last 12 months of T-12 income?
- It's been on market 323 days. Have you received any prior offers? Is the seller open to a 12% concession, seller financing, or rate buy-down credit?
- What does the HOA fee cover, when was the last increase, and are there any pending special assessments or reserve-fund shortfalls?
- Why hasn't it sold? Are there any deal-killer items the seller is aware of (foundation, flood, title, zoning, code violations)?
- Is there a deadline driving the sale (1031 exchange, divorce, estate, relocation)? That informs how much negotiation room exists.
- Schools are B-rated — typically a magnet for longer-tenancy family renters. What's the average tenant stay here, and is there a school-zone premium baked into asking?
- The area grade is low — what's the realistic commute time and amenity access for the typical tenant pool here? Any planned neighborhood developments (good or bad) we should know about?
- What's the average days-on-market for RENTAL listings here right now (not sales)? A rising rental-DOM trend means longer vacancies and softer asking-rent achievability than the comps imply.
- What's the recent tenant-quality profile in this submarket — average credit score on applications, eviction rate, late-payment / NSF rate, and stable-employment percentage? A property-management company in the area should have these aggregated.
- How much new for-sale + rental construction is in the pipeline within 1–3 miles? Heavy new supply typically softens prices + rents 12–24 months out; constrained supply supports both.
Investment metrics
- 1% rule
- 1.01% ✓
- Cap rate
- 6.06%
- Cash-on-cash
- -0.85%
- DSCR
- 0.96
- GRM
- 8.2
CMA / ARV
- ARV (median comp)
- $196,644
- List price
- $190,900
- Delta
- -2.92%
- Verdict
- FAIR
- Comps
- 20 within 1.0 mi
Show comp detail 12 sales within ~0.75 mi
| Address | Dist | Beds/Ba | Sqft | Sold | Price | $/sf | Match |
|---|---|---|---|---|---|---|---|
| 154 Herman Ln | 0.10mi | 3/2.0 (-1) | 1,017 (-0%) | 10mo | $199,999 | $197 | 82 |
| 114 Sunflower St | 0.06mi | 3/2.0 (-1) | 1,018 (0%) | 15mo | $200,000 | $196 | 80 |
| 125 Jethro Ln | 0.14mi | 3/2.0 (-1) | 1,033 (+2%) | 17mo | $164,900 | $160 | 72 |
| 205 Jethro Ln | 0.16mi | 3/2.0 (-1) | 1,017 (-0%) | 19mo | $157,999 | $155 | 72 |
| 6827 Coulter Dr | 0.14mi | 3/2.0 (-1) | 1,033 (+2%) | 18mo | $179,999 | $174 | 71 |
| 115 Sesame Ln | 0.18mi | 3/2.0 (-1) | 1,017 (-0%) | 19mo | $180,999 | $178 | 70 |
| 6639 Coulter Dr | 0.01mi | 3/2.0 (-1) | 1,155 (+14%) | 18mo | $199,500 | $173 | 57 |
| 142 Sunflower St | 0.09mi | 3/2.0 (-1) | 1,162 (+14%) | 15mo | $204,995 | $176 | 55 |
| 201 Jethro Ln | 0.16mi | 3/2.0 (-1) | 1,155 (+14%) | 18mo | $191,999 | $166 | 50 |
| 118 Sesame Ln | 0.16mi | 3/2.0 (-1) | 1,155 (+14%) | 20mo | $193,839 | $168 | 49 |
| 221 Jethro Ln | 0.18mi | 3/2.0 (-1) | 1,155 (+14%) | 19mo | $189,999 | $165 | 49 |
| 111 Sesame Ln | 0.18mi | 3/2.0 (-1) | 1,155 (+14%) | 19mo | $187,999 | $163 | 48 |
Match score weights: distance 35% · size 25% · config 20% · recency 20%. Top-matched comps best support the ARV.
Projected returns pro-forma
-3.0% appreciation · 0.0% rent growth · sell at horizon
- IRR
- -21.7%
- Equity multiple
- 0.27×
- Total profit
- $-38,816
- Equity at exit
- $28,464
- IRR
- -27.5%
- Equity multiple
- -0.09×
- Total profit
- $-58,027
- Equity at exit
- $16,506
Cash invested: $53,452 (down + closing). Projections, not guarantees.
Landlord ↔ Tenant lean methodology
- Overall (STATE)
- 87 Strongly Landlord-Friendly
- State Texas
- 87 Strongly Landlord-Friendly · R+5
- County
- — inherits STATE
- City
- — inherits STATE
ZIP-level market 75407
- Home prices YoY
- -30.3%
- Rents YoY
- -1.0%
- Active inventory
- 1410
- Price-to-rent
- 8.2×
Monthly cashflow live
- Estimated rent
- $1,929 high interval (Pro) →
- Mortgage (P&I)
- −$1,001
- Tax from tax record
- −$348 /mo · $4,181/yr
- Insurance
- −$80
- HOA
- −$133
- Vacancy / Maint / Mgmt
- −$405
- Net cashflow
- $-38
Break-even live
Sensitivity live
| Price | -10% $70 | -5% $16 | +0% $-38 | +5% $-92 | +10% $-146 |
|---|---|---|---|---|---|
| Rent | -10% $-190 | -5% $-114 | +0% $-38 | +5% $38 | +10% $115 |
| Rate | -1.0pp $58 | -0.5pp $11 | base $-38 | +0.5pp $-87 | +1.0pp $-138 |
UW: 25.0% down · 7.5% · 30yr · 1.5% tax · 5.0% vac · 8.0% maint · 8.0% mgmt
Financing live
Cash to close
- Down payment
- $47,725
- Closing costs
- $5,727
- Reserves months
- —
- Total cash needed
- —
Loan-product check · same deal, 3 products live
Conventional
25% down · 7.5% · 30yr
- Down + closing
- —
- Monthly P&I
- —
- Monthly cashflow
- —
- DSCR
- —
- Eligible?
- —
Personal DTI + credit; lowest rate.
DSCR
20% down · 8.5% · 30yr
- Down + closing
- —
- Monthly P&I
- —
- Monthly cashflow
- —
- DSCR
- —
- Eligible?
- —
No personal income docs; deal must DSCR.
Hard money
10% down · 12.0% · 12mo
- Down + closing
- —
- Monthly P&I
- —
- Monthly cashflow
- —
- DSCR
- —
- Eligible?
- —
Short-term bridge; refi at stabilization.
Rent comps 40 comps
| Address | Beds | Baths | Sqft | Rent | $/sqft | DOM | Units | Dist |
|---|---|---|---|---|---|---|---|---|
| 6723 Coulter Dr Princeton, TX | 3.0 | 2.0 | 1018 | $1,500 | $1.47 | 45d | 1 | 0.06mi |
| 6739 Coulter Dr Princeton, TX | 3.0 | 2.0 | 1155 | $1,500 | $1.30 | 45d | 1 | 0.08mi |
| 152 Thresher Ln Princeton, TX | 4.0 | 2.0 | 1300 | $1,750 | $1.35 | 14d | 1 | 0.11mi |
| 119 Sunflower St Princeton, TX | 4.0 | 2.0 | 1300 | $1,999 | $1.54 | 14d | 1 | 0.11mi |
| 150 Sunflower St Princeton, TX | 3.0 | 2.0 | 1017 | $1,899 | $1.87 | 7d | 1 | 0.12mi |
| 211 Herman Ln Princeton, TX | 4.0 | 2.0 | 1295 | $1,595 | $1.23 | 45d | 1 | 0.13mi |
| 6550 August Dr Princeton, TX | 3.0 | 2.0 | 1407 | $1,695 | $1.20 | 5d | 1 | 0.14mi |
| 6561 Alfalfa St Princeton, TX | 3.0 | 2.0 | 1436 | $1,599 | $1.11 | 45d | 1 | 0.15mi |
| 206 Sunflower St Princeton, TX | 3.0 | 2.0 | 1155 | $1,475 | $1.28 | 22d | 1 | 0.15mi |
| 145 Jethro Ln Princeton, TX | 3.0 | 2.0 | 1033 | $1,499 | $1.45 | 26d | 1 | 0.17mi |
| 230 Sunflower St Princeton, TX | 4.0 | 2.0 | 1300 | $1,520 | $1.17 | 1d | 1 | 0.18mi |
| 241 Thresher Ln Princeton, TX | 4.0 | 2.0 | 1295 | $1,850 | $1.43 | 26d | 1 | 0.20mi |
| 6445 Middlebury Dr Princeton, TX | 3.0 | 2.0 | 1266 | $1,649 | $1.30 | 9d | 1 | 0.21mi |
| 151 Sesame Ln Princeton, TX | 4.0 | 2.0 | 1299 | $1,634 | $1.26 | 26d | 1 | 0.22mi |
| 252 Jethro Ln Princeton, TX | 4.0 | 2.0 | 1300 | $1,595 | $1.23 | 45d | 1 | 0.22mi |
| 6808 Sunbeam Cir Princeton, TX | 3.0 | 2.0 | 1155 | $1,534 | $1.33 | 24d | 1 | 0.24mi |
| 214 Wheatgrass Ln Princeton, TX | 3.0 | 2.0 | 1407 | $1,699 | $1.21 | 45d | 1 | 0.25mi |
| 6751 Highlands St Princeton, TX | 3.0 | 2.0 | 1411 | $1,639 | $1.16 | 18d | 1 | 0.30mi |
| 6111 Shearwater Rd , TX | 3.0 | 2.0 | 1392 | $1,900 | $1.36 | 1d | 1 | 0.32mi |
| 402 Harvest St Princeton, TX | 3.0 | 2.0 | 1433 | $1,665 | $1.16 | 14d | 1 | 0.32mi |
| 134 Harvest St Princeton, TX | 3.0 | 2.0 | 1440 | $1,825 | $1.27 | 20d | 1 | 0.33mi |
| 321 Tall Cedar Way Princeton, TX | 3.0 | 3.0 | 1468 | $1,725 | $1.18 | 45d | 1 | 0.39mi |
| 7020 Vining DR Princeton, TX | 3.0 | 2.5 | 1382 | $1,850 | $1.34 | 26d | 1 | 0.49mi |
| 545 Holleman Dr Princeton, TX | 3.0 | 2.0 | 1474 | $1,750 | $1.19 | 45d | 1 | 0.50mi |
| 538 Montclair Ave Princeton, TX | 3.0 | 2.0 | 1260 | $1,775 | $1.41 | 12d | 1 | 0.51mi |
| 416 Finch CIR Princeton, TX | 3.0 | 2.0 | 1266 | $1,350 | $1.07 | 45d | 1 | 0.54mi |
| 6744 Teal Cir Princeton, TX | 3.0 | 2.0 | 1474 | $1,790 | $1.21 | 22d | 1 | 0.55mi |
| 613 Holleman Dr , TX | 3.0 | 2.0 | 1260 | $1,800 | $1.43 | 1d | 1 | 0.57mi |
| 619 Fisher Ln Princeton, TX | 3.0 | 2.0 | 1260 | $1,600 | $1.27 | 45d | 1 | 0.62mi |
| 600 Sandhill Crane Ln Princeton, TX | 3.0 | 2.0 | 1402 | $2,100 | $1.50 | 14d | 1 | 0.63mi |
| 241 Boxberry Way Princeton, TX | 3.0 | 2.0 | 1411 | $1,725 | $1.22 | 45d | 1 | 0.66mi |
| 143 Plumcove Dr Princeton, TX | 3.0 | 3.0 | 1376 | $2,150 | $1.56 | 45d | 1 | 0.67mi |
| 6222 Sandpiper Ln Unit NA Princeton, TX | 3.0 | 2.5 | 1400 | $1,750 | $1.25 | 9d | 1 | 0.78mi |
| 724 Wagtail Dr Princeton, TX | 3.0 | 2.5 | 1360 | $1,650 | $1.21 | 1d | 1 | 0.83mi |
| 724 Wagtail Dr Princeton, TX | 3.0 | 2.5 | 1360 | $1,675 | $1.23 | 4d | 1 | 0.83mi |
| 623 Linden Rd Princeton, TX | 3.0 | 2.5 | 1419 | $1,650 | $1.16 | 45d | 1 | 0.85mi |
| 812 Sandhill Crane Ln Princeton, TX | 3.0 | 2.5 | 1309 | $1,850 | $1.41 | 45d | 1 | 0.86mi |
| 803 Wagtail Dr , TX | 3.0 | 2.5 | 1360 | $1,605 | $1.18 | 24d | 1 | 0.86mi |
| 5825 Rockrose Ln Princeton, TX | 3.0 | 2.0 | 1440 | $1,780 | $1.24 | 45d | 1 | 0.87mi |
| 228 Rubylace Dr Princeton, TX | 3.0 | 2.0 | 1436 | $1,700 | $1.18 | 45d | 1 | 0.87mi |
HOA detail
- Monthly dues
- $133 · $1,596/yr
Listing history 24 events
-
2026-06-21days on market $190,900 Active 323 DOM
-
2026-06-18days on market $190,900 Active 320 DOM
-
2026-06-17days on market $190,900 Active 319 DOM
-
2026-06-16days on market $190,900 Active 318 DOM
-
2026-06-15days on market $190,900 Active 317 DOM
-
2026-06-13days on market $190,900 Active 315 DOM
-
2026-06-13days on market $190,900 Active 314 DOM
-
2026-06-09days on market $190,900 Active 311 DOM
-
2026-06-08days on market $190,900 Active 310 DOM
-
2026-06-07days on market $190,900 Active 309 DOM
-
2026-06-04days on market $190,900 Active 306 DOM
-
2026-06-03days on market $190,900 Active 305 DOM
-
2026-06-02days on market $190,900 Active 304 DOM
-
2026-06-01days on market $190,900 Active 303 DOM
-
2026-05-31days on market $190,900 Active 302 DOM
-
2026-03-28price $1,625
-
2026-03-27price $190,900 477-char remark
Show marketing remark (477 chars)
Step into the charm of this 3-bedroom, 2-bath home designed with first-time buyers in mind. Built in 2023 and thoughtfully refreshed with new bedroom flooring, energy-efficient exterior doors, and fresh paint throughout—it’s move-in ready and full of potential. Tucked into the growing community of Tillage Farms, this home is your blank canvas to create something special. Limited photos? Even better—come experience the warmth, flow, and light in person.
-
2025-11-17price $191,900 477-char remark
Show marketing remark (477 chars)
Step into the charm of this 3-bedroom, 2-bath home designed with first-time buyers in mind. Built in 2023 and thoughtfully refreshed with new bedroom flooring, energy-efficient exterior doors, and fresh paint throughout—it’s move-in ready and full of potential. Tucked into the growing community of Tillage Farms, this home is your blank canvas to create something special. Limited photos? Even better—come experience the warmth, flow, and light in person.
-
2025-10-22$1,750
-
2025-10-10price $199,900 477-char remark
Show marketing remark (477 chars)
Step into the charm of this 3-bedroom, 2-bath home designed with first-time buyers in mind. Built in 2023 and thoughtfully refreshed with new bedroom flooring, energy-efficient exterior doors, and fresh paint throughout—it’s move-in ready and full of potential. Tucked into the growing community of Tillage Farms, this home is your blank canvas to create something special. Limited photos? Even better—come experience the warmth, flow, and light in person.
-
2025-09-10price $207,000 477-char remark
Show marketing remark (477 chars)
Step into the charm of this 3-bedroom, 2-bath home designed with first-time buyers in mind. Built in 2023 and thoughtfully refreshed with new bedroom flooring, energy-efficient exterior doors, and fresh paint throughout—it’s move-in ready and full of potential. Tucked into the growing community of Tillage Farms, this home is your blank canvas to create something special. Limited photos? Even better—come experience the warmth, flow, and light in person.
-
2025-08-27price $210,000 477-char remark
Show marketing remark (477 chars)
Step into the charm of this 3-bedroom, 2-bath home designed with first-time buyers in mind. Built in 2023 and thoughtfully refreshed with new bedroom flooring, energy-efficient exterior doors, and fresh paint throughout—it’s move-in ready and full of potential. Tucked into the growing community of Tillage Farms, this home is your blank canvas to create something special. Limited photos? Even better—come experience the warmth, flow, and light in person.
-
2025-08-15price $215,000 477-char remark
Show marketing remark (477 chars)
Step into the charm of this 3-bedroom, 2-bath home designed with first-time buyers in mind. Built in 2023 and thoughtfully refreshed with new bedroom flooring, energy-efficient exterior doors, and fresh paint throughout—it’s move-in ready and full of potential. Tucked into the growing community of Tillage Farms, this home is your blank canvas to create something special. Limited photos? Even better—come experience the warmth, flow, and light in person.
-
2025-08-01$225,000 Active 477-char remark
Show marketing remark (477 chars)
Step into the charm of this 3-bedroom, 2-bath home designed with first-time buyers in mind. Built in 2023 and thoughtfully refreshed with new bedroom flooring, energy-efficient exterior doors, and fresh paint throughout—it’s move-in ready and full of potential. Tucked into the growing community of Tillage Farms, this home is your blank canvas to create something special. Limited photos? Even better—come experience the warmth, flow, and light in person.
ⓘ Source: listings_history table (triggers on properties + properties_extension) + one-shot
backfill from property_details.listing_events for pre-trigger history.
Tax reassessment forecast TX · Resets to sale price
- Current annual tax
- $4,181 · $348/mo
- Projected year-2 tax
- $4,181 · $348/mo
- Expected delta
- $0/yr ($0/mo · 0.0%)
ⓘ Screening estimate from a state-policy table — verify with the county assessor before closing.
Climate risk First Street
- Flood 1/10 Low FEMA zone X (unshaded) · 0% chance over 30 yrs
- Wildfire 4/10 Moderate
- Heat 8/10 Severe 8 d/yr ≥110°F today · 26 d/yr by 30 yrs out
- Wind 6/10 Major 27% chance of damaging wind over 30 yrs
- Air quality 3/10 Moderate 3 unhealthy d/yr today · 3 by 30 yrs out
Nearby sold comps map
Loading sold comps map…
Walkable amenities ~0.75 mi
Loading nearby amenities…
Taxation est. · year 1
- Rental income
- $23,154
- − Mortgage interest
- −$10,693
- − Property taxes
- −$4,181
- − Insurance
- −$954
- − Repairs & maintenance
- −$1,852
- − Management
- −$1,852
- − HOA
- −$1,596
- − Depreciation
- −$5,553
- Taxable loss
- −$3,529
- Est. tax savings @ 24.0%
- +$847
- After-tax cash flow
- $394/yr
For passive investors: Depreciation is non-cash, so a rental often shows a tax loss while cash-flowing — sheltering income. Rental losses are passive: they offset passive income freely, and up to $25,000/yr can offset ordinary (W-2) income if you actively participate and your MAGI is under $100k (phasing out to $0 by $150k); unused losses carry forward. On sale, claimed depreciation is recaptured at up to 25%, and gains may owe capital-gains tax (a 1031 exchange can defer both). Figures are a year-1 estimate at your 24.0% rate — not tax advice; consult a CPA.
Condition & rehab AI · 12 photos
This 3-bedroom, 2-bath home is move-in ready with fresh paint and modern finishes, making it an excellent investment opportunity.
Value-add opportunities
- Both painting — fresh paint enhances curb appeal and interior aesthetics
- Both landscaping — improves curb appeal and adds value
- Both upgrading appliances — modern appliances increase both resale and rental value
Renovation cost estimate screening
Value-add ROI direction
- Both painting — fresh paint enhances curb appeal and interior aesthetics ↑
- Both landscaping — improves curb appeal and adds value ↑
- Both upgrading appliances — modern appliances increase both resale and rental value ↑
ⓘ Cost ranges are severity-bucket heuristics (US national rule-of-thumb). Get contractor quotes + a written scope before underwriting a rehab budget.
Schools (NCES district)
- District
- Princeton ISD
- NCES district ID
- 4835850
- Math proficiency
- 51% ▼ -8.00%
- Reading proficiency
- 47% ▬ 0.00%
- Median HH income
- $54,827
- Composite
- 42.44/100
- National rank
- #3226
- State rank
- #188 of 826 in TX
Livability — Wylie
- Score
- 69/100
- State rank
- #419
- US rank
- #8623
Category grades
Schools grade is shown separately in the Schools card above.
Census & demographics
- County
- Collin County · 1,159,394 people
- City population
- 69,325
- Metro
- Dallas-Fort Worth-Arlington, TX
- Population (ZIP)
- 34,171
- Household income
- $100,037
- Rent vs Own
- Severe rent burden
- 368.0
Population outlook (Collin County) Hauer SSP2
- Today (2025)
- 1,210,074 people
- By 2030
- 1,358,201 · +12.2%
- By 2040
- 1,654,061 · +36.7%
- By 2050
- 1,937,359 · +60.1%
- By 2075
- 2,567,039 · +112.1%
- By 2100
- 2,952,048 · +144.0%
Race, ethnicity, and origin ACS 2023
- Neighborhood character
- Diverse neighborhood (Simpson 0.66)
- Race & ethnicity
- White 47% Hispanic / Latino 30% Black 17% Two or more races 10% Asian 4% Native American 1%
- Hispanic origin (detail)
- Mexican 26%
- Common ancestry
- Lithuanian 2% Romanian 1% Russian 1%
- Foreign-born
- 15% · Canada, China, Mexico
- Languages at home
- 70% English-only · Spanish 22% Other Indo-European 2% Other Asian/Pacific 1%
Political lean MEDSL · Collin
- 2024 margin
- R (+11.1) · D 43.1% · R 54.3% · Other 2.6%
- 2008→2024 swing
- +14.4pp toward D · 2008: -25.6pp · 2024: -11.1pp
- All cycles
- 2024: R+11.1 2020: R+4.3 2016: R+17.0 2012: R+31.6 2008: R+25.6
Not yet ingested
- Civics
- —
Market trends
- HPI YoY
- ▼ -103.99%
- Current HPI
- 238.9373
- Rent YoY
- ▼ -1.02%
- Metro
- Dallas-Fort Worth-Arlington, TX
- State GDP YoY
- ▲ 3.95%
- F500 in state
- 110
Industry mix (Fortune 500 HQ in TX)
| Industry | F500 HQs | Revenue |
|---|---|---|
| Energy | 16 | $1,198B |
|
||
| Technology | 5 | $198B |
|
||
| Engineering / Construction | 4 | $72B |
|
||
| Energy Services | 3 | $60B |
|
||
| Utilities | 3 | $41B |
|
||
| Healthcare | 2 | $330B |
|
||
Price history
-99.3% since first listed9 events — show timeline
- 2026-03-28 Price Changed $1,625 NTREIS
- 2026-03-27 Price Changed $190,900 NTREIS
- 2025-11-17 Price Changed $191,900 NTREIS
- 2025-10-22 Listed for Rent $1,750 NTREIS
- 2025-10-10 Price Changed $199,900 NTREIS
- 2025-09-10 Price Changed $207,000 NTREIS
- 2025-08-27 Price Changed $210,000 NTREIS
- 2025-08-15 Price Changed $215,000 NTREIS
- 2025-08-01 Listed $225,000 NTREIS
Property tax history
+164.0%/yrLatest (2025): $4,181 · -10.7% YoY. Source: county tax records.
Cash-flow waterfall
monthlySold comps — $/sqft
last 12 mo · ≤1 miLoading sold comps…