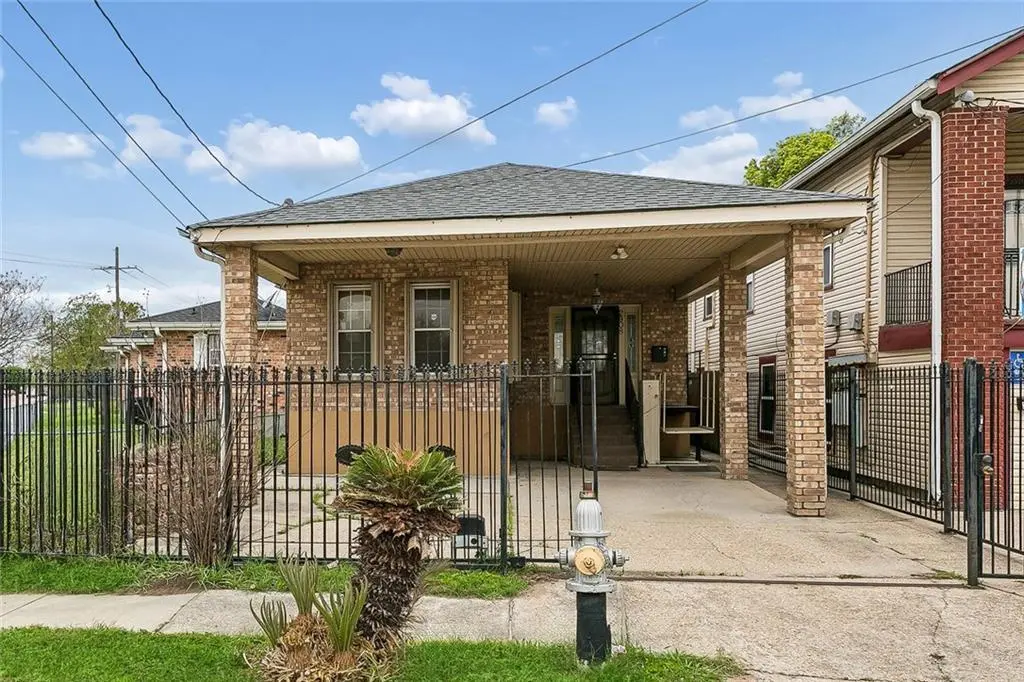
2908 General Ogden St · New Orleans, LA
Flood risk 8/10 · Major
- FEMA flood zone
- X (shaded)
- Chance of flooding over 30 yrs
- 0.74%
- Est. flood insurance / yr
- $507 – $1,088
Fire risk 1/10 · Minimal
- Est. fire insurance / yr
- $1,269 – $2,357
Heat risk 10/10 · Severe
- Hot days now (above 108°F)
- 7 days/yr
- Hot days in 30 yrs
- 21 days/yr
Wind risk 10/10 · Severe
- Chance of severe wind over 30 yrs
- 99.0%
Air-quality risk 4/10 · Minor
- Unhealthy air days now
- 4 days/yr
- Unhealthy air days in 30 yrs
- 4 days/yr
Risk factors via First Street. Map © Google.
Why this score? — see what drove the C+ grade
The composite is a weighted blend of 9 inputs, each scored 0–100. Each bar is that input's sub-score; the figure is the points it added to the 100-point composite (weight × sub-score).
- Cash flow +22.1/30.0
- ARV discount +15.0/15.0
- DSCR +7.1/10.0
- 1% rule +5.8/10.0
- Livability +4.0/5.0
- Rent growth +2.7/5.0
- Condition / age +2.5/5.0
- Schools +1.6/10.0
- Appreciation +0.0/10.0
$165,000
🖨 Deal sheet 📄 Offer letter ✓ Due diligence
Listing remarks MLS
Well-maintained brick home featuring a very large primary room with ensuite and natural lighting throughout. Includes ADA-accessible features and functional living space.
Key facts
- Natural lighting
- Ensuite
- Brick home
Tags
Neighborhood map
What this means for you Summary
Snapshot
- This is a 2-bed/2.0-bath single-family listed at $165k.
Deal economics
- At list price, monthly cash flow is $200 ($2k/yr) — positive.
- The deal already cash-flows at list — no discount required.
- Meets the 1% rule at list price ($2k rent vs $165k).
- Recommended offer: $150k (9.0% below list) — sets the bar for market timing.
- Cap rate 8.2% vs local median 4.4% in New Orleans — top-decile yield for the area; either an underpriced asset or a hidden risk that comps aren't pricing in. Stress-test before assuming the spread holds.
Location & tenants
- Location reads 81/100 on livability (#3 in LA, #1,383 nationally) — a professional / high-income tenant draw. Strengths: amenities A+, commute A+, health & safety A+; Watch: crime C-, employment D.
- Orleans Parish (urban): math 11% / reading 27% proficiency, ranked #69 of 98 in LA (top 70%) — low school quality limits family demand, transient renter base, plan for 1-2y turnover; 68% free/reduced lunch — lower-income household profile, screen leases tightly.
- Market conditions: Rents flat; 279 active listings in the ZIP; 40 comparable units currently listed for rent nearby; rentals at typical pace (median 24d on market — plan ~3-4 weeks tenant-placement turnaround); 710 units permitted in Orleans Parish in 2024 (244 in 5+ unit buildings).
- This rent runs 34% of the median local income ($64k/yr) — at the standard rent-burdened threshold; future hikes will face affordability resistance.
Forward outlook
- Local home prices are declining (-3.0%/yr); year-one equity from $1k of loan paydown is wiped out by about $5k of value loss. Plan a longer hold.
- Orleans County population projected at +61% by 2050 — long-run rental-demand tailwind backs the buy-and-hold thesis.
Negotiation context
- It's been on market 92 days — a 9% lower offer ($150k) is reasonable based on typical stale-listing flexibility.
- 6 sale attempts since 3y ago; this cycle's ask has dropped $40k (20%) from the opening price — seller is motivated, your offer sets the floor, not the list.
- Current owner paid $26k; list at $165k implies a 535% gain — meaningful room to come down on a strong offer.
Risks & watch-outs
- Watch-outs: flood insurance adds $66/mo.
- Climate carrying-cost: severe flood risk; severe wind risk, 99% chance of damaging wind over 30y; extreme-heat days projected 7→21/yr by 2055 (HVAC capex compounding) — expect insurance premiums to compound above CPI over the hold.
Questions for the listing agent
- It's been on market 92 days. Have you received any prior offers? Is the seller open to a 9% concession, seller financing, or rate buy-down credit?
- Built in 1977 — when were the roof, HVAC, electrical panel, plumbing, and water heater last replaced?
- What's the actual annual flood-insurance premium (NFIP or private), and is the property in a SFHA with mandatory coverage?
- Why hasn't it sold? Are there any deal-killer items the seller is aware of (foundation, flood, title, zoning, code violations)?
- Is there a deadline driving the sale (1031 exchange, divorce, estate, relocation)? That informs how much negotiation room exists.
- What's the average days-on-market for RENTAL listings here right now (not sales)? A rising rental-DOM trend means longer vacancies and softer asking-rent achievability than the comps imply.
- What's the recent tenant-quality profile in this submarket — average credit score on applications, eviction rate, late-payment / NSF rate, and stable-employment percentage? A property-management company in the area should have these aggregated.
- How much new for-sale + rental construction is in the pipeline within 1–3 miles? Heavy new supply typically softens prices + rents 12–24 months out; constrained supply supports both.
Investment metrics
- 1% rule
- 1.08% ✓
- Cap rate
- 8.23%
- Cash-on-cash
- 6.92%
- DSCR
- 1.31
- GRM
- 7.7
CMA / ARV
- ARV (median comp)
- $243,667
- List price
- $165,000
- Delta
- -32.28%
- Verdict
- UNDERPRICED
- Comps
- 20 within 1.0 mi
Show comp detail 12 sales within ~0.75 mi
| Address | Dist | Beds/Ba | Sqft | Sold | Price | $/sf | Match |
|---|---|---|---|---|---|---|---|
| 8719 Fig St | 0.13mi | 3/2.0 (+1) | 1,540 (+5%) | 1mo | $70,000 | $45 | 80 |
| 2939 Leonidas St | 0.23mi | 3/2.0 (+1) | 1,516 (+4%) | 0mo | $155,500 | $103 | 78 |
| 3024 Hollygrove St | 0.11mi | 3/2.0 (+1) | 1,533 (+5%) | 5mo | $299,000 | $195 | 78 |
| 2510 General Ogden St | 0.27mi | 3/1.0 (+1) | 1,500 (+2%) | 2mo | $55,000 | $37 | 73 |
| 8917 Apple St | 0.20mi | 3/2.0 (+1) | 1,586 (+8%) | 3mo | $221,000 | $139 | 69 |
| 9119 Edinburgh St | 0.42mi | 3/2.0 (+1) | 1,349 (-8%) | 1mo | $125,000 | $93 | 62 |
| 9102 Oleander St | 0.21mi | 3/2.0 (+1) | 1,274 (-13%) | 3mo | $58,066 | $46 | 62 |
| 2828 Mistletoe St | 0.21mi | 3/2.0 (+1) | 1,670 (+14%) | 2mo | $287,000 | $172 | 60 |
| 7822 Colapissa St | 0.73mi | 3/2.0 (+1) | 1,452 (-1%) | 1mo | $245,000 | $169 | 59 |
| 913 Odwyer Pl | 0.66mi | 2/3.0 | 1,400 (-4%) | 5mo | $250,000 | $179 | 54 |
| 7909 Belfast St | 0.69mi | 3/2.0 (+1) | 1,615 (+10%) | 0mo | $466,000 | $289 | 45 |
| 8207 Neron Pl | 0.62mi | 3/3.0 (+1) | 1,608 (+10%) | 3mo | $270,000 | $168 | 43 |
Match score weights: distance 35% · size 25% · config 20% · recency 20%. Top-matched comps best support the ARV.
Projected returns pro-forma
-3.0% appreciation · 0.97% rent growth · sell at horizon
- IRR
- -10.6%
- Equity multiple
- 0.62×
- Total profit
- $-17,502
- Equity at exit
- $24,602
- IRR
- -4.6%
- Equity multiple
- 0.73×
- Total profit
- $-12,614
- Equity at exit
- $14,266
Cash invested: $46,200 (down + closing). Projections, not guarantees.
Landlord ↔ Tenant lean methodology
- Overall (STATE)
- 90 Strongly Landlord-Friendly
- State Louisiana
- 90 Strongly Landlord-Friendly · R+12
- County
- — inherits STATE
- City
- — inherits STATE
ZIP-level market 70118
- Rents YoY
- 1.0%
- Active inventory
- 279
- Price-to-rent
- 7.7×
Monthly cashflow live
- Estimated rent
- $1,781 high interval (Pro) →
- Mortgage (P&I)
- −$865
- Tax est. 1.5%
- −$206 /mo · $2,475/yr
- Insurance
- −$69
- Flood insurance flood zone
- −$66 /mo · $798/yr
- HOA
- −$0
- Vacancy / Maint / Mgmt
- −$374
- Net cashflow
- $200
Break-even live
UW: 25.0% down · 7.5% · 30yr · 1.5% tax · 5.0% vac · 8.0% maint · 8.0% mgmt
Financing live
Cash to close
- Down payment
- $41,250
- Closing costs
- $4,950
- Reserves months
- —
- Total cash needed
- —
Loan-product check · same deal, 3 products live
Conventional
25% down · 7.5% · 30yr
- Down + closing
- —
- Monthly P&I
- —
- Monthly cashflow
- —
- DSCR
- —
- Eligible?
- —
Personal DTI + credit; lowest rate.
DSCR
20% down · 8.5% · 30yr
- Down + closing
- —
- Monthly P&I
- —
- Monthly cashflow
- —
- DSCR
- —
- Eligible?
- —
No personal income docs; deal must DSCR.
Hard money
10% down · 12.0% · 12mo
- Down + closing
- —
- Monthly P&I
- —
- Monthly cashflow
- —
- DSCR
- —
- Eligible?
- —
Short-term bridge; refi at stabilization.
Rent comps 40 comps
| Address | Beds | Baths | Sqft | Rent | $/sqft | DOM | Units | Dist |
|---|---|---|---|---|---|---|---|---|
| 8709 Pritchard Pl New Orleans, LA | 3.0 | 2.0 | 1000 | $1,500 | $1.50 | 21d | 1 | 0.10mi |
| 8929 Colapissa St New Orleans, LA | 3.0 | 1.0 | 1300 | $1,400 | $1.08 | 23d | 1 | 0.15mi |
| 9107 Fig St New Orleans, LA | 3.0 | 3.0 | 1230 | $2,000 | $1.63 | 3d | 1 | 0.18mi |
| 8610 Apricot St New Orleans, LA | 3.0 | 2.0 | 1000 | $2,200 | $2.20 | 10d | 1 | 0.19mi |
| 2730 Leonidas St New Orleans, LA | 2.0 | 1.0 | 1000 | $1,400 | $1.40 | 23d | 1 | 0.20mi |
| 8812 Apple St New Orleans, LA | 3.0 | 2.0 | 1085 | $1,650 | $1.52 | 15d | 1 | 0.23mi |
| 2527 Eagle St New Orleans, LA | 3.0 | 2.0 | 1571 | $2,200 | $1.40 | 23d | 1 | 0.25mi |
| 8816 Olive St New Orleans, LA | 3.0 | 2.0 | 1200 | $1,800 | $1.50 | 23d | 1 | 0.30mi |
| 8816 Olive St Unit A-B New Orleans, LA | 3.0 | 2.0 | 1200 | $1,800 | $1.50 | 15d | 1 | 0.30mi |
| 8405 Apricot St New Orleans, LA | 3.0 | 2.0 | 1058 | $1,795 | $1.70 | 3d | 1 | 0.31mi |
| 8405 Apricot St New Orleans, LA | 3.0 | 2.0 | 1058 | $1,795 | $1.70 | 2d | 1 | 0.31mi |
| 8514 Forshey St New Orleans, LA | 3.0 | 1.0 | 1030 | $1,600 | $1.55 | 23d | 1 | 0.32mi |
| 9309 Belfast St Rm A New Orleans, LA | 1.0 | 1.0 | 1220 | $1,200 | $0.98 | 23d | 1 | 0.33mi |
| 9129 Nelson St New Orleans, LA | 2.0 | 1.5 | 1434 | $1,900 | $1.32 | 23d | 1 | 0.34mi |
| 8329 Pritchard Pl Unit B New Orleans, LA | 1.0 | 1.5 | 1500 | $1,600 | $1.07 | 11d | 1 | 0.34mi |
| 9122 Nelson St New Orleans, LA | 2.0 | 2.0 | 1100 | $1,550 | $1.41 | 23d | 1 | 0.34mi |
| 2616 Cambronne St Unit 2618 New Orleans, LA | 3.0 | 1.0 | 1200 | $1,475 | $1.23 | 23d | 1 | 0.36mi |
| 8537 S Claiborne Ave New Orleans, LA | 2.0 | 1.0 | 1450 | $1,400 | $0.97 | 3d | 1 | 0.39mi |
| 9215 S Claiborne Ave New Orleans, LA | 2.0 | 2.0 | 1100 | $2,000 | $1.82 | 11d | 1 | 0.42mi |
| 8502 Edinburgh St New Orleans, LA | 3.0 | 2.0 | 1456 | $1,800 | $1.24 | 3d | 1 | 0.44mi |
| 9438 Forshey St New Orleans, LA | 3.0 | 2.0 | 1274 | $2,000 | $1.57 | 23d | 1 | 0.47mi |
| 8815 Palm St New Orleans, LA | 3.0 | 2.0 | 1195 | $2,100 | $1.76 | 23d | 1 | 0.47mi |
| 2311 Joliet St New Orleans, LA | 2.0 | 2.0 | 950 | $1,900 | $2.00 | 23d | 1 | 0.49mi |
| 2305 Joliet St New Orleans, LA | 3.0 | 2.0 | 1451 | $2,500 | $1.72 | 43d | 1 | 0.51mi |
| 7933 Belfast St Unit Upper New Orleans, LA | 3.0 | 2.0 | 1500 | $2,400 | $1.60 | 23d | 1 | 0.63mi |
| 912 Monticello Ave New Orleans, LA | 3.0 | 2.0 | 1750 | $2,500 | $1.43 | 43d | 1 | 0.65mi |
| 1916 Eagle St New Orleans, LA | 3.0 | 2.0 | 1000 | $1,250 | $1.25 | 23d | 1 | 0.68mi |
| 1916 Eagle St New Orleans, LA | 3.0 | 2.0 | 1000 | $1,250 | $1.25 | 2d | 1 | 0.68mi |
| 9528 Stroelitz St New Orleans, LA | 3.0 | 2.0 | 1174 | $2,100 | $1.79 | 11d | 1 | 0.68mi |
| 3317 Short St New Orleans, LA | 3.0 | 2.0 | 900 | $1,600 | $1.78 | 23d | 1 | 0.68mi |
| 9540 Stroelitz St Unit 9540 New Orleans, LA | 2.0 | 1.0 | 949 | $1,495 | $1.58 | 23d | 1 | 0.69mi |
| 2022 Dante St New Orleans, LA | 2.0 | 1.0 | 989 | $1,300 | $1.31 | 3d | 1 | 0.70mi |
| 1836 General Ogden St New Orleans, LA | 3.0 | 2.0 | 1368 | $1,675 | $1.22 | 23d | 1 | 0.71mi |
| 8426 Spruce St New Orleans, LA | 3.0 | 2.0 | 1700 | $3,000 | $1.76 | 43d | 1 | 0.71mi |
| 3205 Fern St New Orleans, LA | 2.0 | 1.0 | 938 | $1,200 | $1.28 | 21d | 1 | 0.71mi |
| 2231 S Carrollton Ave Unit D New Orleans, LA | 3.0 | 2.0 | 1600 | $2,495 | $1.56 | 23d | 1 | 0.72mi |
| 2308 Short St New Orleans, LA | 3.0 | 2.0 | 1600 | $2,800 | $1.75 | 3d | 1 | 0.73mi |
| 4008 General Ogden St Unit 4008 New Orleans, LA | 2.0 | 2.0 | 1000 | $1,475 | $1.48 | 14d | 1 | 0.74mi |
| 8423 Cohn St New Orleans, LA | 2.0 | 2.0 | 887 | $1,700 | $1.92 | 23d | 1 | 0.74mi |
| 8421 Cohn St New Orleans, LA | 2.0 | 2.0 | 887 | $1,750 | $1.97 | 23d | 1 | 0.74mi |
Listing history 28 events
-
2026-06-18days on market $165,000 Active 92 DOM
-
2026-06-17days on market $165,000 Active 91 DOM
-
2026-06-16days on market $165,000 Active 90 DOM
-
2026-06-15days on market $165,000 Active 89 DOM
-
2026-06-13days on market $165,000 Active 87 DOM
-
2026-06-10days on market $165,000 Active 84 DOM
-
2026-06-09days on market $165,000 Active 83 DOM
-
2026-06-08days on market $165,000 Active 82 DOM
-
2026-06-07days on market $165,000 Active 81 DOM
-
2026-06-05days on market $165,000 Active 78 DOM
-
2026-06-03days on market $165,000 Active 77 DOM
-
2026-06-02days on market $165,000 Active 76 DOM
-
2026-06-01days on market $165,000 Active 75 DOM
-
2026-05-31days on market $165,000 Active 74 DOM
-
2026-04-21price $185,000 170-char remark
Show marketing remark (170 chars)
Well-maintained brick home featuring a very large primary room with ensuite and natural lighting throughout. Includes ADA-accessible features and functional living space.
-
2026-04-21price $185,000 170-char remark
Show marketing remark (170 chars)
Well-maintained brick home featuring a very large primary room with ensuite and natural lighting throughout. Includes ADA-accessible features and functional living space.
-
2026-03-18$205,000 Active 170-char remark
Show marketing remark (170 chars)
Well-maintained brick home featuring a very large primary room with ensuite and natural lighting throughout. Includes ADA-accessible features and functional living space.
-
2026-03-18$205,000 Active 170-char remark
Show marketing remark (170 chars)
Well-maintained brick home featuring a very large primary room with ensuite and natural lighting throughout. Includes ADA-accessible features and functional living space.
-
2025-05-30price $230,000
-
2025-05-29price $230,000
-
2025-04-12$230,000
-
2025-04-12$255,000 Active
-
2024-01-03historical $1,300
-
2023-12-04$1,300
-
2023-10-05price $225,000
-
2023-08-23$225,000
-
1998-04-21soldstatus $26,000
-
1979-05-02soldstatus $65,000
ⓘ Source: listings_history table (triggers on properties + properties_extension) + one-shot
backfill from property_details.listing_events for pre-trigger history.
Climate risk First Street
- Flood 8/10 Severe FEMA zone X (shaded) · 74% chance over 30 yrs
- Wildfire 1/10 Low
- Heat 10/10 Extreme 7 d/yr ≥108°F today · 21 d/yr by 30 yrs out
- Wind 10/10 Extreme 99% chance of damaging wind over 30 yrs
- Air quality 4/10 Moderate 4 unhealthy d/yr today · 4 by 30 yrs out
Nearby sold comps map
Loading sold comps map…
Walkable amenities ~0.75 mi
Loading nearby amenities…
Taxation est. · year 1
- Rental income
- $21,367
- − Mortgage interest
- −$9,243
- − Property taxes
- −$2,475
- − Insurance
- −$1,622
- − Repairs & maintenance
- −$1,709
- − Management
- −$1,709
- − Depreciation
- −$4,800
- Taxable loss
- −$192
- Est. tax savings @ 24.0%
- +$46
- After-tax cash flow
- $2,445/yr
For passive investors: Depreciation is non-cash, so a rental often shows a tax loss while cash-flowing — sheltering income. Rental losses are passive: they offset passive income freely, and up to $25,000/yr can offset ordinary (W-2) income if you actively participate and your MAGI is under $100k (phasing out to $0 by $150k); unused losses carry forward. On sale, claimed depreciation is recaptured at up to 25%, and gains may owe capital-gains tax (a 1031 exchange can defer both). Figures are a year-1 estimate at your 24.0% rate — not tax advice; consult a CPA.
Schools (NCES district)
- District
- Orleans Parish
- NCES district ID
- 2201170
- Math proficiency
- 11% ▼ -52.00%
- Reading proficiency
- 27% ▼ -46.00%
- Median HH income
- $37,011
- Composite
- 15.78/100
- National rank
- #9271
- State rank
- #69 of 98 in LA
Livability — New Orleans
- Score
- 81/100
- State rank
- #3
- US rank
- #1383
Category grades
Schools grade is shown separately in the Schools card above.
Census & demographics
- Census place
- New Orleans, LA
- County
- Orleans Parish · 338,817 people
- City population
- 338,817
- Metro
- New Orleans-Metairie, LA
- Population (ZIP)
- 36,072
- Household income
- $63,750
- Rent vs Own
- Severe rent burden
- 2237.0
Population outlook (Orleans County) Hauer SSP2
- Today (2025)
- 513,025 people
- By 2030
- 575,781 · +12.2%
- By 2040
- 700,174 · +36.5%
- By 2050
- 826,541 · +61.1%
- By 2075
- 1,123,374 · +119.0%
- By 2100
- 1,355,609 · +164.2%
Race, ethnicity, and origin ACS 2023
- Neighborhood character
- Diverse neighborhood (Simpson 0.65)
- Race & ethnicity
- White 47% Black 34% Hispanic / Latino 11% Two or more races 11% Asian 4%
- Hispanic origin (detail)
- Mexican 2%
- Common ancestry
- Lithuanian 8% Italian 2% Romanian 2%
- Foreign-born
- 9% · Canada, China
- Languages at home
- 86% English-only · Spanish 7% French/Haitian/Cajun 2% Other Indo-European 2%
Political lean MEDSL · Orleans
- 2024 margin
- Solid D (+67.0) · D 82.2% · R 15.2% · Other 2.7%
- 2008→2024 swing
- +6.7pp toward D · 2008: 60.3pp · 2024: 67.0pp
- All cycles
- 2024: D+67.0 2020: D+68.2 2016: D+66.2 2012: D+62.5 2008: D+60.3
Not yet ingested
- Civics
- —
Market trends
- HPI YoY
- ▼ -210.46%
- Current HPI
- 282.9629
- Rent YoY
- ▲ 0.97%
- Metro
- New Orleans-Metairie, LA
- State GDP YoY
- ▲ 3.29%
- F500 in state
- 10
Industry mix (Fortune 500 HQ in LA)
| Industry | F500 HQs | Revenue |
|---|---|---|
| Telecommunications | 2 | $23B |
|
||
| Utilities | 1 | $12B |
|
||
| Wholesale / Distribution | 1 | $5B |
|
||
| Advertising | 1 | $2B |
|
||
Price history
+184.6% since first listed14 events — show timeline
- 2026-04-21 Price Changed $185,000 AcadianaMLS
- 2026-04-21 Price Changed $185,000 GSREIN
- 2026-03-18 Listed $205,000 GSREIN
- 2026-03-18 Listed $205,000 AcadianaMLS
- 2025-05-30 Price Changed $230,000 AcadianaMLS
- 2025-05-29 Price Changed $230,000 GSREIN
- 2025-04-12 Listed $255,000 AcadianaMLS
- 2025-04-12 Listed $230,000 AcadianaMLS
- 2024-01-03 Rental Removed $1,300 GSREIN
- 2023-12-04 Listed for Rent $1,300 GSREIN
- 2023-10-05 Price Changed $225,000 GSREIN
- 2023-08-23 Listed $225,000 AcadianaMLS
- 1998-04-21 Sold (Public Records) $26,000 Public Records
- 1979-05-02 Sold (Public Records) $65,000 Public Records
Property tax history
+0.3%/yrLatest (2026): $114 · +0.3% YoY. Source: county tax records.
Cash-flow waterfall
monthlySold comps — $/sqft
last 12 mo · ≤1 miLoading sold comps…