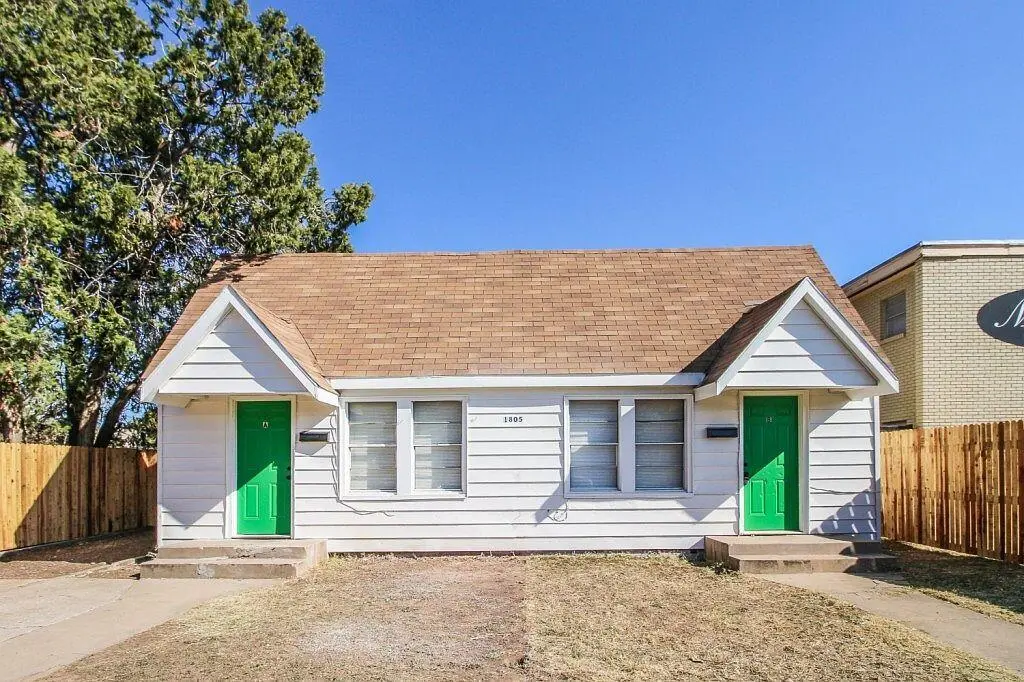
1805 Avenue R · Lubbock, TX
Flood risk 1/10 · Minimal
- FEMA flood zone
- X (unshaded)
- Chance of flooding over 30 yrs
- 0.0%
- Est. flood insurance / yr
- $507 – $1,088
Fire risk 1/10 · Minimal
- Est. fire insurance / yr
- $1,222 – $2,270
Heat risk 5/10 · Moderate
- Hot days now (above 100°F)
- 7 days/yr
- Hot days in 30 yrs
- 22 days/yr
Wind risk 2/10 · Minimal
- Chance of severe wind over 30 yrs
- —
Air-quality risk 2/10 · Minimal
- Unhealthy air days now
- 1 days/yr
- Unhealthy air days in 30 yrs
- 1 days/yr
Risk factors via First Street. Map © Google.
Why this score? — see what drove the B+ grade
The composite is a weighted blend of 9 inputs, each scored 0–100. Each bar is that input's sub-score; the figure is the points it added to the 100-point composite (weight × sub-score).
- Cash flow +29.0/30.0
- DSCR +10.0/10.0
- 1% rule +8.8/10.0
- Appreciation +8.4/10.0
- ARV discount +7.5/15.0
- Rent growth +4.6/5.0
- Livability +4.0/5.0
- Schools +3.1/10.0
- Condition / age +2.5/5.0
$95,000
🖨 Deal sheet 📄 Offer letter ✓ Due diligence
Listing remarks MLS
1% RULE - Cute Duplex for sale in Overton! Each (A & B) unit consists of a large living area, 2 spacious bedrooms, 1 bathroom, and 1 kitchen. Both sides currently rented through 2026. Get two cash flowing doors added to your investment portfolio!
Key facts
- 7,006 sq ft lot
- Built 1934
- Listed 107 days
Neighborhood map
What this means for you Summary
Snapshot
- This is a 4-bed/2.0-bath single-family listed at $95k.
Deal economics
- At list price, monthly cash flow is $324 ($4k/yr) — positive.
- The deal already cash-flows at list — no discount required.
- Meets the 1% rule at list price ($1k rent vs $95k).
- Recommended offer: $86k (9.0% below list) — sets the bar for market timing.
Location & tenants
- Location reads 80/100 on livability (#37 in TX, #1,749 nationally) — a professional / high-income tenant draw. Strengths: commute A+, cost of living A+, housing A+; Watch: employment C-, schools D+, crime F.
- Lubbock ISD (urban): math 36% / reading 39% proficiency, ranked #481 of 826 in TX (top 58%) — families likely to look elsewhere, expect single-tenant / working-renter base with shorter leases; 60% free/reduced lunch — lower-income household profile, screen leases tightly.
- Market conditions: Rents rising fast (+8.3%/yr); 33 active listings in the ZIP; 40 comparable units currently listed for rent nearby; rentals at typical pace (median 21d on market — plan ~3-4 weeks tenant-placement turnaround); 45% of comp listings sitting > 30 days — soft ceiling on asking rent; lower-income renter base — watch delinquency; 2,219 units permitted in Lubbock County in 2024 (252 in 5+ unit buildings).
- At $1,307/mo this rent would consume 58% of the median local household income ($27k/yr) (locally 1389% of renters already pay >50% of income on rent) — very limited rent-growth headroom before tenants either downsize or default.
Forward outlook
- In year one you build about $7k of equity ($657 loan paydown + $6k appreciation (6.7% local appreciation)).
- Lubbock County population projected at +39% by 2050 — long-run rental-demand tailwind backs the buy-and-hold thesis.
- At projected returns (6.7% appreciation + 8.0% rent growth), your $27k cash investment doubles in ~3 years — after that, you're playing with house money.
- By year 5, paydown + projected appreciation supports a ~$31k cash-out refi (75% LTV) — recoverable capital for the next deal without selling this one.
Negotiation context
- It's been on market 107 days — a 9% lower offer ($86k) is reasonable based on typical stale-listing flexibility.
- 2 sale attempts since 7y ago; this cycle's ask has dropped $15k (14%) from the opening price — seller is motivated, your offer sets the floor, not the list.
Risks & watch-outs
- Watch-outs: built in 1934 — expect roof / HVAC / electrical / plumbing capex.
- Climate carrying-cost: extreme-heat days projected 7→22/yr by 2055 (HVAC capex compounding) — expect insurance premiums to compound above CPI over the hold.
Questions for the listing agent
- It's been on market 107 days. Have you received any prior offers? Is the seller open to a 9% concession, seller financing, or rate buy-down credit?
- Built in 1934 — when were the roof, HVAC, electrical panel, plumbing, and water heater last replaced?
- Why hasn't it sold? Are there any deal-killer items the seller is aware of (foundation, flood, title, zoning, code violations)?
- Is there a deadline driving the sale (1031 exchange, divorce, estate, relocation)? That informs how much negotiation room exists.
- Schools are D-rated, which usually means shorter tenancies and higher turnover. Who's the typical renter profile here, and what's been the actual vacancy rate?
- Crime grade is F in this area — have there been break-ins, vandalism, or insurance claims at this property in the last 3 years? What carrier currently insures it and at what premium?
- What's the average days-on-market for RENTAL listings here right now (not sales)? A rising rental-DOM trend means longer vacancies and softer asking-rent achievability than the comps imply.
- What's the recent tenant-quality profile in this submarket — average credit score on applications, eviction rate, late-payment / NSF rate, and stable-employment percentage? A property-management company in the area should have these aggregated.
- How much new for-sale + rental construction is in the pipeline within 1–3 miles? Heavy new supply typically softens prices + rents 12–24 months out; constrained supply supports both.
Investment metrics
- 1% rule
- 1.38% ✓
- Cap rate
- 10.39%
- Cash-on-cash
- 14.62%
- DSCR
- 1.65
- GRM
- 6.1
CMA / ARV
No comps found within radius.
Projected returns pro-forma
6.7% appreciation · 8.0% rent growth · sell at horizon
- IRR
- 31.9%
- Equity multiple
- 3.22×
- Total profit
- $59,043
- Equity at exit
- $63,995
- IRR
- 31.6%
- Equity multiple
- 7.54×
- Total profit
- $173,869
- Equity at exit
- $119,934
Cash invested: $26,600 (down + closing). Projections, not guarantees.
Landlord ↔ Tenant lean methodology
- Overall (STATE)
- 87 Strongly Landlord-Friendly
- State Texas
- 87 Strongly Landlord-Friendly · R+5
- County
- — inherits STATE
- City
- — inherits STATE
ZIP-level market 79401
- Home prices YoY
- 3.0%
- Rents YoY
- 8.3%
- Active inventory
- 33
- Price-to-rent
- 6.1×
Monthly cashflow live
- Estimated rent
- $1,307 high interval (Pro) →
- Mortgage (P&I)
- −$498
- Tax from tax record
- −$171 /mo · $2,052/yr
- Insurance
- −$40
- HOA
- −$0
- Vacancy / Maint / Mgmt
- −$275
- Net cashflow
- $324
Break-even live
UW: 25.0% down · 7.5% · 30yr · 1.5% tax · 5.0% vac · 8.0% maint · 8.0% mgmt
Financing live
Cash to close
- Down payment
- $23,750
- Closing costs
- $2,850
- Reserves months
- —
- Total cash needed
- —
Loan-product check · same deal, 3 products live
Conventional
25% down · 7.5% · 30yr
- Down + closing
- —
- Monthly P&I
- —
- Monthly cashflow
- —
- DSCR
- —
- Eligible?
- —
Personal DTI + credit; lowest rate.
DSCR
20% down · 8.5% · 30yr
- Down + closing
- —
- Monthly P&I
- —
- Monthly cashflow
- —
- DSCR
- —
- Eligible?
- —
No personal income docs; deal must DSCR.
Hard money
10% down · 12.0% · 12mo
- Down + closing
- —
- Monthly P&I
- —
- Monthly cashflow
- —
- DSCR
- —
- Eligible?
- —
Short-term bridge; refi at stabilization.
Rent comps 40 comps
| Address | Beds | Baths | Sqft | Rent | $/sqft | DOM | Units | Dist |
|---|---|---|---|---|---|---|---|---|
| 1909 16th St Lubbock, TX | 4.0 | 2.0 | 1312 | $1,600 | $1.22 | 21d | 1 | 0.18mi |
| 1912 20th St Unit A Lubbock, TX | 3.0 | 2.0 | 1590 | $1,000 | $0.63 | 21d | 1 | 0.19mi |
| 1922 18th St Lubbock, TX | 3.0 | 1.0 | 1136 | $1,050 | $0.92 | 21d | 1 | 0.20mi |
| 1912 21st St Lubbock, TX | 3.0 | 2.0 | 1473 | $1,025 | $0.70 | 43d | 1 | 0.24mi |
| 1601 21st St Unit a Lubbock, TX | 3.0 | 2.0 | 980 | $925 | $0.94 | 13d | 1 | 0.28mi |
| 2104 20th St Lubbock, TX | 4.0 | 2.0 | 1796 | $1,700 | $0.95 | 21d | 1 | 0.33mi |
| 2109 20th St Lubbock, TX | 3.0 | 2.0 | 1391 | $1,200 | $0.86 | 43d | 1 | 0.37mi |
| 1716 24th St Lubbock, TX | 4.0 | 2.0 | 1742 | $1,850 | $1.06 | 43d | 1 | 0.40mi |
| 1904 24th St Lubbock, TX | 3.0 | 1.0 | 1172 | $1,100 | $0.94 | 43d | 1 | 0.41mi |
| 2124 20th St Lubbock, TX | 3.0 | 2.0 | 1481 | $1,150 | $0.78 | 13d | 1 | 0.42mi |
| 2009 23rd St Lubbock, TX | 3.0 | 1.0 | 1615 | $1,249 | $0.77 | 43d | 1 | 0.45mi |
| 2121 17th St Lubbock, TX | 3.0 | 1.0 | 1048 | $995 | $0.95 | 21d | 1 | 0.45mi |
| 2123 18th St Lubbock, TX | 3.0 | 2.0 | 1328 | $949 | $0.71 | 13d | 1 | 0.46mi |
| 2119 15th St Lubbock, TX | 3.0 | 2.0 | 1600 | $1,400 | $0.88 | 43d | 1 | 0.47mi |
| 2015 Avenue L Unit B Lubbock, TX | 3.0 | 2.0 | 980 | $960 | $0.98 | 13d | 1 | 0.49mi |
| 2118 24th St Lubbock, TX | 3.0 | 1.0 | 1435 | $1,000 | $0.70 | 21d | 1 | 0.54mi |
| 1517 25th St Lubbock, TX | 3.0 | 2.0 | 1514 | $1,095 | $0.72 | 21d | 1 | 0.57mi |
| 2220 16th St Lubbock, TX | 3.0 | 2.0 | 1414 | $1,300 | $0.92 | 21d | 1 | 0.58mi |
| 1915 26th St Lubbock, TX | 3.0 | 1.0 | 1221 | $1,100 | $0.90 | 43d | 1 | 0.59mi |
| 2119 25th St Lubbock, TX | 3.0 | 1.5 | 1184 | $1,200 | $1.01 | 43d | 1 | 0.62mi |
| 1920 27th St Unit 1 Lubbock, TX | 3.0 | 3.0 | 1366 | $1,500 | $1.10 | 43d | 1 | 0.63mi |
| 2123 25th St Unit rear Lubbock, TX | 3.0 | 1.0 | 1000 | $950 | $0.95 | 43d | 1 | 0.63mi |
| 1202 Main St Lubbock, TX | 3.0 | 1.0–2.0 | 919 | $1,653 | $1.80 | 13d | 13 | 0.67mi |
| 2220 25th St Lubbock, TX | 4.0 | 1.0 | 1077 | $695 | $0.65 | 21d | 1 | 0.68mi |
| 2402 21st St Lubbock, TX | 3.0 | 1.0 | 1453 | $1,500 | $1.03 | 43d | 1 | 0.70mi |
| 707 Avenue T Lubbock, TX | 3.0–4.0 | 3.0–4.0 | 1559 | $699 | $0.45 | 43d | 45 | 0.72mi |
| 1607 Avenue Y Unit Y Lubbock, TX | 4.0 | 2.0 | 1532 | $2,100 | $1.37 | 13d | 1 | 0.76mi |
| 2311 25th St Lubbock, TX | 4.0 | 2.0 | 1400 | $1,400 | $1.00 | 21d | 1 | 0.76mi |
| 2201 28th St Lubbock, TX | 3.0 | 1.0 | 1246 | $995 | $0.80 | 21d | 1 | 0.81mi |
| 2409 13th St Unit 8 Lubbock, TX | 3.0 | 2.0 | 1200 | $1,100 | $0.92 | 43d | 1 | 0.82mi |
| 2404 25th St Lubbock, TX | 3.0 | 2.0 | 1292 | $1,395 | $1.08 | 21d | 1 | 0.84mi |
| 2404 27th St Lubbock, TX | 4.0 | 2.0 | 1250 | $1,349 | $1.08 | 43d | 1 | 0.91mi |
| 2421 25th St Lubbock, TX | 3.0 | 2.0 | 1032 | $1,575 | $1.53 | 21d | 1 | 0.92mi |
| 2106 32nd St Lubbock, TX | 3.0 | 1.0 | 1398 | $925 | $0.66 | 43d | 1 | 0.98mi |
| 2106 32nd St Lubbock, TX | 3.0 | 1.0 | 1398 | $695 | $0.50 | 21d | 1 | 0.98mi |
| 2416 30th St Lubbock, TX | 3.0 | 2.0 | 1746 | $1,425 | $0.82 | 21d | 1 | 1.09mi |
| 2211 33rd St Unit A Lubbock, TX | 3.0 | 1.5 | 1293 | $1,200 | $0.93 | 43d | 1 | 1.14mi |
| 2411 31st St Lubbock, TX | 3.0 | 1.0 | 1003 | $1,000 | $1.00 | 21d | 1 | 1.14mi |
| 2620 25th St Lubbock, TX | 3.0 | 1.0 | 1282 | $1,600 | $1.25 | 43d | 1 | 1.16mi |
| 2430 31st St Lubbock, TX | 3.0 | 2.0 | 1592 | $1,450 | $0.91 | 43d | 1 | 1.19mi |
Listing history 19 events
-
2026-06-18days on market $95,000 Active 107 DOM
-
2026-06-17days on market $95,000 Active 106 DOM
-
2026-06-16days on market $95,000 Active 105 DOM
-
2026-06-15days on market $95,000 Active 104 DOM
-
2026-06-14days on market $95,000 Active 102 DOM
-
2026-06-13days on market $95,000 Active 101 DOM
-
2026-06-10days on market $95,000 Active 99 DOM
-
2026-06-09days on market $95,000 Active 98 DOM
-
2026-06-09price $95,000 Active 97 DOM
-
2026-06-08days on market $110,000 Active 97 DOM
-
2026-06-07days on market $110,000 Active 96 DOM
-
2026-06-05days on market $110,000 Active 93 DOM
-
2026-06-03days on market $110,000 Active 92 DOM
-
2026-06-03status $110,000 Active 91 DOM
-
2026-02-25$110,000 Active 252-char remark
Show marketing remark (252 chars)
1% RULE - Cute Duplex for sale in Overton! Each (A & B) unit consists of a large living area, 2 spacious bedrooms, 1 bathroom, and 1 kitchen. Both sides currently rented through 2026. Get two cash flowing doors added to your investment portfolio!
-
2022-02-20price $600
-
2019-11-05$109,000
-
2019-09-13soldstatus
-
2019-09-05soldstatus
ⓘ Source: listings_history table (triggers on properties + properties_extension) + one-shot
backfill from property_details.listing_events for pre-trigger history.
Tax reassessment forecast TX · Resets to sale price
- Current annual tax
- $2,052 · $171/mo
- Projected year-2 tax
- $2,052 · $171/mo
- Expected delta
- $0/yr ($0/mo · 0.0%)
ⓘ Screening estimate from a state-policy table — verify with the county assessor before closing.
Climate risk First Street
- Flood 1/10 Low FEMA zone X (unshaded) · 0% chance over 30 yrs
- Wildfire 1/10 Low
- Heat 5/10 Major 7 d/yr ≥100°F today · 22 d/yr by 30 yrs out
- Wind 2/10 Low
- Air quality 2/10 Low 1 unhealthy d/yr today · 1 by 30 yrs out
Nearby sold comps map
Loading sold comps map…
Walkable amenities ~0.75 mi
Loading nearby amenities…
Taxation est. · year 1
- Rental income
- $15,687
- − Mortgage interest
- −$5,321
- − Property taxes
- −$2,052
- − Insurance
- −$475
- − Repairs & maintenance
- −$1,255
- − Management
- −$1,255
- − Depreciation
- −$2,764
- Taxable income
- $2,566
- Est. tax owed @ 24.0%
- −$616
- After-tax cash flow
- $3,272/yr
For passive investors: Depreciation is non-cash, so a rental often shows a tax loss while cash-flowing — sheltering income. Rental losses are passive: they offset passive income freely, and up to $25,000/yr can offset ordinary (W-2) income if you actively participate and your MAGI is under $100k (phasing out to $0 by $150k); unused losses carry forward. On sale, claimed depreciation is recaptured at up to 25%, and gains may owe capital-gains tax (a 1031 exchange can defer both). Figures are a year-1 estimate at your 24.0% rate — not tax advice; consult a CPA.
Schools (NCES district)
- District
- Lubbock ISD
- NCES district ID
- 4828500
- Math proficiency
- 36% ▼ -8.00%
- Reading proficiency
- 39% ▼ -1.00%
- Median HH income
- $39,820
- Composite
- 31.44/100
- National rank
- #5984
- State rank
- #481 of 826 in TX
Livability — Lubbock
- Score
- 80/100
- State rank
- #37
- US rank
- #1749
Category grades
Schools grade is shown separately in the Schools card above.
Census & demographics
- Census place
- Lubbock, TX
- County
- Lubbock County · 293,542 people
- City population
- 283,030
- Metro
- Lubbock, TX
- Population (ZIP)
- 8,741
- Household income
- $26,980
- Rent vs Own
- Severe rent burden
- 1389.0
Population outlook (Lubbock County) Hauer SSP2
- Today (2025)
- 345,960 people
- By 2030
- 371,449 · +7.4%
- By 2040
- 424,539 · +22.7%
- By 2050
- 481,150 · +39.1%
- By 2075
- 633,467 · +83.1%
- By 2100
- 746,853 · +115.9%
Race, ethnicity, and origin ACS 2023
- Neighborhood character
- Diverse neighborhood (Simpson 0.64)
- Race & ethnicity
- White 47% Hispanic / Latino 37% Two or more races 14% Black 8% Asian 5%
- Hispanic origin (detail)
- Mexican 29%
- Common ancestry
- Lithuanian 3% Romanian 1% Iranian 1%
- Foreign-born
- 11% · Canada, South Korea, Jamaica
- Languages at home
- 73% English-only · Spanish 20% Other Indo-European 3% Korean 1%
Political lean MEDSL · Lubbock
- 2024 margin
- Solid R (+39.5) · D 29.7% · R 69.2% · Other 1.0%
- 2008→2024 swing
- -2.8pp toward R · 2008: -36.7pp · 2024: -39.5pp
- All cycles
- 2024: R+39.5 2020: R+32.2 2016: R+38.4 2012: R+40.9 2008: R+36.7
Not yet ingested
- Civics
- —
Market trends
- HPI YoY
- ▲ 6.70%
- Current HPI
- 233.4915
- Rent YoY
- ▲ 8.31%
- Metro
- Lubbock, TX
- State GDP YoY
- ▲ 3.95%
- F500 in state
- 110
Industry mix (Fortune 500 HQ in TX)
| Industry | F500 HQs | Revenue |
|---|---|---|
| Energy | 16 | $1,198B |
|
||
| Technology | 5 | $198B |
|
||
| Engineering / Construction | 4 | $72B |
|
||
| Energy Services | 3 | $60B |
|
||
| Utilities | 3 | $41B |
|
||
| Healthcare | 2 | $330B |
|
||
Price history
+0.9% since first listed5 events — show timeline
- 2026-02-25 Listed $110,000 LARMLS
- 2022-02-20 Price Changed $600 RENT.
- 2019-11-05 Listed $109,000 LARMLS
- 2019-09-13 Sold (Public Records) — Public Records
- 2019-09-05 Sold (Public Records) — Public Records
Property tax history
+5.4%/yrLatest (2025): $2,052 · -5.5% YoY. Source: county tax records.
Cash-flow waterfall
monthlySold comps — $/sqft
last 12 mo · ≤1 miLoading sold comps…