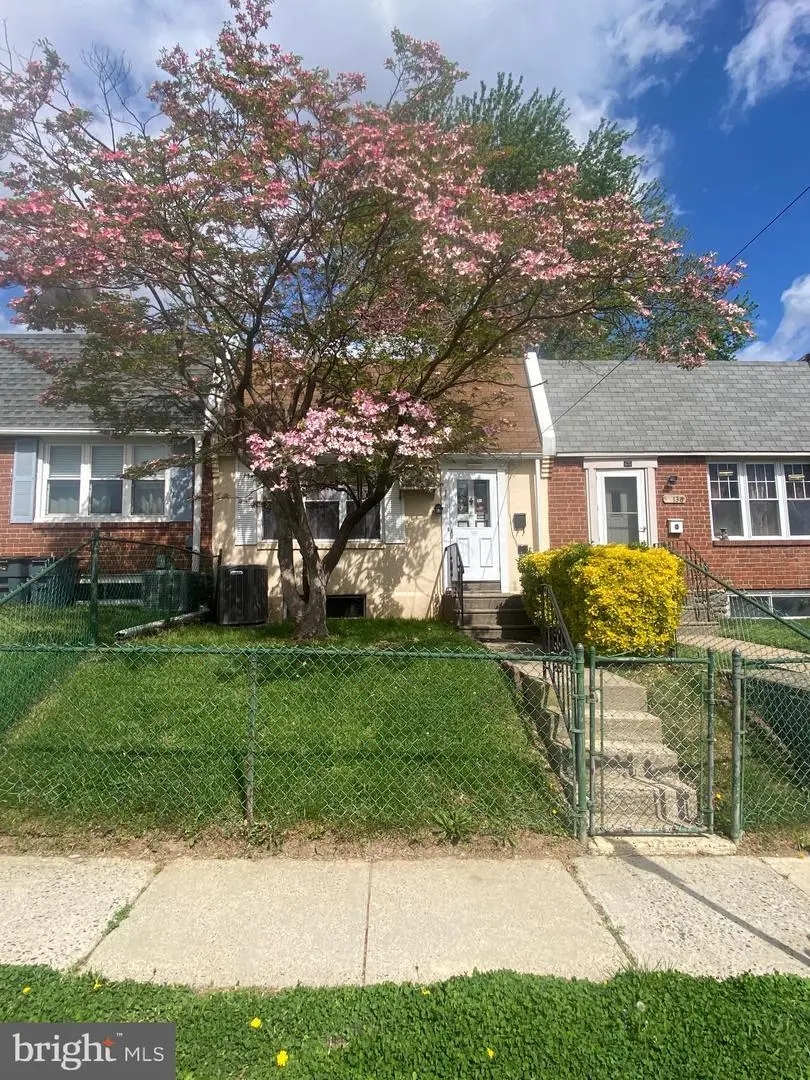
134 Fronefield Ave · Linwood, PA
Flood risk 1/10 · Minimal
- FEMA flood zone
- X (unshaded)
- Chance of flooding over 30 yrs
- 0.0%
- Est. flood insurance / yr
- $473 – $860
Fire risk 1/10 · Minimal
- Est. fire insurance / yr
- $511 – $949
Heat risk 7/10 · Major
- Hot days now (above 104°F)
- 7 days/yr
- Hot days in 30 yrs
- 15 days/yr
Wind risk 6/10 · Moderate
- Chance of severe wind over 30 yrs
- 27.0%
Air-quality risk 4/10 · Minor
- Unhealthy air days now
- 4 days/yr
- Unhealthy air days in 30 yrs
- 7 days/yr
Risk factors via First Street. Map © Google.
Why this score? — see what drove the C+ grade
The composite is a weighted blend of 9 inputs, each scored 0–100. Each bar is that input's sub-score; the figure is the points it added to the 100-point composite (weight × sub-score).
- Cash flow +25.3/30.0
- ARV discount +9.5/15.0
- DSCR +8.3/10.0
- 1% rule +5.6/10.0
- Livability +4.0/5.0
- Rent growth +3.0/5.0
- Schools +2.7/10.0
- Condition / age +2.5/5.0
- Appreciation +0.0/10.0
$159,900
🖨 Deal sheet 📄 Offer letter ✓ Due diligence
Listing remarks
Welcome to this well-maintained and spacious 3-bedroom, 1.5-bath bi-level home offering incredible potential and classic charm throughout. Home offers Inviting curb appeal, highlighted by a beautiful flowering tree in the fully fenced front yard. Step inside to an extra-large living room featuring vaulted ceilings (hidden above the drop ceiling), creating a sense of openness and volume rarely found in homes like this. Beneath the existing carpeting, you’ll find original hardwood parquet flooring ready to be restored to its full beauty. The layout offers a functional bi-level design, providing defined living spaces while maintaining great flow. The kitchen is outfitted with durable vi
Key facts
- Vaulted ceilings
- Flowering tree
- Built 1950
Tags
Property features AI
Exterior
- Utilities: Public water; Public sewer
- Home design: Interior townhouse/rowhouse; Fee simple ownership
- Construction: Brick construction; Concrete perimeter foundation; Above-grade and below-grade structures
- Exterior features: Lot dimensions approximately 20 x 99; No tidal water
Interior
- Kitchen: Kitchen
- Bedrooms: Two bedrooms on the upper level; One bedroom on the lower level
- Bathrooms: One full bathroom (upper level); One half bathroom (lower level)
- Heating & cooling: 90% forced air heating (natural gas); Central air conditioning (natural gas)
- Interior features: Living room; Dining room; Basement (unfinished, heated, poured concrete); Laundry
- Laundry & utility: Laundry area
Neighborhood map
What this means for you Summary
Snapshot
- This is a 3-bed/1.5-bath townhouse listed at $160k.
Deal economics
- At list price, monthly cash flow is $363 ($4k/yr) — positive.
- The deal already cash-flows at list — no discount required.
- Meets the 1% rule at list price ($2k rent vs $160k).
Location & tenants
- Location reads 79/100 on livability (#234 in PA, #2,020 nationally) — a middle-class / working-renter tenant base. Strengths: cost of living A+, housing A+, crime A; Watch: commute D+, amenities F.
- Chichester SD (suburban): math 19% / reading 41% proficiency, ranked #438 of 539 in PA (top 81%) — families likely to look elsewhere, expect single-tenant / working-renter base with shorter leases.
- Market conditions: Rents rising (+1.8%/yr); 68 active listings in the ZIP; 5 comparable units currently listed for rent nearby; rentals at typical pace (median 24d on market — plan ~3-4 weeks tenant-placement turnaround); 40% of comp listings sitting > 30 days — soft ceiling on asking rent; solid renter incomes; 299 units permitted in Delaware County in 2024 (5 in 5+ unit buildings).
Forward outlook
- Local home prices are declining (-3.0%/yr); year-one equity from $1k of loan paydown is wiped out by about $5k of value loss. Plan a longer hold.
Negotiation context
- Only 9 days on market — expect competitive offers; lowballing is unlikely to land.
- Current owner paid $48k; list at $160k implies a 234% gain — meaningful room to come down on a strong offer.
Risks & watch-outs
- Watch-outs: built in 1950 — expect roof / HVAC / electrical / plumbing capex.
- Climate carrying-cost: major wind risk, 27% chance of damaging wind over 30y; extreme-heat days projected 7→15/yr by 2055 (HVAC capex compounding) — expect insurance premiums to compound above CPI over the hold.
Questions for the listing agent
- Built in 1950 — when were the roof, HVAC, electrical panel, plumbing, and water heater last replaced?
- Is there a deadline driving the sale (1031 exchange, divorce, estate, relocation)? That informs how much negotiation room exists.
- What's the average days-on-market for RENTAL listings here right now (not sales)? A rising rental-DOM trend means longer vacancies and softer asking-rent achievability than the comps imply.
- What's the recent tenant-quality profile in this submarket — average credit score on applications, eviction rate, late-payment / NSF rate, and stable-employment percentage? A property-management company in the area should have these aggregated.
- How much new for-sale + rental construction is in the pipeline within 1–3 miles? Heavy new supply typically softens prices + rents 12–24 months out; constrained supply supports both.
Investment metrics
- 1% rule
- 1.06% ✓
- Cap rate
- 9.02%
- Cash-on-cash
- 9.73%
- DSCR
- 1.43
- GRM
- 7.8
CMA / ARV
- ARV (median comp)
- $167,395
- List price
- $159,900
- Delta
- -4.48%
- Verdict
- FAIR
- Comps
- 20 within 1.0 mi
Show comp detail 12 sales within ~0.75 mi
| Address | Dist | Beds/Ba | Sqft | Sold | Price | $/sf | Match |
|---|---|---|---|---|---|---|---|
| 105 Fronefield Ave | 0.06mi | 3/1.5 | 720 (0%) | 1mo | $146,000 | $203 | 96 |
| 135 Ervin | 0.06mi | 3/1.5 | 720 (0%) | 5mo | $118,000 | $164 | 93 |
| 1556 Summit St | 0.09mi | 3/1.5 | 720 (0%) | 4mo | $216,000 | $300 | 92 |
| 119 Chadwick Ave | 0.11mi | 3/1.0 | 720 (0%) | 2mo | $213,000 | $296 | 91 |
| 111 Ervin Ave | 0.08mi | 3/1.5 | 720 (0%) | 10mo | $196,000 | $272 | 88 |
| 163 Chadwick Ave | 0.12mi | 3/1.5 | 720 (0%) | 9mo | $175,000 | $243 | 87 |
| 156 Fronefield Ave | 0.04mi | 2/1.5 (-1) | 720 (0%) | 8mo | $160,000 | $222 | 86 |
| 1592 Summit St | 0.09mi | 3/1.0 | 720 (0%) | 10mo | $199,900 | $278 | 85 |
| 332 White Ave | 0.30mi | 3/2.0 | 720 (0%) | 2mo | $230,000 | $319 | 82 |
| 1412 Simpson St | 0.27mi | 3/1.0 | 720 (0%) | 7mo | $195,000 | $271 | 80 |
| 325 White Ave | 0.31mi | 3/1.0 | 720 (0%) | 6mo | $179,900 | $250 | 79 |
| 2514 Thomas Ave | 0.64mi | 2/1.0 (-1) | 800 (+11%) | 9mo | $170,000 | $213 | 37 |
Match score weights: distance 35% · size 25% · config 20% · recency 20%. Top-matched comps best support the ARV.
Projected returns pro-forma
-3.0% appreciation · 1.83% rent growth · sell at horizon
- IRR
- -2.9%
- Equity multiple
- 0.89×
- Total profit
- $-4,813
- Equity at exit
- $23,842
- IRR
- 5.5%
- Equity multiple
- 1.39×
- Total profit
- $17,453
- Equity at exit
- $13,825
Cash invested: $44,772 (down + closing). Projections, not guarantees.
Landlord ↔ Tenant lean methodology
- Overall (STATE)
- 62 Landlord-Friendly
- State Pennsylvania
- 62 Landlord-Friendly · EVEN
- County
- — inherits STATE
- City
- — inherits STATE
ZIP-level market 19061
- Rents YoY
- 1.8%
- Active inventory
- 68
- Price-to-rent
- 7.8×
Monthly cashflow live
- Estimated rent
- $1,699 high interval (Pro) →
- Mortgage (P&I)
- −$839
- Tax from tax record
- −$74 /mo · $889/yr
- Insurance
- −$67
- HOA
- −$0
- Vacancy / Maint / Mgmt
- −$357
- Net cashflow
- $363
Break-even live
UW: 25.0% down · 7.5% · 30yr · 1.5% tax · 5.0% vac · 8.0% maint · 8.0% mgmt
Financing live
Cash to close
- Down payment
- $39,975
- Closing costs
- $4,797
- Reserves months
- —
- Total cash needed
- —
Loan-product check · same deal, 3 products live
Conventional
25% down · 7.5% · 30yr
- Down + closing
- —
- Monthly P&I
- —
- Monthly cashflow
- —
- DSCR
- —
- Eligible?
- —
Personal DTI + credit; lowest rate.
DSCR
20% down · 8.5% · 30yr
- Down + closing
- —
- Monthly P&I
- —
- Monthly cashflow
- —
- DSCR
- —
- Eligible?
- —
No personal income docs; deal must DSCR.
Hard money
10% down · 12.0% · 12mo
- Down + closing
- —
- Monthly P&I
- —
- Monthly cashflow
- —
- DSCR
- —
- Eligible?
- —
Short-term bridge; refi at stabilization.
Rent comps 5 comps
| Address | Beds | Baths | Sqft | Rent | $/sqft | DOM | Units | Dist |
|---|---|---|---|---|---|---|---|---|
| 117 Ervin Ave Marcus Hook, PA | 3.0 | 1.5 | 720 | $1,595 | $2.22 | 20d | 1 | 0.08mi |
| 1006 Keystone Rd Chester, PA | 2.0 | 1.0 | 750 | $1,200 | $1.60 | 24d | 1 | 1.13mi |
| 1107-1115 Keystone Rd Chester, PA | 2.0 | 1.0 | 700 | $1,250 | $1.79 | 43d | 1 | 1.14mi |
| 908 Keystone Rd Chester, PA | 2.0 | 1.0 | 750 | $1,200 | $1.60 | 43d | 1 | 1.17mi |
| 3360 Chichester Ave Boothwyn, PA | 1.0–2.0 | 1.0–2.0 | 725 | $1,700 | $2.34 | 1d | 27 | 1.37mi |
Listing history 3 events
-
2026-05-03historical Active Under Contract 1486-char remark
-
2026-04-24$159,900 Active 1486-char remark
-
1987-01-05soldstatus $47,900
ⓘ Source: listings_history table (triggers on properties + properties_extension) + one-shot
backfill from property_details.listing_events for pre-trigger history.
Tax reassessment forecast PA · Partial reset (capped growth)
- Current annual tax
- $889 · $74/mo
- Projected year-2 tax
- $1,708 · $142/mo
- Expected delta
- +$819/yr (+$68/mo · 92.1%)
ⓘ Screening estimate from a state-policy table — verify with the county assessor before closing.
Climate risk First Street
- Flood 1/10 Low FEMA zone X (unshaded) · 0% chance over 30 yrs
- Wildfire 1/10 Low
- Heat 7/10 Severe 7 d/yr ≥104°F today · 15 d/yr by 30 yrs out
- Wind 6/10 Major 27% chance of damaging wind over 30 yrs
- Air quality 4/10 Moderate 4 unhealthy d/yr today · 7 by 30 yrs out
Nearby sold comps map
Loading sold comps map…
Walkable amenities ~0.75 mi
Loading nearby amenities…
Taxation est. · year 1
- Rental income
- $20,390
- − Mortgage interest
- −$8,957
- − Property taxes
- −$889
- − Insurance
- −$800
- − Repairs & maintenance
- −$1,631
- − Management
- −$1,631
- − Depreciation
- −$4,652
- Taxable income
- $1,831
- Est. tax owed @ 24.0%
- −$439
- After-tax cash flow
- $3,918/yr
For passive investors: Depreciation is non-cash, so a rental often shows a tax loss while cash-flowing — sheltering income. Rental losses are passive: they offset passive income freely, and up to $25,000/yr can offset ordinary (W-2) income if you actively participate and your MAGI is under $100k (phasing out to $0 by $150k); unused losses carry forward. On sale, claimed depreciation is recaptured at up to 25%, and gains may owe capital-gains tax (a 1031 exchange can defer both). Figures are a year-1 estimate at your 24.0% rate — not tax advice; consult a CPA.
Schools (NCES district)
- District
- Chichester SD
- NCES district ID
- 4205910
- Math proficiency
- 19% ▼ -12.00%
- Reading proficiency
- 41% ▼ -17.00%
- Median HH income
- $57,612
- Composite
- 26.84/100
- National rank
- #7110
- State rank
- #438 of 539 in PA
Livability — Linwood
- Score
- 79/100
- State rank
- #234
- US rank
- #2020
Category grades
Schools grade is shown separately in the Schools card above.
Census & demographics
- Census place
- Linwood, PA
- County
- Delaware County · 399,863 people
- City population
- 20,135
- Metro
- Philadelphia-Camden-Wilmington, PA-NJ-DE-MD
- Population (ZIP)
- 19,896
- Household income
- $82,005
- Rent vs Own
- Severe rent burden
- 612.0
Population outlook (Delaware County) Hauer SSP2
- Today (2025)
- 577,490 people
- By 2030
- 581,243 · +0.6%
- By 2040
- 584,700 · +1.2%
- By 2050
- 586,581 · +1.6%
- By 2075
- 598,706 · +3.7%
- By 2100
- 590,823 · +2.3%
Race, ethnicity, and origin ACS 2023
- Neighborhood character
- Predominantly White (74%)
- Race & ethnicity
- White 74% Black 11% Hispanic / Latino 5% Two or more races 5% Asian 4%
- Hispanic origin (detail)
- Mexican 1% Puerto Rican 2%
- Common ancestry
- Romanian 5% Subsaharan African 3% Polish 2%
- Foreign-born
- 8% · Canada, China, South Korea
- Languages at home
- 90% English-only · Spanish 3% Chinese 3% Other Indo-European 1%
Political lean MEDSL · Delaware
- 2024 margin
- Strong D (+23.7) · D 61.4% · R 37.6% · Other 1.0%
- 2008→2024 swing
- +2.3pp toward D · 2008: 21.4pp · 2024: 23.7pp
- All cycles
- 2024: D+23.7 2020: D+26.7 2016: D+22.0 2012: D+21.8 2008: D+21.4
Not yet ingested
- Civics
- —
Market trends
- HPI YoY
- ▼ -187.71%
- Current HPI
- 265.507
- Rent YoY
- ▲ 1.83%
- Metro
- Philadelphia-Camden-Wilmington, PA-NJ-DE-MD
- State GDP YoY
- ▲ 1.68%
- F500 in state
- 34
Industry mix (Fortune 500 HQ in PA)
| Industry | F500 HQs | Revenue |
|---|---|---|
| Healthcare | 2 | $309B |
|
||
| Insurance | 2 | $27B |
|
||
| Telecommunications / Media | 1 | $124B |
|
||
| Industrial Distribution | 1 | $22B |
|
||
| Financial Services | 1 | $20B |
|
||
| Chemicals / Materials | 1 | $18B |
|
||
Price history
+233.8% since first listed4 events — show timeline
- 2026-05-26 Pending — BRIGHT MLS
- 2026-05-03 Contingent — BRIGHT MLS
- 2026-04-24 Listed $159,900 BRIGHT MLS
- 1987-01-05 Sold (Public Records) $47,900 Public Records
Property tax history
-6.9%/yrLatest (2026): $889 · -67.7% YoY. Source: county tax records.
Cash-flow waterfall
monthlySold comps — $/sqft
last 12 mo · ≤1 miLoading sold comps…