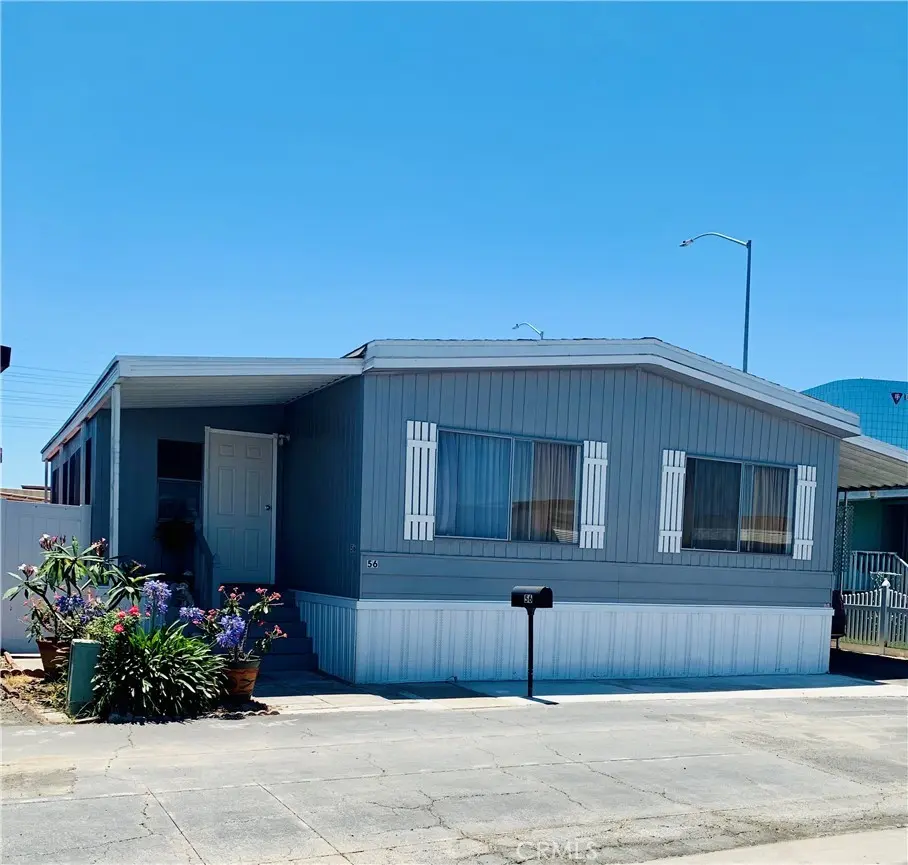
15621 Beach Blvd #56 · Huntington Beach, CA
Flood risk 1/10 · Minimal
- FEMA flood zone
- X
- Chance of flooding over 30 yrs
- 0.0%
- Est. flood insurance / yr
- $507 – $1,088
Fire risk 1/10 · Minimal
- Est. fire insurance / yr
- $659 – $1,223
Heat risk 5/10 · Moderate
- Hot days now (above 87°F)
- 7 days/yr
- Hot days in 30 yrs
- 22 days/yr
Wind risk 1/10 · Minimal
- Chance of severe wind over 30 yrs
- —
Air-quality risk 4/10 · Minor
- Unhealthy air days now
- 5 days/yr
- Unhealthy air days in 30 yrs
- 7 days/yr
Risk factors via First Street. Map © Google.
Why this score? — see what drove the B+ grade
The composite is a weighted blend of 9 inputs, each scored 0–100. Each bar is that input's sub-score; the figure is the points it added to the 100-point composite (weight × sub-score).
- Cash flow +30.0/30.0
- ARV discount +15.0/15.0
- 1% rule +10.0/10.0
- DSCR +10.0/10.0
- Schools +5.5/10.0
- Livability +3.4/5.0
- Rent growth +3.0/5.0
- Condition / age +2.5/5.0
- Appreciation +0.0/10.0
$165,000
🖨 Deal sheet 📄 Offer letter ✓ Due diligence
Listing remarks MLS
Reduced Price! This Newly Remodeled Home won't last long. In a highly sought after Park is where you will find this Beautiful Home. With an Open Floor Plan and High Ceilings you can entertain all your family. All New Flooring throughout New Painting inside and out All New Kitchen Cabinets and Counter Tops All New Window Blinds and Screens Remodeled Bathrooms with a New Shower Brand New Roof Walk in Closet The Park Amenities include: 2 Carwashes 2 Laundry Rooms Dog Park Clubhouse and Pool Room a Lovely Swimming Pool This is a must See! Shopping and Entertainment around the corner
Key facts
- Community amenities
- Coastal proximity
- Community pool
Tags
Property features AI
Finance
- Other: Access via city streets; Directions: coming from Garden Grove, south on Beach Blvd, pass McFadden, right on Driftwood Ln
- Financial info: Land lease of $1,850 per month
- HOA & community: Senior community; Street lighting; Manager approval required for residency; Pets allowed with breed restrictions
Exterior
- Parking: Located in Driftwood Mobile Park
- Utilities: Electricity on property; Natural gas connected; Sewer connected (public/unknown details); District/public water
- Home design: Manufactured/mobile home (24' x 48') — mobile home remains on site; Single-story
- Construction: Year built (per public records)
- Exterior features: Enclosed patio; Patio; Community pool; Paved access
Interior
- Kitchen: Gas range
- Bedrooms: All bedrooms located on the ground floor; Walk-in closet; Den
- Bathrooms: 2 full bathrooms; Showers
- Heating & cooling: Forced air heating
- Interior features: Ceiling fans; Open floor plan; Single-level living (one story, entry on level 1)
- Laundry & utility: Laundry inside the home; Gas dryer hookup
Neighborhood map
What this means for you Summary
Snapshot
- This is a 2-bed/2.0-bath manufactured listed at $165k.
Deal economics
- At list price, monthly cash flow is $1k ($15k/yr) — positive.
- The deal already cash-flows at list — no discount required.
- Meets the 1% rule at list price ($3k rent vs $165k).
- Cap rate 15.2% vs local median 1.6% in Huntington Beach — top-decile yield for the area; either an underpriced asset or a hidden risk that comps aren't pricing in. Stress-test before assuming the spread holds.
Location & tenants
- Location reads 67/100 on livability (#306 in CA) — a middle-class / working-renter tenant base. Strengths: employment A+, commute A-, schools B+; Watch: amenities C-, cost of living F, health & safety F.
- Ocean View (suburban): math 57% / reading 63% proficiency, ranked #207 of 1,400 in CA (top 15%) — acceptable for families but not a draw, mixed tenant base, ~2y average lease.
- Market conditions: Rents rising (+2.0%/yr); 87 active listings in the ZIP; 40 comparable units currently listed for rent nearby; rentals leasing fast (median 2d on market — plan ~1-2 weeks tenant-placement turnaround); solid renter incomes; 6,974 units permitted in Orange County in 2024 (3,839 in 5+ unit buildings).
- This rent runs 42% of the median local income ($86k/yr) — at the standard rent-burdened threshold; future hikes will face affordability resistance.
Forward outlook
- Local home prices are declining (-3.0%/yr); year-one equity from $1k of loan paydown is wiped out by about $5k of value loss. Plan a longer hold.
- Orange County population projected at +14% by 2050 — modest demand growth; plan on rents tracking national, not racing it.
- At projected returns (-3.0% appreciation + 2.0% rent growth), your $46k cash investment doubles in ~4 years — after that, you're playing with house money.
Negotiation context
- Only 7 days on market — expect competitive offers; lowballing is unlikely to land.
- 2 sale attempts since 4y ago with the ask held roughly flat each time — persistent listings suggest the price (not the market) is what's stuck; bring a comps-based counter.
- Current owner paid $120k; 38% above their basis — modest negotiation headroom, anchor on the comps not their cost.
Risks & watch-outs
- Climate carrying-cost: extreme-heat days projected 7→22/yr by 2055 (HVAC capex compounding) — expect insurance premiums to compound above CPI over the hold.
Questions for the listing agent
- Built in 1976 — when were the roof, HVAC, electrical panel, plumbing, and water heater last replaced?
- Is there a deadline driving the sale (1031 exchange, divorce, estate, relocation)? That informs how much negotiation room exists.
- Schools are B-rated — typically a magnet for longer-tenancy family renters. What's the average tenant stay here, and is there a school-zone premium baked into asking?
- What's the average days-on-market for RENTAL listings here right now (not sales)? A rising rental-DOM trend means longer vacancies and softer asking-rent achievability than the comps imply.
- What's the recent tenant-quality profile in this submarket — average credit score on applications, eviction rate, late-payment / NSF rate, and stable-employment percentage? A property-management company in the area should have these aggregated.
- How much new for-sale + rental construction is in the pipeline within 1–3 miles? Heavy new supply typically softens prices + rents 12–24 months out; constrained supply supports both.
Investment metrics
- 1% rule
- 1.81% ✓
- Cap rate
- 15.20%
- Cash-on-cash
- 31.80%
- DSCR
- 2.42
- GRM
- 4.6
CMA / ARV
- ARV (on-the-fly)
- $209,664
- Comps found
- 10
Show comp detail 10 sales within ~0.75 mi
| Address | Dist | Beds/Ba | Sqft | Sold | Price | $/sf | Match |
|---|---|---|---|---|---|---|---|
| 15621 Beach Blvd #112 | 0.00mi | 2/2.0 | 1,152 (0%) | 18mo | $210,000 | $182 | 85 |
| 15621 Beach Blvd #115 | 0.00mi | 2/2.0 | 1,060 (-8%) | 5mo | $180,000 | $170 | 82 |
| 15621 BEACH Blvd #23 | 0.00mi | 2/2.0 | 1,040 (-10%) | 2mo | $105,000 | $101 | 82 |
| 15621 Beach Blvd #24 | 0.00mi | 3/2.0 (+1) | 1,248 (+8%) | 9mo | $157,000 | $126 | 74 |
| 15621 Beach Blvd #113 | 0.00mi | 2/2.0 | 1,224 (+6%) | 20mo | $290,000 | $237 | 73 |
| 15621 Beach Blvd #158 | 0.00mi | 2/2.0 | 1,248 (+8%) | 17mo | $95,000 | $76 | 72 |
| 15621 Beach Blvd #8 | 0.00mi | 3/2.0 (+1) | 1,310 (+14%) | 13mo | $250,000 | $191 | 62 |
| 8200 Bosa Ave #92 | 0.68mi | 3/2.0 (+1) | 1,147 (-0%) | 5mo | $295,000 | $257 | 58 |
| 15621 BEACH Blvd #153 | 0.00mi | 3/2.0 (+1) | 1,316 (+14%) | 23mo | $240,000 | $182 | 52 |
| 8200 Bolsa Avenue, Unit 58 | 0.68mi | 3/2.0 (+1) | 1,152 (0%) | 22mo | $140,000 | $122 | 45 |
Match score weights: distance 35% · size 25% · config 20% · recency 20%. Top-matched comps best support the ARV.
Projected returns pro-forma
-3.0% appreciation · 2.01% rent growth · sell at horizon
- IRR
- 25.6%
- Equity multiple
- 2.05×
- Total profit
- $48,337
- Equity at exit
- $24,602
- IRR
- 32.7%
- Equity multiple
- 3.83×
- Total profit
- $130,813
- Equity at exit
- $14,266
Cash invested: $46,200 (down + closing). Projections, not guarantees.
Landlord ↔ Tenant lean methodology
- Overall (STATE)
- 18 Strongly Tenant-Friendly
- State California
- 18 Strongly Tenant-Friendly · D+13
- County
- — inherits STATE
- City
- — inherits STATE
ZIP-level market 92683
- Rents YoY
- 2.0%
- Active inventory
- 87
- Price-to-rent
- 4.6×
Monthly cashflow live
- Estimated rent
- $2,993 high interval (Pro) →
- Mortgage (P&I)
- −$865
- Tax est. 1.5%
- −$206 /mo · $2,475/yr
- Insurance
- −$69
- HOA
- −$0
- Vacancy / Maint / Mgmt
- −$629
- Net cashflow
- $1,224
Break-even live
UW: 25.0% down · 7.5% · 30yr · 1.5% tax · 5.0% vac · 8.0% maint · 8.0% mgmt
Financing live
Cash to close
- Down payment
- $41,250
- Closing costs
- $4,950
- Reserves months
- —
- Total cash needed
- —
Loan-product check · same deal, 3 products live
Conventional
25% down · 7.5% · 30yr
- Down + closing
- —
- Monthly P&I
- —
- Monthly cashflow
- —
- DSCR
- —
- Eligible?
- —
Personal DTI + credit; lowest rate.
DSCR
20% down · 8.5% · 30yr
- Down + closing
- —
- Monthly P&I
- —
- Monthly cashflow
- —
- DSCR
- —
- Eligible?
- —
No personal income docs; deal must DSCR.
Hard money
10% down · 12.0% · 12mo
- Down + closing
- —
- Monthly P&I
- —
- Monthly cashflow
- —
- DSCR
- —
- Eligible?
- —
Short-term bridge; refi at stabilization.
Rent comps 40 comps
| Address | Beds | Baths | Sqft | Rent | $/sqft | DOM | Units | Dist |
|---|---|---|---|---|---|---|---|---|
| 8041 Worthy Dr Westminster, CA | 2.0 | 1.0 | 900 | $2,700 | $3.00 | 1d | 1 | 0.35mi |
| 7400 Center Ave Huntington Beach, CA | 2.0 | 1.0–2.0 | 990 | $4,119 | $4.16 | 1d | 1 | 0.41mi |
| 7521 Edinger Ave Huntington Beach, CA | 3.0 | 1.0–2.0 | 1035 | $3,703 | $3.58 | 1d | 23 | 0.44mi |
| 7461 Edinger Ave Huntington Beach, CA | 2.0 | 1.0–2.0 | 1031 | $4,325 | $4.19 | 1d | 26 | 0.51mi |
| 7267 Aura Cir Huntington Beach, CA | 3.0 | 2.5 | 1389 | $4,500 | $3.24 | 1d | 1 | 0.61mi |
| 16162 Sher Ln Huntington Beach, CA | 1.0–3.0 | 1.0–1.5 | 1090 | $2,522 | $2.31 | 1d | 9 | 0.63mi |
| 8131 San Angelo Dr Huntington Beach, CA | 1.0 | 1.0 | 725 | $2,150 | $2.97 | 1d | 1 | 0.67mi |
| 7601 Amazon Dr Unit 2 Huntington Beach, CA | 2.0 | 2.0 | 1000 | $2,650 | $2.65 | 1d | 1 | 0.68mi |
| 7942 Stark Dr Huntington Beach, CA | 2.0 | 2.0 | 1000 | $2,495 | $2.50 | 15d | 1 | 0.70mi |
| 7672 Amazon Dr Unit 3 Huntington Beach, CA | 2.0 | 2.5 | 1400 | $2,975 | $2.12 | 10d | 1 | 0.70mi |
| 7290 Edinger Ave Huntington Beach, CA | 1.0–2.0 | 1.0–2.0 | 941 | $3,824 | $4.06 | 1d | 19 | 0.71mi |
| 7891 Holt Dr Unit 03 Huntington Beach, CA | 2.0 | 1.0 | 850 | $2,295 | $2.70 | 19d | 1 | 0.72mi |
| 16121 Malaga Ln Unit D Huntington Beach, CA | 2.0 | 2.0 | 1000 | $2,800 | $2.80 | 1d | 1 | 0.73mi |
| 8142 La Paz Dr Unit 7 Huntington Beach, CA | 1.0 | 1.0 | 725 | $1,950 | $2.69 | 10d | 1 | 0.80mi |
| 8142 La Paz Dr Unit 8 Huntington Beach, CA | 1.0 | 1.0 | 725 | $1,950 | $2.69 | 19d | 1 | 0.80mi |
| 15596 Dawson Ln Huntington Beach, CA | 3.0 | 2.0 | 1000 | $3,600 | $3.60 | 1d | 1 | 0.86mi |
| 8211 San Angelo Dr Huntington Beach, CA | 1.0 | 1.0 | 612 | $2,455 | $4.01 | 1d | 5 | 0.86mi |
| 8400 Edinger Ave Huntington Beach, CA | 2.0 | 1.0–2.0 | 778 | $3,007 | $3.87 | 1d | 13 | 0.90mi |
| 7912 Glencoe Dr Huntington Beach, CA | 3.0 | 1.0 | 1100 | $3,900 | $3.55 | 1d | 1 | 0.91mi |
| 16673 Viewpoint Ln Huntington Beach, CA | 2.0 | 1.0 | 847 | $2,795 | $3.30 | 13d | 1 | 1.17mi |
| 7082 Heil Ave #1 Huntington Beach, CA | 3.0 | 2.0 | 1438 | $3,500 | $2.43 | 1d | 1 | 1.19mi |
| 14332 Joyce Ave Westminster, CA | 3.0 | 2.0 | 1100 | $3,890 | $3.54 | 1d | 1 | 1.20mi |
| 16531 Kellog Cir Unit 1 Huntington Beach, CA | 3.0 | 2.0 | 1422 | $3,650 | $2.57 | 1d | 1 | 1.20mi |
| 14322 Joyce Ave Westminster, CA | 3.0 | 2.0 | 1200 | $4,190 | $3.49 | 5d | 1 | 1.20mi |
| 7921 Moonshadow Cir Unit 4 Huntington Beach, CA | 2.0 | 1.0 | 950 | $2,545 | $2.68 | 1d | 1 | 1.26mi |
| 16612 Bartlett Ln Unit 4 Huntington Beach, CA | 2.0 | 1.0 | 1000 | $2,600 | $2.60 | 19d | 1 | 1.27mi |
| 14452 Goldenwest St Westminster, CA | 2.0 | 1.5 | 1300 | $3,098 | $2.38 | 1d | 1 | 1.30mi |
| 7261 La Mancha Cir Unit C Huntington Beach, CA | 2.0 | 2.0 | 921 | $2,500 | $2.71 | 22d | 1 | 1.31mi |
| 16761 Viewpoint Ln Huntington Beach, CA | 2.0 | 1.5–2.0 | 938 | $2,863 | $3.05 | 1d | 15 | 1.32mi |
| 16781 Bardon Ln Unit A Huntington Beach, CA | 3.0 | 2.0 | 1300 | $3,195 | $2.46 | 7d | 1 | 1.33mi |
| 16652 Goldenwest St Huntington Beach, CA | 2.0 | 1.5 | 1200 | $2,600 | $2.17 | 10d | 1 | 1.34mi |
| 16652 Goldenwest St Apt 3 Huntington Beach, CA | 2.0 | 1.5 | 1200 | $2,600 | $2.17 | 1d | 1 | 1.34mi |
| 7643 14th St Westminster, CA | 2.0 | 2.0 | 1002 | $3,250 | $3.24 | 1d | 1 | 1.36mi |
| 15200 Magnolia St Westminster, CA | 1.0–2.0 | 1.0 | 762 | $2,675 | $3.51 | 2d | 2 | 1.36mi |
| 16682 Goldenwest St Unit 2 Huntington Beach, CA | 2.0 | 2.0 | 900 | $2,800 | $3.11 | 1d | 1 | 1.36mi |
| 7861 14th St Unit C Westminster, CA | 2.0 | 2.0 | 925 | $2,800 | $3.03 | 1d | 1 | 1.37mi |
| 7861 14th St Westminster, CA | 2.0 | 2.0 | 1025 | $2,700 | $2.63 | 3d | 1 | 1.37mi |
| 7792 15th St Westminster, CA | 1.0 | 1.0 | 950 | $2,400 | $2.53 | 3d | 1 | 1.38mi |
| 7701 Warner Ave Unit E081 Huntington Beach, CA | 1.0 | 1.0 | 750 | $2,445 | $3.26 | 1d | 1 | 1.40mi |
| 7701 Warner Ave Apt G115 Huntington Beach, CA | 1.0 | 1.0 | 750 | $2,535 | $3.38 | 1d | 1 | 1.40mi |
Listing history 7 events
-
2026-06-18days on market $165,000 Active 7 DOM
-
2026-06-17days on market $165,000 Active 6 DOM
-
2026-06-16days on market $165,000 Active 5 DOM
-
2026-06-15days on market $165,000 Active 4 DOM
-
2026-06-13days on market $165,000 Active 2 DOM
-
2026-06-13remarks 699-char remark
-
2026-06-13$165,000 Active 1 DOM
ⓘ Source: listings_history table (triggers on properties + properties_extension) + one-shot
backfill from property_details.listing_events for pre-trigger history.
Climate risk First Street
- Flood 1/10 Low FEMA zone X · 0% chance over 30 yrs
- Wildfire 1/10 Low
- Heat 5/10 Major 7 d/yr ≥87°F today · 22 d/yr by 30 yrs out
- Wind 1/10 Low
- Air quality 4/10 Moderate 5 unhealthy d/yr today · 7 by 30 yrs out
Nearby sold comps map
Loading sold comps map…
Walkable amenities ~0.75 mi
Loading nearby amenities…
Taxation est. · year 1
- Rental income
- $35,919
- − Mortgage interest
- −$9,243
- − Property taxes
- −$2,475
- − Insurance
- −$825
- − Repairs & maintenance
- −$2,874
- − Management
- −$2,874
- − Depreciation
- −$4,800
- Taxable income
- $12,829
- Est. tax owed @ 24.0%
- −$3,079
- After-tax cash flow
- $11,614/yr
For passive investors: Depreciation is non-cash, so a rental often shows a tax loss while cash-flowing — sheltering income. Rental losses are passive: they offset passive income freely, and up to $25,000/yr can offset ordinary (W-2) income if you actively participate and your MAGI is under $100k (phasing out to $0 by $150k); unused losses carry forward. On sale, claimed depreciation is recaptured at up to 25%, and gains may owe capital-gains tax (a 1031 exchange can defer both). Figures are a year-1 estimate at your 24.0% rate — not tax advice; consult a CPA.
Schools (NCES district)
- District
- Ocean View
- NCES district ID
- 0628140
- Math proficiency
- 57% ▬ 0.00%
- Reading proficiency
- 63% ▼ -1.00%
- Median HH income
- $77,469
- Composite
- 55.3/100
- National rank
- #2725
- State rank
- #207 of 1400 in CA
Livability — Huntington Beach
- Score
- 67/100
- State rank
- #306
- US rank
- #10298
Category grades
Schools grade is shown separately in the Schools card above.
Census & demographics
- Census place
- Huntington Beach, CA
- County
- Orange County · 3,096,323 people
- City population
- 194,835
- Metro
- Los Angeles-Long Beach-Anaheim, CA
- Population (ZIP)
- 89,833
- Household income
- $85,585
- Rent vs Own
- Severe rent burden
- 4639.0
Population outlook (Orange County) Hauer SSP2
- Today (2025)
- 3,477,456 people
- By 2030
- 3,613,117 · +3.9%
- By 2040
- 3,835,945 · +10.3%
- By 2050
- 3,968,736 · +14.1%
- By 2075
- 4,097,053 · +17.8%
- By 2100
- 3,903,633 · +12.3%
Race, ethnicity, and origin ACS 2023
- Neighborhood character
- Diverse neighborhood (Simpson 0.64)
- Race & ethnicity
- Asian 51% Hispanic / Latino 24% White 20% Two or more races 9%
- Hispanic origin (detail)
- Mexican 20%
- Common ancestry
- Slovak 1% Portuguese 1% Lithuanian 1%
- Foreign-born
- 46% · Vietnam, Canada, China
- Languages at home
- 35% English-only · Vietnamese 40% Spanish 18% Chinese 2%
Political lean MEDSL · Orange
- 2024 margin
- Toss-up / Even · D 49.7% · R 47.1% · Other 3.2%
- 2008→2024 swing
- +5.2pp toward D · 2008: -2.6pp · 2024: 2.6pp
- All cycles
- 2024: D+2.6 2020: D+9.0 2016: D+7.7 2012: R+8.3 2008: R+2.6
Not yet ingested
- Civics
- —
Market trends
- HPI YoY
- ▼ -917.95%
- Current HPI
- 410.3463
- Rent YoY
- ▲ 2.01%
- Metro
- Los Angeles-Long Beach-Anaheim, CA
- State GDP YoY
- ▲ 3.21%
- F500 in state
- 116
Industry mix (Fortune 500 HQ in CA)
| Industry | F500 HQs | Revenue |
|---|---|---|
| Technology | 27 | $1,492B |
|
||
| Financial Services | 3 | $174B |
|
||
| Retail | 3 | $44B |
|
||
| Insurance | 3 | $26B |
|
||
| Media / Entertainment | 2 | $115B |
|
||
| Pharmaceuticals / Biotech | 2 | $62B |
|
||
Price history
+17.9% since first listed10 events — show timeline
- 2026-06-11 Listed $165,000 CRMLS
- 2022-06-03 Sold (MLS) $120,000 CRMLS
- 2022-05-24 Pending — CRMLS
- 2022-05-13 Contingent — CRMLS
- 2022-04-27 Price Changed $130,000 CRMLS
- 2022-04-19 Price Changed $135,000 CRMLS
- 2022-04-05 Price Changed $135,500 CRMLS
- 2022-03-29 Price Changed $137,500 CRMLS
- 2022-03-14 Price Changed $139,500 CRMLS
- 2022-02-14 Listed $140,000 CRMLS
Property tax history
-0.5%/yrLatest (2022): $53 · -0.1% YoY. Source: county tax records.
Cash-flow waterfall
monthlySold comps — $/sqft
last 12 mo · ≤1 miLoading sold comps…