2910 Squire Ln · Evansville, IN
Flood risk 1/10 · Minimal
- FEMA flood zone
- AE
- Chance of flooding over 30 yrs
- 0.0%
- Est. flood insurance / yr
- $1,737 – $8,500
Fire risk 1/10 · Minimal
- Est. fire insurance / yr
- $717 – $1,331
Heat risk 5/10 · Moderate
- Hot days now (above 106°F)
- 7 days/yr
- Hot days in 30 yrs
- 19 days/yr
Wind risk 3/10 · Minor
- Chance of severe wind over 30 yrs
- 5.0%
Air-quality risk 3/10 · Minor
- Unhealthy air days now
- 3 days/yr
- Unhealthy air days in 30 yrs
- 4 days/yr
Risk factors via First Street. Map © Google.
Why this score? — see what drove the C- grade
The composite is a weighted blend of 9 inputs, each scored 0–100. Each bar is that input's sub-score; the figure is the points it added to the 100-point composite (weight × sub-score).
- Cash flow +22.1/30.0
- DSCR +7.1/10.0
- 1% rule +5.2/10.0
- ARV discount +5.2/15.0
- Schools +3.3/10.0
- Livability +3.2/5.0
- Rent growth +2.5/5.0
- Condition / age +2.5/5.0
- Appreciation +0.0/10.0
$167,500
🖨 Deal sheet (PDF) 📄 Offer letter ✓ Due diligence
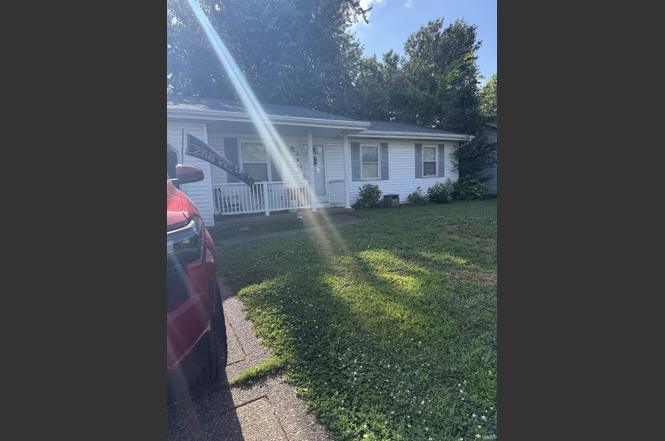
Listing remarks
Conveniently located near all the amenities the East Side has to offer, this charming home is full of potential and offers the perfect opportunity to add your personal touch. Featuring a spacious living room that flows effortlessly into the eat-in kitchen, the layout provides a comfortable and functional space for everyday living and entertaining. The generously sized primary bedroom includes a large closet, while the second and third bedrooms also offer ample closet space and versatility for family, guests, or a home office. Outside, you'll find a fully fenced backyard that's perfect for pets, gardening, outdoor gatherings, or simply relaxing. A yard barn provides additional storage for to
Key facts
- Attached garage
- Eat-in kitchen
- 7,405 sq ft lot
Tags
Property features AI
Exterior
- Parking: Detached 1-car garage
- Utilities: Public water; Public sewer
- Home design: Single-family, site-built home; One story
- Construction: Vinyl siding; Shingle roof
- Exterior features: Level lot; Yard includes a shed
Interior
- Bathrooms: One full bathroom on the main level
- Heating & cooling: Central air conditioning
- Interior features: Crawl space basement; Total of 5 rooms
- Laundry & utility: Main-level laundry
Neighborhood map
What this means for you Summary
Snapshot
- This is a 3-bed/1.0-bath single-family listed at $168k.
Deal economics
- At list price, monthly cash flow is $-156 ($-2k/yr) — negative.
- To cash-flow at today's rent, offer at most $140k (16.5% below list).
- Meets the 1% rule at list price ($2k rent vs $168k).
- Recommended offer: $140k (16.5% below list) — sets the bar for cash-flow.
- Cap rate 8.2% vs local median 4.6% in Evansville — top-decile yield for the area; either an underpriced asset or a hidden risk that comps aren't pricing in. Stress-test before assuming the spread holds.
Location & tenants
- Location reads 63/100 on livability (#416 in IN) — a middle-class / working-renter tenant base. Strengths: cost of living A+, housing A+, health & safety A+; Watch: crime F, commute F, employment D-.
- Evansville Vanderburgh School Corporation (urban): math 36% / reading 43% proficiency, ranked #153 of 301 in IN (top 51%) — families likely to look elsewhere, expect single-tenant / working-renter base with shorter leases.
- Zoned schools: Stockwell Elementary School (math 42% / reading 42%, grade F, #434 of 994 statewide, top 48%, 522 students, 68% FRL); Plaza Park International Prep Acad (math 27% / reading 37%, grade F, #190 of 330 statewide, top 59%, 650 students, 65% FRL); William Henry Harrison High School (math 29% / reading 54%, grade F, #211 of 369 statewide, top 58%, 1,158 students, 61% FRL).
- Market conditions: 181 active listings in the ZIP; 2 comparable units currently listed for rent nearby; 508 units permitted in Vanderburgh County in 2024 (32 in 5+ unit buildings).
- This rent runs 34% of the median local income ($61k/yr) — at the standard rent-burdened threshold; future hikes will face affordability resistance.
Forward outlook
- Local home prices are declining (-3.0%/yr); year-one equity from $1k of loan paydown is wiped out by about $5k of value loss. Plan a longer hold.
Negotiation context
- Only 6 days on market — expect competitive offers; lowballing is unlikely to land.
Risks & watch-outs
- Watch-outs: flood insurance adds $427/mo.
- Climate carrying-cost: in FEMA flood zone AE (mandatory federal flood insurance); extreme-heat days projected 7→19/yr by 2055 (HVAC capex compounding) — expect insurance premiums to compound above CPI over the hold.
Questions for the listing agent
- What do current leases actually rent for vs. the listed asking? Can we see a recent rent roll and the last 12 months of T-12 income?
- What's the actual annual flood-insurance premium (NFIP or private), and is the property in a SFHA with mandatory coverage?
- Is there a deadline driving the sale (1031 exchange, divorce, estate, relocation)? That informs how much negotiation room exists.
- Schools are D-rated, which usually means shorter tenancies and higher turnover. Who's the typical renter profile here, and what's been the actual vacancy rate?
- Crime grade is F in this area — have there been break-ins, vandalism, or insurance claims at this property in the last 3 years? What carrier currently insures it and at what premium?
- What's the average days-on-market for RENTAL listings here right now (not sales)? A rising rental-DOM trend means longer vacancies and softer asking-rent achievability than the comps imply.
- What's the recent tenant-quality profile in this submarket — average credit score on applications, eviction rate, late-payment / NSF rate, and stable-employment percentage? A property-management company in the area should have these aggregated.
- How much new for-sale + rental construction is in the pipeline within 1–3 miles? Heavy new supply typically softens prices + rents 12–24 months out; constrained supply supports both.
Investment metrics
- 1% rule
- 1.02% ✓
- Cap rate
- 8.23%
- Cash-on-cash
- 6.92%
- DSCR
- 1.31
- GRM
- 8.2
CMA / ARV
- ARV (on-the-fly)
- $159,300
- Comps found
- 3
Show comp detail 3 sales within ~0.75 mi
| Address | Dist | Beds/Ba | Sqft | Sold | Price | $/sf | Match |
|---|---|---|---|---|---|---|---|
| 2831 Squire Ln | 0.03mi | 3/2.0 | 988 (+10%) | 3mo | $175,000 | $177 | 76 |
| 2840 Squire Ln | 0.01mi | 2/1.0 (-1) | 1,008 (+12%) | 2mo | $193,000 | $191 | 72 |
| 2920 Fox Hollow Ct | 0.16mi | 3/1.5 | 988 (+10%) | 23mo | $163,500 | $165 | 55 |
Match score weights: distance 35% · size 25% · config 20% · recency 20%. Top-matched comps best support the ARV.
Projected returns pro-forma
-3.0% appreciation · 3.0% rent growth · sell at horizon
- IRR
- -22.8%
- Equity multiple
- 0.21×
- Total profit
- $-36,840
- Equity at exit
- $24,975
- IRR
- -16.7%
- Equity multiple
- 0.06×
- Total profit
- $-43,896
- Equity at exit
- $14,482
Cash invested: $46,900 (down + closing). Projections, not guarantees.
Landlord ↔ Tenant lean methodology
- Overall (STATE)
- 90 Strongly Landlord-Friendly
- State Indiana
- 90 Strongly Landlord-Friendly · R+11
- County
- — inherits STATE
- City
- — inherits STATE
ZIP-level market 47715
- Active inventory
- 181
- Price-to-rent
- 8.2×
Monthly cashflow live
- Estimated rent
- $1,712 medium interval (Pro) →
- Mortgage (P&I)
- −$878
- Tax from tax record
- −$134 /mo · $1,608/yr
- Insurance
- −$70
- Flood insurance flood zone
- −$427 /mo · $5,118/yr
- HOA
- −$0
- Vacancy / Maint / Mgmt
- −$360
- Net cashflow
- $-156
Break-even live
Sensitivity live
| Price | -10% $-61 | -5% $-109 | +0% $-156 | +5% $-203 | +10% $-251 |
|---|---|---|---|---|---|
| Rent | -10% $-291 | -5% $-224 | +0% $-156 | +5% $-88 | +10% $-21 |
| Rate | -1.0pp $-72 | -0.5pp $-113 | base $-156 | +0.5pp $-199 | +1.0pp $-244 |
UW: 25.0% down · 7.5% · 30yr · 1.5% tax · 5.0% vac · 8.0% maint · 8.0% mgmt
Financing live
Cash to close
- Down payment
- $41,875
- Closing costs
- $5,025
- Reserves months
- —
- Total cash needed
- —
Loan-product check · same deal, 3 products live
Conventional
25% down · 7.5% · 30yr
- Down + closing
- —
- Monthly P&I
- —
- Monthly cashflow
- —
- DSCR
- —
- Eligible?
- —
Personal DTI + credit; lowest rate.
DSCR
20% down · 8.5% · 30yr
- Down + closing
- —
- Monthly P&I
- —
- Monthly cashflow
- —
- DSCR
- —
- Eligible?
- —
No personal income docs; deal must DSCR.
Hard money
10% down · 12.0% · 12mo
- Down + closing
- —
- Monthly P&I
- —
- Monthly cashflow
- —
- DSCR
- —
- Eligible?
- —
Short-term bridge; refi at stabilization.
Rent comps 2 comps
| Address | Beds | Baths | Sqft | Rent | $/sqft | DOM | Units | Dist |
|---|---|---|---|---|---|---|---|---|
| 6649 Old Boonville Hwy Evansville, IN | 2.0–3.0 | 2.0 | 1153 | $1,499 | $1.30 | 15d | 10 | 0.44mi |
| 1330 Meeting St Evansville, IN | 1.0–2.0 | 1.0–2.0 | 1003 | $1,979 | $1.97 | 15d | 9 | 1.09mi |
Listing history 5 events
-
2026-06-22days on market $167,500 Active 6 DOM
-
2026-06-18days on market $167,500 Active 3 DOM
-
2026-06-17days on market $167,500 Active 2 DOM
-
2026-06-16remarks 699-char remark
-
2026-06-16$167,500 Active 1 DOM
ⓘ Source: listings_history table (triggers on properties + properties_extension) + one-shot
backfill from property_details.listing_events for pre-trigger history.
Tax reassessment forecast IN · Partial reset (capped growth)
- Current annual tax
- $1,608 · $134/mo
- Projected year-2 tax
- $1,608 · $134/mo
- Expected delta
- $0/yr ($0/mo · 0.0%)
ⓘ Screening estimate from a state-policy table — verify with the county assessor before closing.
Climate risk First Street
- Flood 1/10 Low FEMA zone AE · 0% chance over 30 yrs
- Wildfire 1/10 Low
- Heat 5/10 Major 7 d/yr ≥106°F today · 19 d/yr by 30 yrs out
- Wind 3/10 Moderate 5% chance of damaging wind over 30 yrs
- Air quality 3/10 Moderate 3 unhealthy d/yr today · 4 by 30 yrs out
Nearby sold comps map
Loading sold comps map…
Walkable amenities ~0.75 mi
Loading nearby amenities…
Taxation est. · year 1
- Rental income
- $20,547
- − Mortgage interest
- −$9,383
- − Property taxes
- −$1,608
- − Insurance
- −$5,956
- − Repairs & maintenance
- −$1,644
- − Management
- −$1,644
- − Depreciation
- −$4,873
- Taxable loss
- −$4,560
- Est. tax savings @ 24.0%
- +$1,094
- After-tax cash flow
- $-778/yr
For passive investors: Depreciation is non-cash, so a rental often shows a tax loss while cash-flowing — sheltering income. Rental losses are passive: they offset passive income freely, and up to $25,000/yr can offset ordinary (W-2) income if you actively participate and your MAGI is under $100k (phasing out to $0 by $150k); unused losses carry forward. On sale, claimed depreciation is recaptured at up to 25%, and gains may owe capital-gains tax (a 1031 exchange can defer both). Figures are a year-1 estimate at your 24.0% rate — not tax advice; consult a CPA.
Schools (NCES district)
- District
- Evansville Vanderburgh School Corporation
- NCES district ID
- 1803450
- Math proficiency
- 36% ▼ -7.00%
- Reading proficiency
- 43% ▼ -3.00%
- Median HH income
- $43,270
- Composite
- 33.41/100
- National rank
- #5471
- State rank
- #153 of 301 in IN
Livability — Evansville
- Score
- 63/100
- State rank
- #416
- US rank
- #15047
Category grades
Schools grade is shown separately in the Schools card above.
Census & demographics
- Census place
- Evansville, IN
- County
- Vanderburgh County · 146,793 people
- City population
- 146,793
- Metro
- Evansville, IN-KY
- Population (ZIP)
- 29,280
- Household income
- $60,897
- Rent vs Own
- Severe rent burden
- 1652.0
Population outlook (Vanderburgh County) Hauer SSP2
- Today (2025)
- 187,038 people
- By 2030
- 188,907 · +1.0%
- By 2040
- 190,272 · +1.7%
- By 2050
- 188,871 · +1.0%
- By 2075
- 180,751 · -3.4%
- By 2100
- 163,015 · -12.8%
Race, ethnicity, and origin ACS 2023
- Neighborhood character
- Predominantly White (74%)
- Race & ethnicity
- White 74% Black 13% Hispanic / Latino 6% Two or more races 4% Asian 2% Native American 1%
- Hispanic origin (detail)
- Mexican 5%
- Common ancestry
- Slovak 3% Romanian 2% Italian 2%
- Foreign-born
- 6% · Canada, China
- Languages at home
- 93% English-only · Spanish 4% Chinese 1%
Political lean MEDSL · Vanderburgh
- 2024 margin
- R (+12.7) · D 43.0% · R 55.6% · Other 1.4%
- 2008→2024 swing
- -15.1pp toward R · 2008: 2.5pp · 2024: -12.7pp
- All cycles
- 2024: R+12.7 2020: R+9.6 2016: R+16.9 2012: R+10.8 2008: D+2.5
Not yet ingested
- Civics
- —
Market trends
- HPI YoY
- ▼ -113.01%
- Current HPI
- 195.7299
- Rent YoY
- —
- Metro
- Evansville, IN-KY
- State GDP YoY
- ▲ 2.90%
- F500 in state
- 18
Industry mix (Fortune 500 HQ in IN)
| Industry | F500 HQs | Revenue |
|---|---|---|
| Industrial Machinery | 2 | $37B |
|
||
| Healthcare | 1 | $177B |
|
||
| Pharmaceuticals | 1 | $45B |
|
||
| Metals / Steel | 1 | $18B |
|
||
| Agriculture | 1 | $17B |
|
||
| Packaging | 1 | $12B |
|
||
Price history
1 event — show timeline
- 2026-06-15 Listed $167,500 IRMLS
Property tax history
+4.8%/yrLatest (2024): $1,608 · -0.6% YoY. Source: county tax records.
Cash-flow waterfall
monthlySold comps — $/sqft
last 12 mo · ≤1 miLoading sold comps…