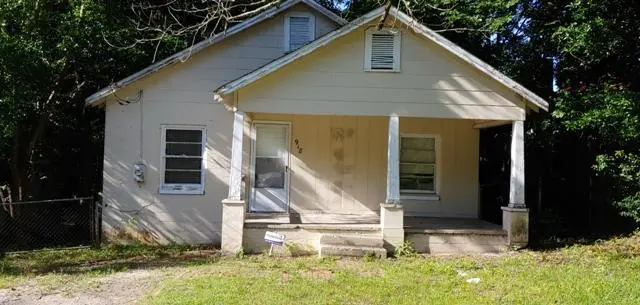
918 Dozier St · Columbus, GA
Flood risk 1/10 · Minimal
- FEMA flood zone
- X (unshaded)
- Chance of flooding over 30 yrs
- 0.0%
- Est. flood insurance / yr
- $507 – $1,088
Fire risk 1/10 · Minimal
- Est. fire insurance / yr
- $963 – $1,789
Heat risk 7/10 · Major
- Hot days now (above 107°F)
- 7 days/yr
- Hot days in 30 yrs
- 19 days/yr
Wind risk 6/10 · Moderate
- Chance of severe wind over 30 yrs
- 69.0%
Air-quality risk 5/10 · Moderate
- Unhealthy air days now
- 7 days/yr
- Unhealthy air days in 30 yrs
- 8 days/yr
Risk factors via First Street. Map © Google.
Why this score? — see what drove the C grade
The composite is a weighted blend of 9 inputs, each scored 0–100. Each bar is that input's sub-score; the figure is the points it added to the 100-point composite (weight × sub-score).
- Cash flow +30.0/30.0
- DSCR +10.0/10.0
- 1% rule +8.3/10.0
- Rent growth +3.3/5.0
- Livability +3.2/5.0
- Condition / age +2.5/5.0
- Schools +2.2/10.0
- ARV discount +0.0/15.0
- Appreciation +0.0/10.0
$75,000
🖨 Deal sheet 📄 Offer letter ✓ Due diligence
Listing remarks MLS
This property is part of a package sale that includes four properties and must be sold with all properties together. This unit is a 2BR, 1BA home that has a stable tenant since July 2020
Key facts
- Listed 224 days
Neighborhood map
What this means for you Summary
Snapshot
- This is a 2-bed/1.0-bath single-family listed at $75k.
Deal economics
- At list price, monthly cash flow is $302 ($4k/yr) — positive.
- The deal already cash-flows at list — no discount required.
- Meets the 1% rule at list price ($998 rent vs $75k).
- Recommended offer: $66k (12.0% below list) — sets the bar for market timing.
- Cap rate 11.1% vs local median 4.7% in Columbus — top-decile yield for the area; either an underpriced asset or a hidden risk that comps aren't pricing in. Stress-test before assuming the spread holds.
Location & tenants
- Location reads 64/100 on livability (#254 in GA) — a middle-class / working-renter tenant base. Strengths: cost of living A+, housing A+, health & safety B; Watch: amenities D+, schools F, crime F.
- Muscogee County (urban): math 21% / reading 30% proficiency, ranked #120 of 174 in GA (top 69%) — low school quality limits family demand, transient renter base, plan for 1-2y turnover; 61% free/reduced lunch — lower-income household profile, screen leases tightly.
- Market conditions: Rents rising (+3.0%/yr); 327 active listings in the ZIP; 24 comparable units currently listed for rent nearby; rentals lingering (median 44d on market — plan ~5-8 weeks vacancy on turnover, expect pricing pressure); 54% of comp listings sitting > 30 days — soft ceiling on asking rent; 291 units permitted in Muscogee County in 2024 (30 in 5+ unit buildings).
Forward outlook
- Local home prices are declining (-3.0%/yr); year-one equity from $519 of loan paydown is wiped out by about $2k of value loss. Plan a longer hold.
- Muscogee County population projected at +15% by 2050 — modest demand growth; plan on rents tracking national, not racing it.
- At projected returns (-3.0% appreciation + 3.0% rent growth), your $21k cash investment doubles in ~7 years — after that, you're playing with house money.
Negotiation context
- It's been on market 224 days — a 12% lower offer ($66k) is reasonable based on typical stale-listing flexibility.
Risks & watch-outs
- Watch-outs: built in 1951 — expect roof / HVAC / electrical / plumbing capex.
- Climate carrying-cost: major wind risk, 69% chance of damaging wind over 30y; extreme-heat days projected 7→19/yr by 2055 (HVAC capex compounding) — expect insurance premiums to compound above CPI over the hold.
Questions for the listing agent
- It's been on market 224 days. Have you received any prior offers? Is the seller open to a 12% concession, seller financing, or rate buy-down credit?
- Built in 1951 — when were the roof, HVAC, electrical panel, plumbing, and water heater last replaced?
- Why hasn't it sold? Are there any deal-killer items the seller is aware of (foundation, flood, title, zoning, code violations)?
- Is there a deadline driving the sale (1031 exchange, divorce, estate, relocation)? That informs how much negotiation room exists.
- Schools are F-rated, which usually means shorter tenancies and higher turnover. Who's the typical renter profile here, and what's been the actual vacancy rate?
- Crime grade is F in this area — have there been break-ins, vandalism, or insurance claims at this property in the last 3 years? What carrier currently insures it and at what premium?
- What's the average days-on-market for RENTAL listings here right now (not sales)? A rising rental-DOM trend means longer vacancies and softer asking-rent achievability than the comps imply.
- What's the recent tenant-quality profile in this submarket — average credit score on applications, eviction rate, late-payment / NSF rate, and stable-employment percentage? A property-management company in the area should have these aggregated.
- How much new for-sale + rental construction is in the pipeline within 1–3 miles? Heavy new supply typically softens prices + rents 12–24 months out; constrained supply supports both.
Investment metrics
- 1% rule
- 1.33% ✓
- Cap rate
- 11.12%
- Cash-on-cash
- 17.23%
- DSCR
- 1.77
- GRM
- 6.3
CMA / ARV
- ARV (median comp)
- $51,115
- List price
- $75,000
- Delta
- 46.73%
- Verdict
- OVERPRICED
- Comps
- 20 within 1.0 mi
Show comp detail 12 sales within ~0.75 mi
| Address | Dist | Beds/Ba | Sqft | Sold | Price | $/sf | Match |
|---|---|---|---|---|---|---|---|
| 3825 Oates Ave | 0.26mi | 2/1.0 | 864 (-4%) | 0mo | $33,500 | $39 | 82 |
| 3978 Young Ave | 0.23mi | 2/1.0 | 864 (-4%) | 3mo | $33,500 | $39 | 81 |
| 1021 Neill Dr | 0.13mi | 2/1.0 | 840 (-6%) | 4mo | $58,618 | $70 | 80 |
| 4125 Beallwood Ave | 0.42mi | 2/1.0 | 862 (-4%) | 3mo | $39,000 | $45 | 72 |
| 727 Apex Rd | 0.19mi | 2/1.0 | 791 (-12%) | 9mo | $42,800 | $54 | 64 |
| 402 Wilton St | 0.43mi | 2/1.0 | 917 (+2%) | 16mo | $52,089 | $57 | 63 |
| 212 47th St | 0.72mi | 3/1.0 (+1) | 864 (-4%) | 3mo | $60,000 | $69 | 53 |
| 3018 4th Ave | 0.75mi | 2/1.0 | 962 (+7%) | 2mo | $22,500 | $23 | 52 |
| 4146 16th Ave | 0.71mi | 2/1.0 | 938 (+5%) | 10mo | $73,000 | $78 | 50 |
| 3723 Howard Ave | 0.50mi | 2/1.0 | 990 (+10%) | 13mo | $108,000 | $109 | 48 |
| 3818 Howard Ave | 0.52mi | 2/1.0 | 1,022 (+14%) | 8mo | $118,000 | $115 | 45 |
| 322 48th St | 0.71mi | 3/1.0 (+1) | 999 (+12%) | 7mo | $115,000 | $115 | 37 |
Match score weights: distance 35% · size 25% · config 20% · recency 20%. Top-matched comps best support the ARV.
Projected returns pro-forma
-3.0% appreciation · 3.04% rent growth · sell at horizon
- IRR
- 8.6%
- Equity multiple
- 1.34×
- Total profit
- $7,086
- Equity at exit
- $11,183
- IRR
- 17.8%
- Equity multiple
- 2.48×
- Total profit
- $31,045
- Equity at exit
- $6,485
Cash invested: $21,000 (down + closing). Projections, not guarantees.
Landlord ↔ Tenant lean methodology
- Overall (STATE)
- 90 Strongly Landlord-Friendly
- State Georgia
- 90 Strongly Landlord-Friendly · R+3
- County
- — inherits STATE
- City
- — inherits STATE
ZIP-level market 31904
- Rents YoY
- 3.0%
- Active inventory
- 327
- Price-to-rent
- 6.3×
Monthly cashflow live
- Estimated rent
- $998 high interval (Pro) →
- Mortgage (P&I)
- −$393
- Tax from tax record
- −$62 /mo · $746/yr
- Insurance
- −$31
- HOA
- −$0
- Vacancy / Maint / Mgmt
- −$210
- Net cashflow
- $302
Break-even live
UW: 25.0% down · 7.5% · 30yr · 1.5% tax · 5.0% vac · 8.0% maint · 8.0% mgmt
Financing live
Cash to close
- Down payment
- $18,750
- Closing costs
- $2,250
- Reserves months
- —
- Total cash needed
- —
Loan-product check · same deal, 3 products live
Conventional
25% down · 7.5% · 30yr
- Down + closing
- —
- Monthly P&I
- —
- Monthly cashflow
- —
- DSCR
- —
- Eligible?
- —
Personal DTI + credit; lowest rate.
DSCR
20% down · 8.5% · 30yr
- Down + closing
- —
- Monthly P&I
- —
- Monthly cashflow
- —
- DSCR
- —
- Eligible?
- —
No personal income docs; deal must DSCR.
Hard money
10% down · 12.0% · 12mo
- Down + closing
- —
- Monthly P&I
- —
- Monthly cashflow
- —
- DSCR
- —
- Eligible?
- —
Short-term bridge; refi at stabilization.
Rent comps 24 comps
| Address | Beds | Baths | Sqft | Rent | $/sqft | DOM | Units | Dist |
|---|---|---|---|---|---|---|---|---|
| 635 42nd St Columbus, GA | 2.0 | 1.0 | 1008 | $750 | $0.74 | 21d | 1 | 0.23mi |
| 4226 Oates Ave Columbus, GA | 3.0 | 1.5 | 960 | $1,100 | $1.15 | 21d | 1 | 0.29mi |
| 1051 43rd St Apt D Columbus, GA | 1.0 | 1.0 | 600 | $750 | $1.25 | 43d | 1 | 0.34mi |
| 617 32nd St Columbus, GA | 2.0 | 1.0 | 600 | $650 | $1.08 | 13d | 1 | 0.52mi |
| 4001 3rd Ave Unit A or B Columbus, GA | 1.0 | 1.0 | 800 | $750 | $0.94 | 13d | 1 | 0.53mi |
| 615 32nd St Columbus, GA | 3.0 | 1.0 | 984 | $900 | $0.91 | 13d | 1 | 0.53mi |
| 608 32nd St Columbus, GA | 1.0 | 1.0 | 644 | $650 | $1.01 | 13d | 1 | 0.56mi |
| 521 46th St Columbus, GA | 2.0 | 1.0 | 954 | $975 | $1.02 | 43d | 1 | 0.57mi |
| 3414 3rd Ave Columbus, GA | 1.0 | 1.0 | 810 | $850 | $1.05 | 21d | 1 | 0.61mi |
| 1121 47th St Columbus, GA | 2.0 | 1.0 | 800 | $950 | $1.19 | 43d | 1 | 0.64mi |
| 3519 Woodlawn Ave Columbus, GA | 3.0 | 1.0 | 1028 | $1,350 | $1.31 | 13d | 1 | 0.66mi |
| 2807 Beacon Ave Unit B Columbus, GA | 2.0 | 2.5 | 1015 | $1,350 | $1.33 | 43d | 1 | 0.78mi |
| 2807 Beacon Ave Unit A Columbus, GA | 2.0 | 2.0 | 1014 | $1,250 | $1.23 | 43d | 1 | 0.78mi |
| 4207 17th Ave Columbus, GA | 3.0 | 1.0 | 1006 | $1,350 | $1.34 | 43d | 1 | 0.80mi |
| 2922 Howard Ave Unit 3 Columbus, GA | 2.0 | 2.0 | 1100 | $795 | $0.72 | 43d | 1 | 0.89mi |
| 3909 Crestview Dr Columbus, GA | 3.0 | 1.0 | 1110 | $1,250 | $1.13 | 13d | 1 | 0.97mi |
| 1410 Talbotton Rd Columbus, GA | 2.0 | 1.0 | 800 | $675 | $0.84 | 43d | 3 | 0.98mi |
| 1510 28th St Columbus, GA | 3.0 | 2.0 | 1050 | $800 | $0.76 | 43d | 1 | 1.04mi |
| 3011 18th Ave Apt F Columbus, GA | 2.0 | 1.0 | 750 | $700 | $0.93 | 43d | 1 | 1.07mi |
| 2703 17th Ave Unit B Columbus, GA | 1.0 | 1.0 | 644 | $700 | $1.09 | 43d | 1 | 1.12mi |
| 2005 Cherokee Dr Columbus, GA | 2.0 | 1.0 | 891 | $925 | $1.04 | 43d | 1 | 1.13mi |
| 1344 24th St Columbus, GA | 2.0 | 1.0 | 750 | $775 | $1.03 | 21d | 1 | 1.16mi |
| 2601 Cherokee Ave Unit 2 Columbus, GA | 1.0 | 1.0 | 750 | $750 | $1.00 | 43d | 1 | 1.32mi |
| 4308 Saint Francis Ave Unit 4310 Columbus, GA | 2.0 | 1.0 | 1000 | $1,125 | $1.12 | 21d | 1 | 1.35mi |
Listing history 19 events
-
2026-06-18days on market $75,000 Active 224 DOM
-
2026-06-17days on market $75,000 Active 223 DOM
-
2026-06-16days on market $75,000 Active 222 DOM
-
2026-06-15days on market $75,000 Active 221 DOM
-
2026-06-14days on market $75,000 Active 219 DOM
-
2026-06-13days on market $75,000 Active 218 DOM
-
2026-06-10days on market $75,000 Active 216 DOM
-
2026-06-09days on market $75,000 Active 215 DOM
-
2026-06-08days on market $75,000 Active 214 DOM
-
2026-06-07days on market $75,000 Active 213 DOM
-
2026-06-05days on market $75,000 Active 210 DOM
-
2026-06-03days on market $75,000 Active 209 DOM
-
2026-06-02days on market $75,000 Active 208 DOM
-
2026-06-01days on market $75,000 Active 207 DOM
-
2026-05-31days on market $75,000 Active 206 DOM
-
2026-05-30days on market $75,000 Active 205 DOM
-
2025-11-06$75,000 Active 186-char remark
Show marketing remark (186 chars)
This property is part of a package sale that includes four properties and must be sold with all properties together. This unit is a 2BR, 1BA home that has a stable tenant since July 2020
-
2025-09-10price $59,000
-
2025-08-26price $65,900
ⓘ Source: listings_history table (triggers on properties + properties_extension) + one-shot
backfill from property_details.listing_events for pre-trigger history.
Tax reassessment forecast GA · Resets to sale price
- Current annual tax
- $746 · $62/mo
- Projected year-2 tax
- $746 · $62/mo
- Expected delta
- $0/yr ($0/mo · 0.0%)
ⓘ Screening estimate from a state-policy table — verify with the county assessor before closing.
Climate risk First Street
- Flood 1/10 Low FEMA zone X (unshaded) · 0% chance over 30 yrs
- Wildfire 1/10 Low
- Heat 7/10 Severe 7 d/yr ≥107°F today · 19 d/yr by 30 yrs out
- Wind 6/10 Major 69% chance of damaging wind over 30 yrs
- Air quality 5/10 Major 7 unhealthy d/yr today · 8 by 30 yrs out
Nearby sold comps map
Loading sold comps map…
Walkable amenities ~0.75 mi
Loading nearby amenities…
Taxation est. · year 1
- Rental income
- $11,973
- − Mortgage interest
- −$4,201
- − Property taxes
- −$746
- − Insurance
- −$375
- − Repairs & maintenance
- −$958
- − Management
- −$958
- − Depreciation
- −$2,182
- Taxable income
- $2,554
- Est. tax owed @ 24.0%
- −$613
- After-tax cash flow
- $3,005/yr
For passive investors: Depreciation is non-cash, so a rental often shows a tax loss while cash-flowing — sheltering income. Rental losses are passive: they offset passive income freely, and up to $25,000/yr can offset ordinary (W-2) income if you actively participate and your MAGI is under $100k (phasing out to $0 by $150k); unused losses carry forward. On sale, claimed depreciation is recaptured at up to 25%, and gains may owe capital-gains tax (a 1031 exchange can defer both). Figures are a year-1 estimate at your 24.0% rate — not tax advice; consult a CPA.
Schools (NCES district)
- District
- Muscogee County
- NCES district ID
- 1303870
- Math proficiency
- 21% ▼ -11.00%
- Reading proficiency
- 30% ▼ -7.00%
- Median HH income
- $41,176
- Composite
- 21.6/100
- National rank
- #8297
- State rank
- #120 of 174 in GA
Livability — Columbus
- Score
- 64/100
- State rank
- #254
- US rank
- #14102
Category grades
Schools grade is shown separately in the Schools card above.
Census & demographics
- Census place
- Columbus, GA
- County
- Muscogee County · 180,764 people
- City population
- 180,764
- Metro
- Columbus, GA-AL
- Population (ZIP)
- 35,405
- Household income
- $66,291
- Rent vs Own
- Severe rent burden
- 2030.0
Population outlook (Muscogee County) Hauer SSP2
- Today (2025)
- 216,729 people
- By 2030
- 224,504 · +3.6%
- By 2040
- 238,318 · +10.0%
- By 2050
- 249,027 · +14.9%
- By 2075
- 264,862 · +22.2%
- By 2100
- 254,786 · +17.6%
Race, ethnicity, and origin ACS 2023
- Neighborhood character
- Diverse neighborhood (Simpson 0.60)
- Race & ethnicity
- White 56% Black 28% Two or more races 8% Hispanic / Latino 7% Asian 2%
- Hispanic origin (detail)
- Mexican 3% Puerto Rican 1%
- Common ancestry
- Slovak 1% Italian 1% Romanian 1%
- Foreign-born
- 5% · Canada, South Korea
- Languages at home
- 93% English-only · Spanish 4% Korean 1% German/W. Germanic 1%
Political lean MEDSL · Muscogee
- 2024 margin
- Strong D (+23.4) · D 61.4% · R 38.0%
- 2008→2024 swing
- +3.7pp toward D · 2008: 19.7pp · 2024: 23.4pp
- All cycles
- 2024: D+23.4 2020: D+24.0 2016: D+18.6 2012: D+21.3 2008: D+19.7
Not yet ingested
- Civics
- —
Market trends
- HPI YoY
- ▼ -152.06%
- Current HPI
- 155.1405
- Rent YoY
- ▲ 3.04%
- Metro
- Columbus, GA-AL
- State GDP YoY
- ▲ 2.66%
- F500 in state
- 28
Industry mix (Fortune 500 HQ in GA)
| Industry | F500 HQs | Revenue |
|---|---|---|
| Paper / Packaging | 2 | $29B |
|
||
| Retail | 1 | $160B |
|
||
| Transportation / Logistics | 1 | $91B |
|
||
| Airlines | 1 | $62B |
|
||
| Consumer Goods | 1 | $47B |
|
||
| Utilities | 1 | $25B |
|
||
Price history
+13.8% since first listed3 events — show timeline
- 2025-11-06 Listed $75,000 CBOR
- 2025-09-10 Price Changed $59,000 CBOR
- 2025-08-26 Price Changed $65,900 CBOR
Property tax history
+4.8%/yrLatest (2025): $746 · +0.0% YoY. Source: county tax records.
Cash-flow waterfall
monthlySold comps — $/sqft
last 12 mo · ≤1 miLoading sold comps…