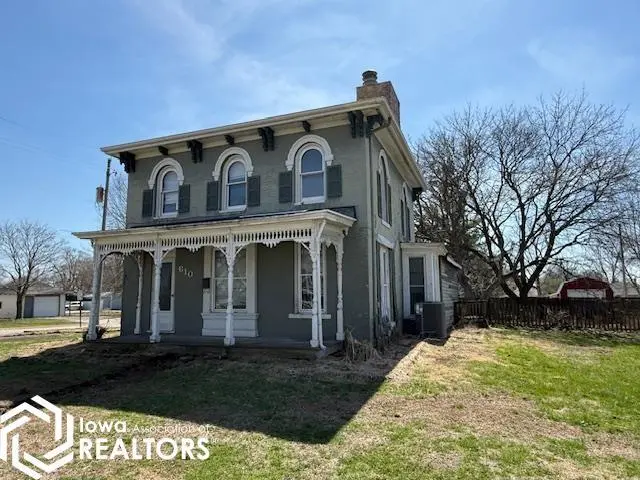
610 E Henry St · Mount Pleasant, IA
Flood risk 1/10 · Minimal
- FEMA flood zone
- X (unshaded)
- Chance of flooding over 30 yrs
- 0.0%
- Est. flood insurance / yr
- $473 – $860
Fire risk 2/10 · Minimal
- Est. fire insurance / yr
- $902 – $1,676
Heat risk 3/10 · Minor
- Hot days now (above 106°F)
- 7 days/yr
- Hot days in 30 yrs
- 15 days/yr
Wind risk 2/10 · Minimal
- Chance of severe wind over 30 yrs
- —
Air-quality risk 2/10 · Minimal
- Unhealthy air days now
- 1 days/yr
- Unhealthy air days in 30 yrs
- 2 days/yr
Risk factors via First Street. Map © Google.
Why this score? — see what drove the B grade
The composite is a weighted blend of 9 inputs, each scored 0–100. Each bar is that input's sub-score; the figure is the points it added to the 100-point composite (weight × sub-score).
- Cash flow +30.0/30.0
- 1% rule +10.0/10.0
- DSCR +10.0/10.0
- ARV discount +7.5/15.0
- Schools +5.4/10.0
- Livability +4.2/5.0
- Rent growth +2.5/5.0
- Condition / age +2.5/5.0
- Appreciation +0.0/10.0
$30,000
🖨 Deal sheet 📄 Offer letter ✓ Due diligence
Listing remarks MLS
Lots of square footage in this 3 bedroom, 2 bath home with detached garage. Needs some love and TLC but could be a great home for someone that is handy!
Key facts
- 6,098 sq ft lot
- Garage
- Built 1871
Neighborhood map
What this means for you Summary
Snapshot
- This is a 3-bed/1.5-bath single-family listed at $30k.
Deal economics
- At list price, monthly cash flow is $672 ($8k/yr) — positive.
- The deal already cash-flows at list — no discount required.
- Meets the 1% rule at list price ($1k rent vs $30k).
- Recommended offer: $29k (3.0% below list) — sets the bar for market timing.
- Cap rate 33.2% vs local median 3.3% in Mount Pleasant — top-decile yield for the area; either an underpriced asset or a hidden risk that comps aren't pricing in. Stress-test before assuming the spread holds.
Location & tenants
- Location reads 84/100 on livability (#20 in IA, #662 nationally) — a professional / high-income tenant draw. Strengths: crime A+, cost of living A+, housing A+; Watch: commute F.
- Mount Pleasant Community School District (town): math 63% / reading 66% proficiency, ranked #207 of 289 in IA (top 72%) — acceptable for families but not a draw, mixed tenant base, ~2y average lease.
- Market conditions: 93 active listings in the ZIP; 30 units permitted in Henry County in 2024 (8 in 5+ unit buildings).
Forward outlook
- Local home prices are declining (-3.0%/yr); year-one equity from $207 of loan paydown is wiped out by about $900 of value loss. Plan a longer hold.
- Henry County population projected to shrink 9% by 2050 — rents likely to lag national; underwrite the cash flow, not the appreciation.
- At projected returns (-3.0% appreciation + 3.0% rent growth), your $8k cash investment doubles in ~2 years — after that, you're playing with house money.
Negotiation context
- It's been on market 57 days — a 3% lower offer ($29k) is reasonable based on typical stale-listing flexibility.
- 2 sale attempts since 10y ago; this cycle's ask has dropped $22k (43%) from the opening price — seller is motivated, your offer sets the floor, not the list.
Risks & watch-outs
- Watch-outs: built in 1871 — expect roof / HVAC / electrical / plumbing capex.
Questions for the listing agent
- It's been on market 57 days. Have you received any prior offers? Is the seller open to a 3% concession, seller financing, or rate buy-down credit?
- Built in 1871 — when were the roof, HVAC, electrical panel, plumbing, and water heater last replaced?
- Is there a deadline driving the sale (1031 exchange, divorce, estate, relocation)? That informs how much negotiation room exists.
- Schools are B-rated — typically a magnet for longer-tenancy family renters. What's the average tenant stay here, and is there a school-zone premium baked into asking?
- What's the average days-on-market for RENTAL listings here right now (not sales)? A rising rental-DOM trend means longer vacancies and softer asking-rent achievability than the comps imply.
- What's the recent tenant-quality profile in this submarket — average credit score on applications, eviction rate, late-payment / NSF rate, and stable-employment percentage? A property-management company in the area should have these aggregated.
- How much new for-sale + rental construction is in the pipeline within 1–3 miles? Heavy new supply typically softens prices + rents 12–24 months out; constrained supply supports both.
Investment metrics
- 1% rule
- 3.71% ✓
- Cap rate
- 33.17%
- Cash-on-cash
- 95.97%
- DSCR
- 5.27
- GRM
- 2.2
CMA / ARV
- ARV (median comp)
- $180,579
- List price
- $30,000
- Delta
- -83.39%
- Verdict
- UNDERPRICED
- Comps
- 20 within 1.0 mi
Show comp detail 12 sales within ~0.75 mi
| Address | Dist | Beds/Ba | Sqft | Sold | Price | $/sf | Match |
|---|---|---|---|---|---|---|---|
| 610 E Henry St | 0.00mi | 3/1.5 | 1,843 (0%) | 0mo | $22,500 | $12 | 100 |
| 103 E Henry St | 0.41mi | 3/1.5 | 1,792 (-3%) | 3mo | $130,000 | $73 | 74 |
| 308 E Washington St | 0.32mi | 4/1.5 (+1) | 1,760 (-4%) | 5mo | $136,000 | $77 | 69 |
| 803 E Washington St. St | 0.23mi | 3/2.0 | 1,706 (-7%) | 10mo | $187,500 | $110 | 67 |
| 603 E Green St | 0.41mi | 3/2.0 | 1,904 (+3%) | 9mo | $260,000 | $137 | 66 |
| 305 S Locust St. St | 0.40mi | 3/1.0 | 1,640 (-11%) | 1mo | $147,450 | $90 | 60 |
| 415 N Adams St | 0.42mi | 3/1.5 | 1,680 (-9%) | 7mo | $120,223 | $72 | 60 |
| 505 S Pine St | 0.49mi | 3/2.0 | 1,957 (+6%) | 8mo | $189,900 | $97 | 58 |
| 605 E Clay St. St | 0.27mi | 2/2.0 (-1) | 2,072 (+12%) | 6mo | $179,000 | $86 | 55 |
| 612 N Lincoln St | 0.47mi | 3/2.0 | 2,104 (+14%) | 6mo | $186,000 | $88 | 47 |
| 204 W Henry St | 0.56mi | 3/2.0 | 1,584 (-14%) | 1mo | $111,000 | $70 | 47 |
| 806 N Main St. St | 0.74mi | 2/2.0 (-1) | 2,056 (+12%) | 7mo | $195,000 | $95 | 33 |
Match score weights: distance 35% · size 25% · config 20% · recency 20%. Top-matched comps best support the ARV.
Projected returns pro-forma
-3.0% appreciation · 3.0% rent growth · sell at horizon
- IRR
- 96.9%
- Equity multiple
- 5.52×
- Total profit
- $37,944
- Equity at exit
- $4,473
- IRR
- 99.6%
- Equity multiple
- 11.50×
- Total profit
- $88,206
- Equity at exit
- $2,594
Cash invested: $8,400 (down + closing). Projections, not guarantees.
Landlord ↔ Tenant lean methodology
- Overall (STATE)
- 83 Strongly Landlord-Friendly
- State Iowa
- 83 Strongly Landlord-Friendly · R+6
- County
- — inherits STATE
- City
- — inherits STATE
ZIP-level market 52641
- Home prices YoY
- -25.2%
- Active inventory
- 93
- Price-to-rent
- 2.2×
Monthly cashflow live
- Estimated rent
- $1,113 medium interval (Pro) →
- Mortgage (P&I)
- −$157
- Tax est. 1.5%
- −$38 /mo · $450/yr
- Insurance
- −$12
- HOA
- −$0
- Vacancy / Maint / Mgmt
- −$234
- Net cashflow
- $672
Break-even live
UW: 25.0% down · 7.5% · 30yr · 1.5% tax · 5.0% vac · 8.0% maint · 8.0% mgmt
Financing live
Cash to close
- Down payment
- $7,500
- Closing costs
- $900
- Reserves months
- —
- Total cash needed
- —
Loan-product check · same deal, 3 products live
Conventional
25% down · 7.5% · 30yr
- Down + closing
- —
- Monthly P&I
- —
- Monthly cashflow
- —
- DSCR
- —
- Eligible?
- —
Personal DTI + credit; lowest rate.
DSCR
20% down · 8.5% · 30yr
- Down + closing
- —
- Monthly P&I
- —
- Monthly cashflow
- —
- DSCR
- —
- Eligible?
- —
No personal income docs; deal must DSCR.
Hard money
10% down · 12.0% · 12mo
- Down + closing
- —
- Monthly P&I
- —
- Monthly cashflow
- —
- DSCR
- —
- Eligible?
- —
Short-term bridge; refi at stabilization.
Listing history 6 events
-
2026-05-08price $30,000 152-char remark
Show marketing remark (152 chars)
Lots of square footage in this 3 bedroom, 2 bath home with detached garage. Needs some love and TLC but could be a great home for someone that is handy!
-
2026-04-13price $40,000 152-char remark
Show marketing remark (152 chars)
Lots of square footage in this 3 bedroom, 2 bath home with detached garage. Needs some love and TLC but could be a great home for someone that is handy!
-
2026-03-31$52,500 Active 152-char remark
Show marketing remark (152 chars)
Lots of square footage in this 3 bedroom, 2 bath home with detached garage. Needs some love and TLC but could be a great home for someone that is handy!
-
2019-12-23soldstatus $78,000
-
2016-12-28soldstatus $77,800
-
2016-04-21$84,500
ⓘ Source: listings_history table (triggers on properties + properties_extension) + one-shot
backfill from property_details.listing_events for pre-trigger history.
Climate risk First Street
- Flood 1/10 Low FEMA zone X (unshaded) · 0% chance over 30 yrs
- Wildfire 2/10 Low
- Heat 3/10 Moderate 7 d/yr ≥106°F today · 15 d/yr by 30 yrs out
- Wind 2/10 Low
- Air quality 2/10 Low 1 unhealthy d/yr today · 2 by 30 yrs out
Nearby sold comps map
Loading sold comps map…
Walkable amenities ~0.75 mi
Loading nearby amenities…
Taxation est. · year 1
- Rental income
- $13,354
- − Mortgage interest
- −$1,680
- − Property taxes
- −$450
- − Insurance
- −$150
- − Repairs & maintenance
- −$1,068
- − Management
- −$1,068
- − Depreciation
- −$873
- Taxable income
- $8,064
- Est. tax owed @ 24.0%
- −$1,935
- After-tax cash flow
- $6,126/yr
For passive investors: Depreciation is non-cash, so a rental often shows a tax loss while cash-flowing — sheltering income. Rental losses are passive: they offset passive income freely, and up to $25,000/yr can offset ordinary (W-2) income if you actively participate and your MAGI is under $100k (phasing out to $0 by $150k); unused losses carry forward. On sale, claimed depreciation is recaptured at up to 25%, and gains may owe capital-gains tax (a 1031 exchange can defer both). Figures are a year-1 estimate at your 24.0% rate — not tax advice; consult a CPA.
Schools (NCES district)
- District
- Mount Pleasant Community School District
- NCES district ID
- 1919890
- Math proficiency
- 63% ▼ -5.00%
- Reading proficiency
- 66% ▬ 0.00%
- Median HH income
- $46,805
- Composite
- 54.49/100
- National rank
- #1348
- State rank
- #207 of 289 in IA
Livability — Mount Pleasant
- Score
- 84/100
- State rank
- #20
- US rank
- #662
Category grades
Schools grade is shown separately in the Schools card above.
Census & demographics
- Census place
- Mount Pleasant, IA
- Population (ZIP)
- 12,796
Population outlook (Henry County) Hauer SSP2
- Today (2025)
- 19,583 people
- By 2030
- 19,271 · -1.6%
- By 2040
- 18,505 · -5.5%
- By 2050
- 17,796 · -9.1%
- By 2075
- 16,821 · -14.1%
- By 2100
- 15,549 · -20.6%
Race, ethnicity, and origin ACS 2023
- Neighborhood character
- Predominantly White (83%)
- Race & ethnicity
- White 83% Hispanic / Latino 7% Two or more races 6% Black 4% Asian 1%
- Hispanic origin (detail)
- Mexican 4% Puerto Rican 1%
- Common ancestry
- Romanian 3% Portuguese 2% Lithuanian 2%
- Foreign-born
- 3% · Canada
- Languages at home
- 93% English-only · Spanish 4% Other Asian/Pacific 1%
Political lean MEDSL · Henry
- 2024 margin
- Solid R (+36.0) · D 31.3% · R 67.3% · Other 1.5%
- 2008→2024 swing
- -30.9pp toward R · 2008: -5.0pp · 2024: -36.0pp
- All cycles
- 2024: R+36.0 2020: R+32.4 2016: R+30.9 2012: R+6.0 2008: R+5.0
Not yet ingested
- Civics
- —
Market trends
- HPI YoY
- ▼ -60.39%
- Current HPI
- 179.2437
- Rent YoY
- —
- Metro
- —
- State GDP YoY
- ▲ 2.48%
- F500 in state
- 4
Industry mix (Fortune 500 HQ in IA)
| Industry | F500 HQs | Revenue |
|---|---|---|
| Financial Services | 1 | $16B |
|
||
| Retail / Convenience | 1 | $15B |
|
||
Price history
-64.5% since first listed6 events — show timeline
- 2026-05-08 Price Changed $30,000 IAR
- 2026-04-13 Price Changed $40,000 IAR
- 2026-03-31 Listed $52,500 IAR
- 2019-12-23 Sold (Public Records) $78,000 Public Records
- 2016-12-28 Sold (Public Records) $77,800 Public Records
- 2016-04-21 Listed $84,500 IAR
Property tax history
+1.5%/yrLatest (2025): $2,070 · +5.7% YoY. Source: county tax records.
Cash-flow waterfall
monthlySold comps — $/sqft
last 12 mo · ≤1 miLoading sold comps…