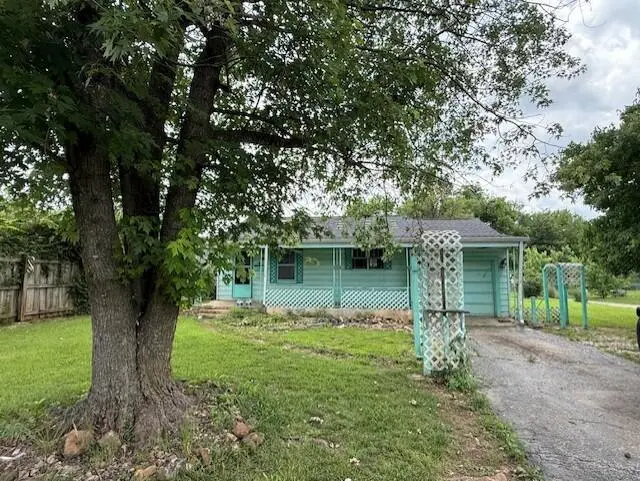
2718 W State St · Springfield, MO
Flood risk 1/10 · Minimal
- FEMA flood zone
- X (unshaded)
- Chance of flooding over 30 yrs
- 0.0%
- Est. flood insurance / yr
- $507 – $1,088
Fire risk 1/10 · Minimal
- Est. fire insurance / yr
- $1,054 – $1,958
Heat risk 5/10 · Moderate
- Hot days now (above 104°F)
- 7 days/yr
- Hot days in 30 yrs
- 20 days/yr
Wind risk 2/10 · Minimal
- Chance of severe wind over 30 yrs
- 0.0%
Air-quality risk 2/10 · Minimal
- Unhealthy air days now
- 1 days/yr
- Unhealthy air days in 30 yrs
- 2 days/yr
Risk factors via First Street. Map © Google.
Why this score? — see what drove the B+ grade
The composite is a weighted blend of 9 inputs, each scored 0–100. Each bar is that input's sub-score; the figure is the points it added to the 100-point composite (weight × sub-score).
- Cash flow +30.0/30.0
- ARV discount +15.0/15.0
- 1% rule +10.0/10.0
- DSCR +10.0/10.0
- Livability +3.8/5.0
- Rent growth +3.7/5.0
- Schools +3.2/10.0
- Condition / age +1.0/5.0
- Appreciation +0.0/10.0
$59,000
🖨 Deal sheet 📄 Offer letter ✓ Due diligence
Key facts
- 0.4 acre lot
- Garage
- Built 1937
Property features AI
Finance
- Financial info: Annual tax amount listed
Exterior
- Parking: Detached or attached garage with 1-car capacity
- Utilities: Public water; Public sewer
- Home design: Single-family residence; One level
- Construction: 780 above-grade finished area
- Exterior features: 0.4-acre lot; Subdivision: Greene-Not in List; Directions: From the intersection of S Scenic Ave and W State Street go west, first residence on the left
Interior
- Bathrooms: One full bathroom
- Heating & cooling: No heating system specified; No cooling system specified
- Interior features: Laundry located on the main level
- Laundry & utility: Main-level laundry
Neighborhood map
What this means for you Summary
Snapshot
- This is a 2-bed/1.0-bath single-family listed at $59k. Condition is rated poor.
Deal economics
- At list price, monthly cash flow is $375 ($5k/yr) — positive.
- The deal already cash-flows at list — no discount required.
- Meets the 1% rule at list price ($991 rent vs $59k).
- Recommended offer: $58k (1.5% below list) — sets the bar for market timing.
- Cap rate 13.9% vs local median 4.6% in Springfield — top-decile yield for the area; either an underpriced asset or a hidden risk that comps aren't pricing in. Stress-test before assuming the spread holds.
Location & tenants
- Location reads 75/100 on livability (#57 in MO, #4,121 nationally) — a middle-class / working-renter tenant base. Strengths: commute A+, cost of living A+, housing A+; Watch: crime F, employment F.
- Springfield R-XII (urban): math 32% / reading 46% proficiency, ranked #174 of 324 in MO (top 54%) — families likely to look elsewhere, expect single-tenant / working-renter base with shorter leases.
- Zoned schools: Westport Elem. (math 8% / reading 17%, grade F, #1,007 of 1,115 statewide, top 91%, 384 students, 88% FRL); Central High (math 42% / reading 62%, grade D+, #92 of 521 statewide, top 20%, 1,464 students, 51% FRL) — zoned schools average 69% FRL vs 46% district-wide (23 pts higher); higher-poverty schools than district average — tighter screening recommended.
- Market conditions: Rents rising fast (+4.8%/yr); 512 active listings in the ZIP; 22 comparable units currently listed for rent nearby; rentals at typical pace (median 24d on market — plan ~3-4 weeks tenant-placement turnaround); 1,302 units permitted in Greene County in 2024 (250 in 5+ unit buildings).
Forward outlook
- Local home prices are declining (-3.0%/yr); year-one equity from $408 of loan paydown is wiped out by about $2k of value loss. Plan a longer hold.
- Greene County population projected at +25% by 2050 — long-run rental-demand tailwind backs the buy-and-hold thesis.
- At projected returns (-3.0% appreciation + 4.8% rent growth), your $17k cash investment doubles in ~5 years — after that, you're playing with house money.
Negotiation context
- It's been on market 15 days — a 2% lower offer ($58k) is reasonable based on typical stale-listing flexibility.
Risks & watch-outs
- Watch-outs: built in 1937 — expect roof / HVAC / electrical / plumbing capex.
- Climate carrying-cost: extreme-heat days projected 7→20/yr by 2055 (HVAC capex compounding) — expect insurance premiums to compound above CPI over the hold.
Questions for the listing agent
- Have any recent inspections been done? Can we get a copy of the seller's disclosures and any deferred-maintenance estimates?
- Built in 1937 — when were the roof, HVAC, electrical panel, plumbing, and water heater last replaced?
- Is there a deadline driving the sale (1031 exchange, divorce, estate, relocation)? That informs how much negotiation room exists.
- Crime grade is F in this area — have there been break-ins, vandalism, or insurance claims at this property in the last 3 years? What carrier currently insures it and at what premium?
- What's the average days-on-market for RENTAL listings here right now (not sales)? A rising rental-DOM trend means longer vacancies and softer asking-rent achievability than the comps imply.
- What's the recent tenant-quality profile in this submarket — average credit score on applications, eviction rate, late-payment / NSF rate, and stable-employment percentage? A property-management company in the area should have these aggregated.
- How much new for-sale + rental construction is in the pipeline within 1–3 miles? Heavy new supply typically softens prices + rents 12–24 months out; constrained supply supports both.
Investment metrics
- 1% rule
- 1.68% ✓
- Cap rate
- 13.92%
- Cash-on-cash
- 27.25%
- DSCR
- 2.21
- GRM
- 5.0
CMA / ARV
- ARV (on-the-fly)
- $106,860
- Comps found
- 12
Show comp detail 12 sales within ~0.75 mi
| Address | Dist | Beds/Ba | Sqft | Sold | Price | $/sf | Match |
|---|---|---|---|---|---|---|---|
| 2606 W State St | 0.15mi | 2/1.0 | 783 (+0%) | 6mo | $40,000 | $51 | 88 |
| 2831 W Elm St | 0.37mi | 2/1.0 | 770 (-1%) | 4mo | $106,000 | $138 | 78 |
| 2611 W Madison St | 0.17mi | 2/1.0 | 840 (+8%) | 9mo | $139,900 | $167 | 72 |
| 2530 W Lincoln St | 0.34mi | 2/1.0 | 750 (-4%) | 12mo | $125,000 | $167 | 68 |
| 2939 W Grand St | 0.43mi | 2/1.0 | 840 (+8%) | 1mo | $115,000 | $137 | 66 |
| 2546 W Walnut St | 0.43mi | 2/1.0 | 824 (+6%) | 9mo | $108,000 | $131 | 63 |
| 2956 W Olive St | 0.61mi | 1/1.0 (-1) | 780 (0%) | 9mo | $159,900 | $205 | 59 |
| 2609 W Lombard St | 0.27mi | 2/1.0 | 874 (+12%) | 10mo | $99,900 | $114 | 59 |
| 2716 W Elm St | 0.31mi | 2/1.0 | 884 (+13%) | 9mo | $134,900 | $153 | 56 |
| 2946 W Elm St | 0.42mi | 2/1.0 | 896 (+15%) | 6mo | $118,000 | $132 | 51 |
| 2322 W Olive St | 0.68mi | 2/1.0 | 868 (+11%) | 3mo | $64,900 | $75 | 47 |
| 3203 W Harrison St | 0.59mi | 3/1.0 (+1) | 884 (+13%) | 12mo | $110,000 | $124 | 36 |
Match score weights: distance 35% · size 25% · config 20% · recency 20%. Top-matched comps best support the ARV.
Projected returns pro-forma
-3.0% appreciation · 4.82% rent growth · sell at horizon
- IRR
- 23.3%
- Equity multiple
- 1.98×
- Total profit
- $16,192
- Equity at exit
- $8,797
- IRR
- 32.4%
- Equity multiple
- 4.20×
- Total profit
- $52,790
- Equity at exit
- $5,101
Cash invested: $16,520 (down + closing). Projections, not guarantees.
Landlord ↔ Tenant lean methodology
- Overall (STATE)
- 81 Strongly Landlord-Friendly
- State Missouri
- 81 Strongly Landlord-Friendly · R+10
- County
- — inherits STATE
- City
- — inherits STATE
ZIP-level market 65802
- Home prices YoY
- -31.9%
- Rents YoY
- 4.8%
- Active inventory
- 512
- Price-to-rent
- 5.0×
Monthly cashflow live
- Estimated rent
- $991 high interval (Pro) →
- Mortgage (P&I)
- −$309
- Tax est. 1.5%
- −$74 /mo · $885/yr
- Insurance
- −$25
- HOA
- −$0
- Vacancy / Maint / Mgmt
- −$208
- Net cashflow
- $375
Break-even live
UW: 25.0% down · 7.5% · 30yr · 1.5% tax · 5.0% vac · 8.0% maint · 8.0% mgmt
Financing live
Cash to close
- Down payment
- $14,750
- Closing costs
- $1,770
- Reserves months
- —
- Total cash needed
- —
Loan-product check · same deal, 3 products live
Conventional
25% down · 7.5% · 30yr
- Down + closing
- —
- Monthly P&I
- —
- Monthly cashflow
- —
- DSCR
- —
- Eligible?
- —
Personal DTI + credit; lowest rate.
DSCR
20% down · 8.5% · 30yr
- Down + closing
- —
- Monthly P&I
- —
- Monthly cashflow
- —
- DSCR
- —
- Eligible?
- —
No personal income docs; deal must DSCR.
Hard money
10% down · 12.0% · 12mo
- Down + closing
- —
- Monthly P&I
- —
- Monthly cashflow
- —
- DSCR
- —
- Eligible?
- —
Short-term bridge; refi at stabilization.
Rent comps 22 comps
| Address | Beds | Baths | Sqft | Rent | $/sqft | DOM | Units | Dist |
|---|---|---|---|---|---|---|---|---|
| 520 S Scenic Ave Unit 101-A Springfield, MO | 1.0 | 1.0 | 550 | $650 | $1.18 | 43d | 1 | 0.30mi |
| 2541 W Lincoln St Springfield, MO | 2.0 | 1.0 | 1034 | $975 | $0.94 | 43d | 1 | 0.37mi |
| 1020 S Clifton Ave Springfield, MO | 2.0 | 2.0 | 1010 | $950 | $0.94 | 23d | 1 | 0.40mi |
| 2854 W Walnut St Springfield, MO | 3.0 | 1.0 | 945 | $995 | $1.05 | 21d | 1 | 0.42mi |
| 1040 S Clifton Ave Springfield, MO | 2.0 | 2.0 | 1010 | $945 | $0.94 | 13d | 1 | 0.45mi |
| 2204 W Madison St Springfield, MO | 3.0 | 1.0 | 960 | $1,095 | $1.14 | 13d | 1 | 0.54mi |
| 3028 W Walnut St Springfield, MO | 2.0 | 1.0 | 975 | $850 | $0.87 | 21d | 1 | 0.54mi |
| 2711 W Olive St Springfield, MO | 1.0 | 1.0 | 621 | $750 | $1.21 | 23d | 1 | 0.57mi |
| 547 S Hilton Ave Springfield, MO | 3.0 | 1.0 | 1008 | $1,175 | $1.17 | 43d | 1 | 0.65mi |
| 1911 W Elm St Springfield, MO | 2.0 | 1.0 | 580 | $875 | $1.51 | 43d | 1 | 0.86mi |
| 522 N Park Ave Springfield, MO | 1.0 | 1.0 | 608 | $950 | $1.56 | 43d | 1 | 1.02mi |
| 1740 W Olive St Springfield, MO | 3.0 | 1.0 | 736 | $1,195 | $1.62 | 13d | 1 | 1.05mi |
| 741 N West Ave Springfield, MO | 2.0 | 1.0 | 912 | $950 | $1.04 | 43d | 1 | 1.07mi |
| 740 N West Ave Springfield, MO | 3.0 | 1.0 | 900 | $995 | $1.11 | 23d | 1 | 1.08mi |
| 922 N Glenn Ave Springfield, MO | 2.0 | 1.0 | 780 | $1,100 | $1.41 | 43d | 1 | 1.16mi |
| 1735 W Bennett St Springfield, MO | 1.0 | 1.0 | 800 | $1,124 | $1.41 | 13d | 2 | 1.18mi |
| 2712 W Nichols St Springfield, MO | 2.0 | 1.0 | 619 | $795 | $1.28 | 43d | 1 | 1.18mi |
| 1625 S Marion Ave Springfield, MO | 1.0–2.0 | 1.0–2.0 | 900 | $1,321 | $1.47 | 13d | 5 | 1.26mi |
| 627 S Fort Ave Springfield, MO | 2.0 | 1.0 | 880 | $895 | $1.02 | 23d | 1 | 1.32mi |
| 1634 S Marion Ave Springfield, MO | 3.0 | 1.0–2.0 | 845 | $1,404 | $1.66 | 13d | 23 | 1.35mi |
| 1200 W Walnut St Springfield, MO | 2.0 | 2.0 | 1000 | $995 | $0.99 | 13d | 3 | 1.43mi |
| 1036 W Monroe Ter Springfield, MO | 2.0 | 1.0 | 812 | $795 | $0.98 | 23d | 1 | 1.49mi |
Listing history 10 events
-
2026-06-18days on market $59,000 Active 15 DOM
-
2026-06-17days on market $59,000 Active 14 DOM
-
2026-06-16days on market $59,000 Active 13 DOM
-
2026-06-15days on market $59,000 Active 12 DOM
-
2026-06-14days on market $59,000 Active 10 DOM
-
2026-06-10days on market $59,000 Active 7 DOM
-
2026-06-09days on market $59,000 Active 6 DOM
-
2026-06-08days on market $59,000 Active 5 DOM
-
2026-06-07days on market $59,000 Active 4 DOM
-
2026-06-03$59,000 Active 1 DOM
ⓘ Source: listings_history table (triggers on properties + properties_extension) + one-shot
backfill from property_details.listing_events for pre-trigger history.
Climate risk First Street
- Flood 1/10 Low FEMA zone X (unshaded) · 0% chance over 30 yrs
- Wildfire 1/10 Low
- Heat 5/10 Major 7 d/yr ≥104°F today · 20 d/yr by 30 yrs out
- Wind 2/10 Low 0% chance of damaging wind over 30 yrs
- Air quality 2/10 Low 1 unhealthy d/yr today · 2 by 30 yrs out
Nearby sold comps map
Loading sold comps map…
Walkable amenities ~0.75 mi
Loading nearby amenities…
Taxation est. · year 1
- Rental income
- $11,891
- − Mortgage interest
- −$3,305
- − Property taxes
- −$885
- − Insurance
- −$295
- − Repairs & maintenance
- −$951
- − Management
- −$951
- − Depreciation
- −$1,716
- Taxable income
- $3,787
- Est. tax owed @ 24.0%
- −$909
- After-tax cash flow
- $3,592/yr
For passive investors: Depreciation is non-cash, so a rental often shows a tax loss while cash-flowing — sheltering income. Rental losses are passive: they offset passive income freely, and up to $25,000/yr can offset ordinary (W-2) income if you actively participate and your MAGI is under $100k (phasing out to $0 by $150k); unused losses carry forward. On sale, claimed depreciation is recaptured at up to 25%, and gains may owe capital-gains tax (a 1031 exchange can defer both). Figures are a year-1 estimate at your 24.0% rate — not tax advice; consult a CPA.
Condition & rehab AI · 2 photos
This property requires extensive repairs and maintenance, including exterior siding, roof, and landscaping. Immediate action is needed to improve its condition and increase its resale or rental value.
Repairs flagged
- Major exterior siding — Significant overgrowth and peeling paint
- Major roof — Aged appearance, potential need for inspection
- Major foundation/structure — General disrepair and overgrown vegetation
Value-add opportunities
- Both landscaping and exterior maintenance — Improves curb appeal and overall property value
- Both exterior painting — Enhances curb appeal and property value
- Both roof inspection and repair — Ensures structural integrity and prevents further damage
Renovation cost estimate screening
| Repair item | Severity | Est. cost |
|---|---|---|
| exterior siding · Significant overgrowth and peeling paint | Major | $15,000–50,000 |
| roof · Aged appearance, potential need for inspection | Major | $15,000–50,000 |
| foundation/structure · General disrepair and overgrown vegetation | Major | $15,000–50,000 |
| Total estimated repair cost · 3 items | $45,000–150,000 |
Value-add ROI direction
- Both landscaping and exterior maintenance — Improves curb appeal and overall property value ↑
- Both exterior painting — Enhances curb appeal and property value ↑
- Both roof inspection and repair — Ensures structural integrity and prevents further damage ↑
ⓘ Cost ranges are severity-bucket heuristics (US national rule-of-thumb). Get contractor quotes + a written scope before underwriting a rehab budget.
Schools (NCES district)
- District
- Springfield R-XII
- NCES district ID
- 2928860
- Math proficiency
- 32% ▼ -2.00%
- Reading proficiency
- 46% ▼ -3.00%
- Median HH income
- $37,886
- Composite
- 32.45/100
- National rank
- #5717
- State rank
- #174 of 324 in MO
Livability — Springfield
- Score
- 75/100
- State rank
- #57
- US rank
- #4121
Category grades
Schools grade is shown separately in the Schools card above.
Census & demographics
- Census place
- Springfield, MO
- County
- Greene County · 244,327 people
- City population
- 223,044
- Metro
- Springfield, MO
- Population (ZIP)
- 46,739
- Household income
- $55,019
- Rent vs Own
- Severe rent burden
- 1818.0
Population outlook (Greene County) Hauer SSP2
- Today (2025)
- 319,054 people
- By 2030
- 335,135 · +5.0%
- By 2040
- 366,186 · +14.8%
- By 2050
- 397,431 · +24.6%
- By 2075
- 477,035 · +49.5%
- By 2100
- 520,828 · +63.2%
Race, ethnicity, and origin ACS 2023
- Neighborhood character
- Predominantly White (81%)
- Race & ethnicity
- White 81% Two or more races 8% Hispanic / Latino 5% Black 4% Asian 2%
- Common ancestry
- Slovak 2% Lithuanian 2% Italian 2%
- Foreign-born
- 3% · Canada, Vietnam
- Languages at home
- 95% English-only · Spanish 2% Vietnamese 1% Other Indo-European 1%
Political lean MEDSL · Greene
- 2024 margin
- Strong R (+20.8) · D 38.9% · R 59.7% · Other 1.4%
- 2008→2024 swing
- -5.0pp toward R · 2008: -15.8pp · 2024: -20.8pp
- All cycles
- 2024: R+20.8 2020: R+20.1 2016: R+27.4 2012: R+24.4 2008: R+15.8
Not yet ingested
- Civics
- —
Market trends
- HPI YoY
- ▼ -99.72%
- Current HPI
- 212.9826
- Rent YoY
- ▲ 4.82%
- Metro
- Springfield, MO
- State GDP YoY
- ▲ 1.84%
- F500 in state
- 20
Industry mix (Fortune 500 HQ in MO)
| Industry | F500 HQs | Revenue |
|---|---|---|
| Healthcare | 1 | $163B |
|
||
| Insurance | 1 | $21B |
|
||
| Industrial Technology | 1 | $17B |
|
||
| Retail | 1 | $16B |
|
||
| Industrial Distribution | 1 | $10B |
|
||
| Utilities | 1 | $9B |
|
||
Price history
1 event — show timeline
- 2026-06-01 Listed $59,000 SOMO
Cash-flow waterfall
monthlySold comps — $/sqft
last 12 mo · ≤1 miLoading sold comps…