 Multi-family
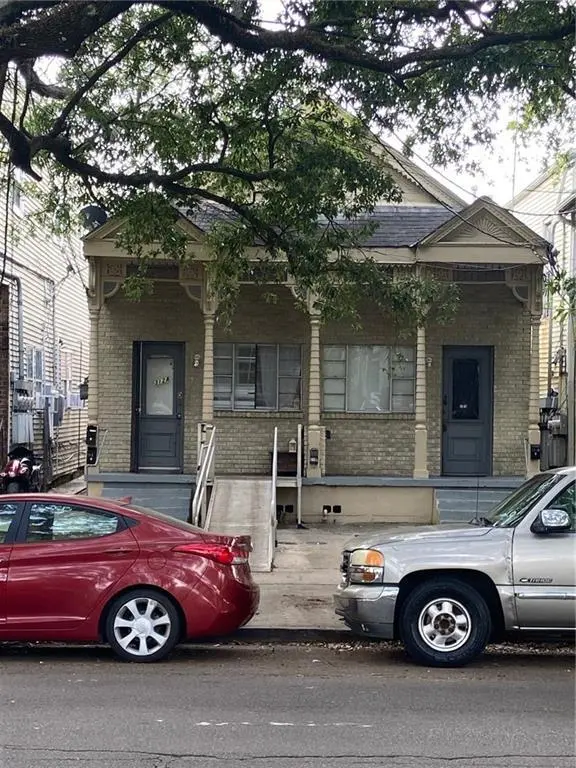
312 14 S Norman C Francis Pkwy · New Orleans, LA
Flood risk 8/10 · Major
- FEMA flood zone
- AE
- Chance of flooding over 30 yrs
- 0.78%
- Est. flood insurance / yr
- $1,737 – $8,500
Fire risk 1/10 · Minimal
- Est. fire insurance / yr
- $1,269 – $2,357
Heat risk 10/10 · Severe
- Hot days now (above 108°F)
- 7 days/yr
- Hot days in 30 yrs
- 21 days/yr
Wind risk 10/10 · Severe
- Chance of severe wind over 30 yrs
- 99.0%
Air-quality risk 4/10 · Minor
- Unhealthy air days now
- 4 days/yr
- Unhealthy air days in 30 yrs
- 4 days/yr
Risk factors via First Street. Map © Google.
Why this score? — see what drove the B- grade
The composite is a weighted blend of 9 inputs, each scored 0–100. Each bar is that input's sub-score; the figure is the points it added to the 100-point composite (weight × sub-score).
- Cash flow +30.0/30.0
- DSCR +10.0/10.0
- 1% rule +9.2/10.0
- ARV discount +5.8/15.0
- Livability +4.0/5.0
- Rent growth +2.5/5.0
- Condition / age +2.5/5.0
- Schools +1.6/10.0
- Appreciation +0.0/10.0
$425,000
🖨 Deal sheet 📄 Offer letter ✓ Due diligence
Multi-family units
County records classify this as Multi-Family (5+ Unit). Listing-text estimate: 1 unit. estimate disagrees with records
5+ unit building — per-unit beds/baths from public records are typically unavailable; the breakdown below (if shown) is an estimate from the listing text.
Listing remarks MLS
Excellent investment opportunity in the heart of Mid City! This fully occupied multifamily property features 5 income-producing units generating a total of $3,900 per month. With long-term tenants in place, this property offers immediate and stable cash flow. Centrally located just minutes from the interstate, downtown, and the streetcar line, it offers unbeatable convenience and accessibility for residents. Whether you’re a seasoned investor or looking to start your portfolio, this turnkey property is a solid addition with strong rental history and consistent occupancy. Don’t miss this rare chance to own in one of the city’s most connected neighborhoods! Neighboring properties also available. The listing broker is also part owner of the seller corporation.
Key facts
- Consistent occupancy
- Stable cash flow
- Centrally located
Tags
Neighborhood map
What this means for you Summary
Snapshot
- This is a 5-bed/5.0-bath multifamily listed at $425k.
Deal economics
- At list price, monthly cash flow is $2k ($19k/yr) — positive.
- The deal already cash-flows at list — no discount required.
- Meets the 1% rule at list price ($6k rent vs $425k).
- Recommended offer: $374k (12.0% below list) — sets the bar for market timing.
- Cap rate 12.0% vs local median 4.4% in New Orleans — top-decile yield for the area; either an underpriced asset or a hidden risk that comps aren't pricing in. Stress-test before assuming the spread holds.
Location & tenants
- Location reads 81/100 on livability (#3 in LA, #1,383 nationally) — a professional / high-income tenant draw. Strengths: amenities A+, commute A+, health & safety A+; Watch: crime C-, employment D.
- Orleans Parish (urban): math 11% / reading 27% proficiency, ranked #69 of 98 in LA (top 70%) — low school quality limits family demand, transient renter base, plan for 1-2y turnover; 68% free/reduced lunch — lower-income household profile, screen leases tightly.
- Market conditions: Rents soft (-0.2%/yr); 381 active listings in the ZIP; 10 comparable units currently listed for rent nearby; rentals at typical pace (median 24d on market — plan ~3-4 weeks tenant-placement turnaround); 710 units permitted in Orleans Parish in 2024 (244 in 5+ unit buildings).
- At $6,030/mo this rent would consume 136% of the median local household income ($53k/yr) (locally 3381% of renters already pay >50% of income on rent) — very limited rent-growth headroom before tenants either downsize or default.
Forward outlook
- Local home prices are declining (-3.0%/yr); year-one equity from $3k of loan paydown is wiped out by about $13k of value loss. Plan a longer hold.
- Orleans County population projected at +61% by 2050 — long-run rental-demand tailwind backs the buy-and-hold thesis.
Negotiation context
- It's been on market 162 days — a 12% lower offer ($374k) is reasonable based on typical stale-listing flexibility.
- 3 sale attempts with the ask held roughly flat each time — persistent listings suggest the price (not the market) is what's stuck; bring a comps-based counter.
Risks & watch-outs
- Watch-outs: flood insurance adds $427/mo; built in 1940 — expect roof / HVAC / electrical / plumbing capex.
- Climate carrying-cost: in FEMA flood zone AE (mandatory federal flood insurance); severe wind risk, 99% chance of damaging wind over 30y; extreme-heat days projected 7→21/yr by 2055 (HVAC capex compounding) — expect insurance premiums to compound above CPI over the hold.
Questions for the listing agent
- It's been on market 162 days. Have you received any prior offers? Is the seller open to a 12% concession, seller financing, or rate buy-down credit?
- Built in 1940 — when were the roof, HVAC, electrical panel, plumbing, and water heater last replaced?
- What's the actual annual flood-insurance premium (NFIP or private), and is the property in a SFHA with mandatory coverage?
- Why hasn't it sold? Are there any deal-killer items the seller is aware of (foundation, flood, title, zoning, code violations)?
- Is there a deadline driving the sale (1031 exchange, divorce, estate, relocation)? That informs how much negotiation room exists.
- What's the average days-on-market for RENTAL listings here right now (not sales)? A rising rental-DOM trend means longer vacancies and softer asking-rent achievability than the comps imply.
- What's the recent tenant-quality profile in this submarket — average credit score on applications, eviction rate, late-payment / NSF rate, and stable-employment percentage? A property-management company in the area should have these aggregated.
- How much new apartment / multifamily construction is in the pipeline within 1–3 miles? Heavy new supply (>2% of stock underway) typically softens rents 12–24 months out; light construction supports rent growth.
Investment metrics
- 1% rule
- 1.42% ✓
- Cap rate
- 11.97%
- Cash-on-cash
- 20.26%
- DSCR
- 1.90
- GRM
- 5.9
CMA / ARV
- ARV (median comp)
- $409,455
- List price
- $425,000
- Delta
- 3.80%
- Verdict
- FAIR
- Comps
- 20 within 1.0 mi
Show comp detail 12 sales within ~0.75 mi
| Address | Dist | Beds/Ba | Sqft | Sold | Price | $/sf | Match |
|---|---|---|---|---|---|---|---|
| 3101 03 Cleveland Ave | 0.19mi | 6/4.0 (+1) | 2,300 (+5%) | 5mo | $335,000 | $146 | 69 |
| 332 34 S Clark St | 0.11mi | 6/2.0 (+1) | 2,275 (+4%) | 3mo | $225,600 | $99 | 69 |
| 3521 23 Cleveland Ave | 0.19mi | 5/3.0 | 2,280 (+4%) | 11mo | $437,500 | $192 | 67 |
| 129-31 N Genois St | 0.31mi | 4/2.0 (-1) | 2,159 (-1%) | 1mo | $325,000 | $151 | 66 |
| 633 35 S Dupre St | 0.37mi | 4/3.5 (-1) | 2,000 (-8%) | 0mo | $461,600 | $231 | 58 |
| 118 S Norman C Francis Pkwy | 0.13mi | 6/2.0 (+1) | 1,936 (-11%) | 1mo | $175,000 | $90 | 57 |
| 229 31 S Norman C. Francis Pkwy | 0.09mi | 4/2.0 (-1) | 1,978 (-9%) | 10mo | $280,000 | $142 | 55 |
| 312 S Cortez St | 0.29mi | 5/3.5 | 2,509 (+15%) | 2mo | $576,000 | $230 | 54 |
| 2755 Banks St | 0.38mi | 4/4.0 (-1) | 1,920 (-12%) | 5mo | $285,000 | $148 | 49 |
| 2622 24 Palmyra St | 0.54mi | 6/2.0 (+1) | 2,100 (-4%) | 6mo | $212,000 | $101 | 46 |
| 4024 26 Baudin St | 0.51mi | 4/2.0 (-1) | 1,890 (-14%) | 4mo | $290,000 | $153 | 33 |
| 2912 14 St. Peter St | 0.64mi | 4/2.0 (-1) | 1,912 (-12%) | 2mo | $290,000 | $152 | 31 |
Match score weights: distance 35% · size 25% · config 20% · recency 20%. Top-matched comps best support the ARV.
Projected returns pro-forma
-3.0% appreciation · 0.0% rent growth · sell at horizon
- IRR
- 3.3%
- Equity multiple
- 1.12×
- Total profit
- $14,516
- Equity at exit
- $63,369
- IRR
- 9.6%
- Equity multiple
- 1.63×
- Total profit
- $75,140
- Equity at exit
- $36,746
Cash invested: $119,000 (down + closing). Projections, not guarantees.
Landlord ↔ Tenant lean methodology
- Overall (STATE)
- 90 Strongly Landlord-Friendly
- State Louisiana
- 90 Strongly Landlord-Friendly · R+12
- County
- — inherits STATE
- City
- — inherits STATE
ZIP-level market 70119
- Home prices YoY
- -34.8%
- Rents YoY
- -0.2%
- Active inventory
- 381
- Price-to-rent
- 29.4×
Monthly cashflow live
- Estimated rent
- $6,030 high interval (Pro) →
- Mortgage (P&I)
- −$2,229
- Tax from tax record
- −$348 /mo · $4,181/yr
- Insurance
- −$177
- Flood insurance flood zone
- −$427 /mo · $5,118/yr
- HOA
- −$0
- Vacancy / Maint / Mgmt
- −$1,266
- Net cashflow
- $1,583
Break-even live
5-unit breakdown (identical units grouped — click to expand)
| Units | Beds | Baths | Est. rent |
|---|---|---|---|
| 5× units | 1 | 1 | $6,030 |
| #1 | 1 | 1 | $1,206 |
| #2 | 1 | 1 | $1,206 |
| #3 | 1 | 1 | $1,206 |
| #4 | 1 | 1 | $1,206 |
| #5 | 1 | 1 | $1,206 |
| Total (5 units) | $6,030 | ||
UW: 25.0% down · 7.5% · 30yr · 1.5% tax · 5.0% vac · 8.0% maint · 8.0% mgmt
Financing live
Cash to close
- Down payment
- $106,250
- Closing costs
- $12,750
- Reserves months
- —
- Total cash needed
- —
Loan-product check · same deal, 3 products live
Conventional
25% down · 7.5% · 30yr
- Down + closing
- —
- Monthly P&I
- —
- Monthly cashflow
- —
- DSCR
- —
- Eligible?
- —
Personal DTI + credit; lowest rate.
DSCR
20% down · 8.5% · 30yr
- Down + closing
- —
- Monthly P&I
- —
- Monthly cashflow
- —
- DSCR
- —
- Eligible?
- —
No personal income docs; deal must DSCR.
Hard money
10% down · 12.0% · 12mo
- Down + closing
- —
- Monthly P&I
- —
- Monthly cashflow
- —
- DSCR
- —
- Eligible?
- —
Short-term bridge; refi at stabilization.
Rent comps 10 comps
| Address | Beds | Baths | Sqft | Rent | $/sqft | DOM | Units | Dist |
|---|---|---|---|---|---|---|---|---|
| 426 S Lopez St New Orleans, LA | 4.0 | 3.0 | 1400 | $2,300 | $1.64 | 23d | 1 | 0.19mi |
| 2738 Bienville St New Orleans, LA | 4.0 | 3.0 | 1671 | $2,200 | $1.32 | 23d | 1 | 0.49mi |
| 4600 S Carrollton Ave Unit 2B New Orleans, LA | 4.0 | 2.0 | 2097 | $2,850 | $1.36 | 23d | 1 | 0.53mi |
| 326 S Dorgenois St Unit 326 New Orleans, LA | 4.0 | 3.0 | 1510 | $2,300 | $1.52 | 2d | 1 | 0.60mi |
| 2651 Poydras St New Orleans, LA | 1.0–4.0 | 1.0–2.0 | 1095 | $2,545 | $2.32 | 1d | 16 | 0.65mi |
| 2731 Saint Philip St Unit 2733 New Orleans, LA | 4.0 | 2.0 | 2000 | $2,600 | $1.30 | 23d | 1 | 0.90mi |
| 4901 Iberville St New Orleans, LA | 4.0 | 2.5 | 2256 | $3,500 | $1.55 | 43d | 1 | 1.20mi |
| 7922 Colapissa St New Orleans, LA | 4.0 | 2.0 | 1848 | $2,400 | $1.30 | 10d | 1 | 1.27mi |
| 301 City Park Ave New Orleans, LA | 4.0 | 2.0 | 1550 | $2,000 | $1.29 | 14d | 1 | 1.32mi |
| 2117 S Lopez St New Orleans, LA | 5.0 | 2.0 | 1920 | $2,000 | $1.04 | 23d | 1 | 1.44mi |
Listing history 18 events
-
2026-06-18days on market $425,000 Active 162 DOM
-
2026-06-17days on market $425,000 Active 161 DOM
-
2026-06-16days on market $425,000 Active 160 DOM
-
2026-06-15days on market $425,000 Active 159 DOM
-
2026-06-13days on market $425,000 Active 157 DOM
-
2026-06-10days on market $425,000 Active 154 DOM
-
2026-06-09days on market $425,000 Active 153 DOM
-
2026-06-08days on market $425,000 Active 152 DOM
-
2026-06-07days on market $425,000 Active 151 DOM
-
2026-06-05days on market $425,000 Active 148 DOM
-
2026-06-03days on market $425,000 Active 147 DOM
-
2026-06-02days on market $425,000 Active 146 DOM
-
2026-06-01days on market $425,000 Active 145 DOM
-
2026-05-31days on market $425,000 Active 144 DOM
-
2026-01-07$425,000 Active 785-char remark
Show marketing remark (766 chars)
Excellent investment opportunity in the heart of Mid City! This fully occupied multifamily property features 5 income-producing units generating a total of $3,900 per month. With long-term tenants in place, this property offers immediate and stable cash flow. Centrally located just minutes from the interstate, downtown, and the streetcar line, it offers unbeatable convenience and accessibility for residents. Whether you're a seasoned investor or looking to start your portfolio, this turnkey property is a solid addition with strong rental history and consistent occupancy. Don't miss this rare chance to own in one of the city's most connected neighborhoods! Neighboring properties also available.The listing broker is also part owner of the seller corporation.
-
2026-01-07$425,000 Active 766-char remark
Show marketing remark (766 chars)
Excellent investment opportunity in the heart of Mid City! This fully occupied multifamily property features 5 income-producing units generating a total of $3,900 per month. With long-term tenants in place, this property offers immediate and stable cash flow. Centrally located just minutes from the interstate, downtown, and the streetcar line, it offers unbeatable convenience and accessibility for residents. Whether you're a seasoned investor or looking to start your portfolio, this turnkey property is a solid addition with strong rental history and consistent occupancy. Don't miss this rare chance to own in one of the city's most connected neighborhoods! Neighboring properties also available.The listing broker is also part owner of the seller corporation.
-
2025-04-29$425,000 Active
-
2001-01-01soldstatus $11,007,900
ⓘ Source: listings_history table (triggers on properties + properties_extension) + one-shot
backfill from property_details.listing_events for pre-trigger history.
Tax reassessment forecast LA · Resets to sale price
- Current annual tax
- $4,181 · $348/mo
- Projected year-2 tax
- $4,181 · $348/mo
- Expected delta
- $0/yr ($0/mo · 0.0%)
ⓘ Screening estimate from a state-policy table — verify with the county assessor before closing.
Climate risk First Street
- Flood 8/10 Severe FEMA zone AE · 78% chance over 30 yrs
- Wildfire 1/10 Low
- Heat 10/10 Extreme 7 d/yr ≥108°F today · 21 d/yr by 30 yrs out
- Wind 10/10 Extreme 99% chance of damaging wind over 30 yrs
- Air quality 4/10 Moderate 4 unhealthy d/yr today · 4 by 30 yrs out
Nearby sold comps map
Loading sold comps map…
Walkable amenities ~0.75 mi
Loading nearby amenities…
Taxation est. · year 1
- Rental income
- $72,360
- − Mortgage interest
- −$23,807
- − Property taxes
- −$4,181
- − Insurance
- −$7,244
- − Repairs & maintenance
- −$5,789
- − Management
- −$5,789
- − Depreciation
- −$12,364
- Taxable income
- $13,187
- Est. tax owed @ 24.0%
- −$3,165
- After-tax cash flow
- $15,830/yr
For passive investors: Depreciation is non-cash, so a rental often shows a tax loss while cash-flowing — sheltering income. Rental losses are passive: they offset passive income freely, and up to $25,000/yr can offset ordinary (W-2) income if you actively participate and your MAGI is under $100k (phasing out to $0 by $150k); unused losses carry forward. On sale, claimed depreciation is recaptured at up to 25%, and gains may owe capital-gains tax (a 1031 exchange can defer both). Figures are a year-1 estimate at your 24.0% rate — not tax advice; consult a CPA.
Schools (NCES district)
- District
- Orleans Parish
- NCES district ID
- 2201170
- Math proficiency
- 11% ▼ -52.00%
- Reading proficiency
- 27% ▼ -46.00%
- Median HH income
- $37,011
- Composite
- 15.78/100
- National rank
- #9271
- State rank
- #69 of 98 in LA
Livability — New Orleans
- Score
- 81/100
- State rank
- #3
- US rank
- #1383
Category grades
Schools grade is shown separately in the Schools card above.
Census & demographics
- Census place
- New Orleans, LA
- County
- Orleans Parish · 338,817 people
- City population
- 338,817
- Metro
- New Orleans-Metairie, LA
- Population (ZIP)
- 37,253
- Household income
- $53,143
- Rent vs Own
- Severe rent burden
- 3381.0
Population outlook (Orleans County) Hauer SSP2
- Today (2025)
- 513,025 people
- By 2030
- 575,781 · +12.2%
- By 2040
- 700,174 · +36.5%
- By 2050
- 826,541 · +61.1%
- By 2075
- 1,123,374 · +119.0%
- By 2100
- 1,355,609 · +164.2%
Race, ethnicity, and origin ACS 2023
- Neighborhood character
- Diverse neighborhood (Simpson 0.64)
- Race & ethnicity
- Black 44% White 40% Two or more races 10% Hispanic / Latino 9% Asian 1%
- Hispanic origin (detail)
- Mexican 2%
- Common ancestry
- Lithuanian 8% Slovak 2% Romanian 1%
- Foreign-born
- 6% · Canada, Jamaica
- Languages at home
- 91% English-only · Spanish 6% French/Haitian/Cajun 1% Other Indo-European 0%
Political lean MEDSL · Orleans
- 2024 margin
- Solid D (+67.0) · D 82.2% · R 15.2% · Other 2.7%
- 2008→2024 swing
- +6.7pp toward D · 2008: 60.3pp · 2024: 67.0pp
- All cycles
- 2024: D+67.0 2020: D+68.2 2016: D+66.2 2012: D+62.5 2008: D+60.3
Not yet ingested
- Civics
- —
Market trends
- HPI YoY
- ▼ -135.38%
- Current HPI
- 253.1929
- Rent YoY
- ▼ -0.20%
- Metro
- New Orleans-Metairie, LA
- State GDP YoY
- ▲ 3.29%
- F500 in state
- 10
Industry mix (Fortune 500 HQ in LA)
| Industry | F500 HQs | Revenue |
|---|---|---|
| Telecommunications | 2 | $23B |
|
||
| Utilities | 1 | $12B |
|
||
| Wholesale / Distribution | 1 | $5B |
|
||
| Advertising | 1 | $2B |
|
||
Price history
-96.1% since first listed4 events — show timeline
- 2026-01-07 Listed $425,000 AcadianaMLS
- 2026-01-07 Listed $425,000 GSREIN
- 2025-04-29 Listed $425,000 AcadianaMLS
- 2001-01-01 Sold (Public Records) $11,007,900 Public Records
Property tax history
+1.8%/yrLatest (2026): $4,181 · +1.0% YoY. Source: county tax records.
Cash-flow waterfall
monthlySold comps — $/sqft
last 12 mo · ≤1 miLoading sold comps…