1300 Saint Charles Pl Ph 15 · Pembroke Pines, FL
Flood risk 1/10 · Minimal
- FEMA flood zone
- X (shaded)
- Chance of flooding over 30 yrs
- 0.0%
- Est. flood insurance / yr
- $507 – $1,088
Fire risk 1/10 · Minimal
- Est. fire insurance / yr
- $947 – $1,759
Heat risk 10/10 · Severe
- Hot days now (above 105°F)
- 7 days/yr
- Hot days in 30 yrs
- 29 days/yr
Wind risk 10/10 · Severe
- Chance of severe wind over 30 yrs
- 99.0%
Air-quality risk 2/10 · Minimal
- Unhealthy air days now
- 2 days/yr
- Unhealthy air days in 30 yrs
- 2 days/yr
Risk factors via First Street. Map © Google.
Why this score? — see what drove the C- grade
The composite is a weighted blend of 9 inputs, each scored 0–100. Each bar is that input's sub-score; the figure is the points it added to the 100-point composite (weight × sub-score).
- Cash flow +16.5/30.0
- 1% rule +10.0/10.0
- ARV discount +7.5/15.0
- DSCR +5.1/10.0
- Livability +4.2/5.0
- Schools +4.1/10.0
- Rent growth +2.9/5.0
- Condition / age +2.5/5.0
- Appreciation +0.0/10.0
$157,000
🖨 Deal sheet 📄 Offer letter ✓ Due diligence
Listing remarks
Enjoy easy 55+ in the desirable Park Place Community. Prime location close to shopping, banks, malls and main avenues, This Unit 2bedrroms, 2 full bathrooms on 8th. floor, 1100 Sf. The dining/living room is spacious and bright, New AC 2026, tile flooring, walking closets, private screened balcony perfect for morning coffee. Garden view. Laundry room. Assigned parking. Storage room. Community amenities include Clubhouse, heated pools, BBQ area and more. Complex gated with 24/7 security patrol. Just For financing purchases 20% down-payment mandatory. One occupant must be 55+ others 19+. RESERVES, 40Y APPROVED, NO ASSESSMENTS.
Key facts
- Heated pools
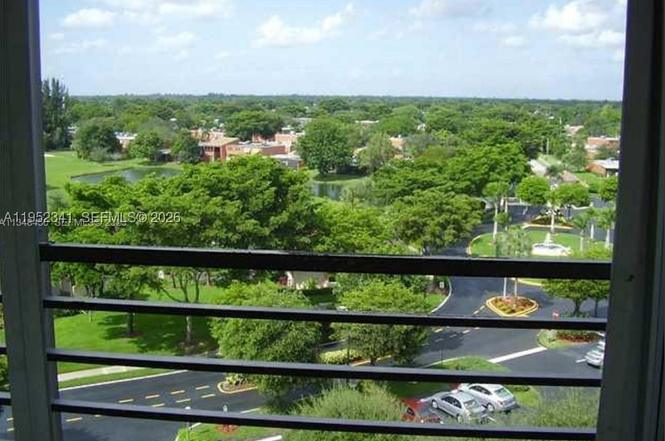
- Garden view
- Laundry room
Tags
Property features AI
Finance
- Financial info: Lease considered; Pets not allowed
- HOA & community: Monthly association fee; Association fee includes cable TV, internet, pest control, sewer and water; Community amenities: billiard room, clubhouse, fitness center, laundry facilities, barbecue, picnic area, pickleball, pool, sauna, storage, tennis courts, trails, transportation service; Senior community
Exterior
- Parking: Assigned parking; Guest parking
- Security: Closed-circuit cameras; Complex fenced; Fire alarm; Intercom; Security guard; Fire sprinkler system; Smoke detectors
- Utilities: Heated pool
- Home design: Condominium (property attached); 8-story building; Entry on 8th level
- Construction: Year built: unknown
- Exterior features: Balcony; Screened balcony
Interior
- Kitchen: Dishwasher; Electric range; Disposal; Refrigerator
- Bedrooms: Bedroom on main level
- Flooring: Tile
- Bathrooms: 2 full bathrooms
- Heating & cooling: Central heating; Central air conditioning
- Interior features: Living/dining room; Split bedroom layout; Walk-in closet(s)
- Laundry & utility: Common area laundry
Neighborhood map
What this means for you Summary
Snapshot
- This is a 2-bed/2.0-bath condo listed at $157k.
Deal economics
- At list price, monthly cash flow is $91 ($1k/yr) — positive.
- The deal already cash-flows at list — no discount required.
- Meets the 1% rule at list price ($3k rent vs $157k).
- Recommended offer: $148k (6.0% below list) — sets the bar for market timing.
- Cap rate 7.0% vs local median 4.0% in Pembroke Pines — top-decile yield for the area; either an underpriced asset or a hidden risk that comps aren't pricing in. Stress-test before assuming the spread holds.
Location & tenants
- Location reads 83/100 on livability (#54 in FL, #933 nationally) — a professional / high-income tenant draw. Strengths: housing A+, health & safety A+, schools A-; Watch: amenities D+, cost of living D+.
- Broward (suburban): math 42% / reading 53% proficiency, ranked #46 of 73 in FL (top 63%) — families likely to look elsewhere, expect single-tenant / working-renter base with shorter leases.
- Market conditions: Rents rising (+1.6%/yr); 222 active listings in the ZIP; 40 comparable units currently listed for rent nearby; rentals at typical pace (median 17d on market — plan ~3-4 weeks tenant-placement turnaround); solid renter incomes; 2,111 units permitted in Broward County in 2024 (1,265 in 5+ unit buildings).
- This rent runs 34% of the median local income ($89k/yr) — at the standard rent-burdened threshold; future hikes will face affordability resistance.
Forward outlook
- Local home prices are declining (-3.0%/yr); year-one equity from $1k of loan paydown is wiped out by about $5k of value loss. Plan a longer hold.
- Broward County population projected at +34% by 2050 — long-run rental-demand tailwind backs the buy-and-hold thesis.
Negotiation context
- It's been on market 74 days — a 6% lower offer ($148k) is reasonable based on typical stale-listing flexibility.
- 3 sale attempts with the ask held roughly flat each time — persistent listings suggest the price (not the market) is what's stuck; bring a comps-based counter.
- Current owner paid $89k; list at $157k implies a 76% gain — meaningful room to come down on a strong offer.
Risks & watch-outs
- Watch-outs: HOA is 28% of rent.
- Climate carrying-cost: severe wind risk, 99% chance of damaging wind over 30y; extreme-heat days projected 7→29/yr by 2055 (HVAC capex compounding) — expect insurance premiums to compound above CPI over the hold.
Questions for the listing agent
- It's been on market 74 days. Have you received any prior offers? Is the seller open to a 6% concession, seller financing, or rate buy-down credit?
- Built in 1979 — when were the roof, HVAC, electrical panel, plumbing, and water heater last replaced?
- What does the HOA fee cover, when was the last increase, and are there any pending special assessments or reserve-fund shortfalls?
- Any open or pending special assessments — roof, HVAC, plumbing, elevator, façade? What's the per-unit balance and payoff schedule, and is the seller paying it off at close or rolling it to the buyer?
- Why hasn't it sold? Are there any deal-killer items the seller is aware of (foundation, flood, title, zoning, code violations)?
- Is there a deadline driving the sale (1031 exchange, divorce, estate, relocation)? That informs how much negotiation room exists.
- Schools are A-rated — typically a magnet for longer-tenancy family renters. What's the average tenant stay here, and is there a school-zone premium baked into asking?
- What's the average days-on-market for RENTAL listings here right now (not sales)? A rising rental-DOM trend means longer vacancies and softer asking-rent achievability than the comps imply.
- What's the recent tenant-quality profile in this submarket — average credit score on applications, eviction rate, late-payment / NSF rate, and stable-employment percentage? A property-management company in the area should have these aggregated.
- How much new apartment / multifamily construction is in the pipeline within 1–3 miles? Heavy new supply (>2% of stock underway) typically softens rents 12–24 months out; light construction supports rent growth.
Investment metrics
- 1% rule
- 1.59% ✓
- Cap rate
- 6.99%
- Cash-on-cash
- 2.49%
- DSCR
- 1.11
- GRM
- 5.2
CMA / ARV
No comps found within radius.
Projected returns pro-forma
-3.0% appreciation · 1.58% rent growth · sell at horizon
- IRR
- -14.7%
- Equity multiple
- 0.49×
- Total profit
- $-22,629
- Equity at exit
- $23,409
- IRR
- -9.9%
- Equity multiple
- 0.45×
- Total profit
- $-24,137
- Equity at exit
- $13,574
Cash invested: $43,960 (down + closing). Projections, not guarantees.
Landlord ↔ Tenant lean methodology
- Overall (STATE)
- 87 Strongly Landlord-Friendly
- State Florida
- 87 Strongly Landlord-Friendly · R+3
- County
- — inherits STATE
- City
- — inherits STATE
ZIP-level market 33026
- Rents YoY
- 1.6%
- Active inventory
- 222
- Price-to-rent
- 5.2×
Monthly cashflow live
- Estimated rent
- $2,504 high interval (Pro) →
- Mortgage (P&I)
- −$823
- Tax from tax record
- −$293 /mo · $3,520/yr
- Insurance
- −$65
- HOA
- −$705
- Vacancy / Maint / Mgmt
- −$526
- Net cashflow
- $91
Break-even live
UW: 25.0% down · 7.5% · 30yr · 1.5% tax · 5.0% vac · 8.0% maint · 8.0% mgmt
Financing live
Cash to close
- Down payment
- $39,250
- Closing costs
- $4,710
- Reserves months
- —
- Total cash needed
- —
Loan-product check · same deal, 3 products live
Conventional
25% down · 7.5% · 30yr
- Down + closing
- —
- Monthly P&I
- —
- Monthly cashflow
- —
- DSCR
- —
- Eligible?
- —
Personal DTI + credit; lowest rate.
DSCR
20% down · 8.5% · 30yr
- Down + closing
- —
- Monthly P&I
- —
- Monthly cashflow
- —
- DSCR
- —
- Eligible?
- —
No personal income docs; deal must DSCR.
Hard money
10% down · 12.0% · 12mo
- Down + closing
- —
- Monthly P&I
- —
- Monthly cashflow
- —
- DSCR
- —
- Eligible?
- —
Short-term bridge; refi at stabilization.
Rent comps 40 comps
| Address | Beds | Baths | Sqft | Rent | $/sqft | DOM | Units | Dist |
|---|---|---|---|---|---|---|---|---|
| 1100 Saint Charles Pl Pembroke Pines, FL | 2.0 | 2.0 | 1100 | $2,000 | $1.82 | 24d | 1 | 0.11mi |
| 1400 Saint Charles Pl #701 Pembroke Pines, FL | 2.0 | 2.0 | 1100 | $2,000 | $1.82 | 2d | 1 | 0.13mi |
| 1400 Saint Charles Pl #323 Pembroke Pines, FL | 2.0 | 2.0 | 1070 | $2,400 | $2.24 | 24d | 1 | 0.13mi |
| 1400 Saint Charles Pl #323 Pembroke Pines, FL | 2.0 | 2.0 | 1070 | $2,350 | $2.20 | 7d | 1 | 0.13mi |
| 1400 Saint Charles Pl #713 Pembroke Pines, FL | 2.0 | 2.0 | 1260 | $2,000 | $1.59 | 16d | 1 | 0.13mi |
| 1400 Saint Charles Pl #608 Pembroke Pines, FL | 2.0 | 2.0 | 1100 | $1,900 | $1.73 | 15d | 1 | 0.13mi |
| 900 Saint Charles Pl #708 Pembroke Pines, FL | 2.0 | 2.0 | 1100 | $1,999 | $1.82 | 2d | 1 | 0.21mi |
| 900 Saint Charles Pl #708 Pembroke Pines, FL | 2.0 | 2.0 | 1100 | $1,999 | $1.82 | 3d | 1 | 0.21mi |
| 1641 Fairway Rd Pembroke Pines, FL | 3.0 | 2.0 | 1359 | $3,200 | $2.35 | 14d | 1 | 0.26mi |
| 1641 Fairway Rd Pembroke Pines, FL | 3.0 | 2.0 | 1359 | $3,200 | $2.35 | 24d | 1 | 0.26mi |
| 1601 NW 98th Way Pembroke Pines, FL | 2.0 | 2.0 | 1060 | $2,700 | $2.55 | 7d | 1 | 0.32mi |
| 1601 NW 98th Way Pembroke Pines, FL | 2.0 | 2.0 | 1060 | $2,700 | $2.55 | 20d | 1 | 0.32mi |
| 785 NW 103rd Ter #202 Pembroke Pines, FL | 2.0 | 2.0 | 914 | $2,100 | $2.30 | 10d | 1 | 0.32mi |
| 785 NW 103rd Ter #202 Pembroke Pines, FL | 2.0 | 2.0 | 914 | $2,100 | $2.30 | 4d | 1 | 0.32mi |
| 10408 NW 8th St Pembroke Pines, FL | 2.0 | 2.0 | 932 | $2,100 | $2.25 | 24d | 1 | 0.35mi |
| 1561 NW 98th Ave #1561 Pembroke Pines, FL | 2.0 | 2.0 | 1060 | $2,500 | $2.36 | 12d | 1 | 0.37mi |
| 716 NW 103rd Ter #203 Pembroke Pines, FL | 2.0 | 2.0 | 932 | $2,200 | $2.36 | 24d | 1 | 0.38mi |
| 1168 NW 97th Ave #232 Pembroke Pines, FL | 2.0 | 2.5 | 1214 | $2,650 | $2.18 | 13d | 1 | 0.39mi |
| 741 NW 105th Ter Pembroke Pines, FL | 2.0 | 2.5 | 1224 | $2,650 | $2.17 | 13d | 1 | 0.44mi |
| 9732 NW 15th St #306 Pembroke Pines, FL | 2.0 | 2.5 | 1214 | $2,650 | $2.18 | 20d | 1 | 0.48mi |
| 353 NW 103rd Ter Pembroke Pines, FL | 2.0 | 2.5 | 1218 | $2,800 | $2.30 | 5d | 1 | 0.49mi |
| 10609 NW 8th St Pembroke Pines, FL | 2.0 | 2.5 | 1224 | $2,700 | $2.21 | 14d | 1 | 0.51mi |
| 1430 W Sandpiper Cir Pembroke Pines, FL | 3.0 | 2.5 | 1773 | $3,416 | $1.93 | 7d | 1 | 0.52mi |
| 730 NW 106th Ave #730 Pembroke Pines, FL | 2.0 | 2.5 | 1224 | $2,550 | $2.08 | 24d | 1 | 0.54mi |
| 730 NW 106th Ter #730 Pembroke Pines, FL | 2.0 | 2.5 | 1224 | $2,500 | $2.04 | 24d | 1 | 0.57mi |
| 9741 NW 5th St Unit 9741 Pembroke Pines, FL | 3.0 | 2.0 | 1574 | $3,300 | $2.10 | 14d | 1 | 0.57mi |
| 10608 NW 6th St Unit 10608 Pembroke Pines, FL | 2.0 | 1.5 | 1008 | $2,395 | $2.38 | 21d | 1 | 0.58mi |
| 1014 NW 107th Ave Pembroke Pines, FL | 2.0 | 1.5 | 1044 | $2,600 | $2.49 | 24d | 1 | 0.60mi |
| 1211 E Golfview Dr Pembroke Pines, FL | 3.0 | 2.0 | 1511 | $3,300 | $2.18 | 24d | 1 | 0.60mi |
| 1761 Bayberry Dr Pembroke Pines, FL | 3.0 | 2.0 | 1450 | $2,650 | $1.83 | 17d | 1 | 0.62mi |
| 1701 NW 96th Ter Unit 1C Pembroke Pines, FL | 3.0 | 2.0 | 1093 | $2,495 | $2.28 | 24d | 1 | 0.62mi |
| 10723 NW 10th St Pembroke Pines, FL | 3.0 | 2.5 | 1399 | $3,100 | $2.22 | 24d | 1 | 0.63mi |
| 1950 Bayberry Dr Pembroke Pines, FL | 3.0 | 2.5 | 1813 | $3,100 | $1.71 | 24d | 1 | 0.66mi |
| 1660 W Golfview Dr Pembroke Pines, FL | 3.0 | 2.5 | 1672 | $3,400 | $2.03 | 10d | 1 | 0.67mi |
| 9511 NW 14th Ct #213 Pembroke Pines, FL | 2.0 | 2.0 | 1080 | $2,400 | $2.22 | 7d | 1 | 0.69mi |
| 10351 Juniper Ct Pembroke Pines, FL | 2.0 | 2.0 | 1196 | $2,650 | $2.22 | 24d | 1 | 0.70mi |
| 201 NW 106th Ter Pembroke Pines, FL | 3.0 | 2.5 | 1332 | $3,200 | $2.40 | 17d | 1 | 0.71mi |
| 201 NW 106th Ter Pembroke Pines, FL | 3.0 | 2.5 | 1332 | $3,200 | $2.40 | 24d | 1 | 0.71mi |
| 10630 NW 1st St #10630 Pembroke Pines, FL | 2.0 | 2.5 | 1224 | $2,650 | $2.17 | 21d | 1 | 0.74mi |
| 9421 NW 15th St #234 Pembroke Pines, FL | 3.0 | 2.5 | 1472 | $2,750 | $1.87 | 16d | 1 | 0.74mi |
HOA detail condo
- Monthly dues
- $705 · $8,460/yr
- Likely covers
- poolsecurityparking
- Assessments
- None detected in remarks — confirm with the listing agent.
Listing history 26 events
-
2026-06-18days on market $157,000 Active 74 DOM
-
2026-06-17days on market $157,000 Active 73 DOM
-
2026-06-16days on market $157,000 Active 72 DOM
-
2026-06-15days on market $157,000 Active 71 DOM
-
2026-06-13pricedays on market $157,000 Active 69 DOM
-
2026-06-09days on market $159,000 Active 65 DOM
-
2026-06-08days on market $159,000 Active 64 DOM
-
2026-06-07days on market $159,000 Active 63 DOM
-
2026-06-04remarks 631-char remark
-
2026-06-04days on market $159,000 Active 60 DOM
-
2026-06-03days on market $159,000 Active 59 DOM
-
2026-06-02pricedays on market $159,000 Active 58 DOM
-
2026-06-01days on market $165,000 Active 57 DOM
-
2026-05-31days on market $165,000 Active 56 DOM
-
2026-05-13price $165,000
-
2026-04-09status Active
-
2026-03-28status Active
-
2026-03-28price $159,900
-
2026-01-25$162,000 Active
-
2016-12-07soldstatus $89,000
-
2005-04-04soldstatus $125,000
-
2004-11-17soldstatus $107,000
-
2002-11-12soldstatus $84,000
-
1999-08-20soldstatus $51,900
-
1998-03-18soldstatus $45,900
-
1996-09-27soldstatus $50,000
ⓘ Source: listings_history table (triggers on properties + properties_extension) + one-shot
backfill from property_details.listing_events for pre-trigger history.
Tax reassessment forecast FL · Resets to sale price
- Current annual tax
- $3,520 · $293/mo
- Projected year-2 tax
- $3,520 · $293/mo
- Expected delta
- $0/yr ($0/mo · 0.0%)
ⓘ Screening estimate from a state-policy table — verify with the county assessor before closing.
Climate risk First Street
- Flood 1/10 Low FEMA zone X (shaded) · 0% chance over 30 yrs
- Wildfire 1/10 Low
- Heat 10/10 Extreme 7 d/yr ≥105°F today · 29 d/yr by 30 yrs out
- Wind 10/10 Extreme 99% chance of damaging wind over 30 yrs
- Air quality 2/10 Low 2 unhealthy d/yr today · 2 by 30 yrs out
Nearby sold comps map
Loading sold comps map…
Walkable amenities ~0.75 mi
Loading nearby amenities…
Taxation est. · year 1
- Rental income
- $30,050
- − Mortgage interest
- −$8,794
- − Property taxes
- −$3,520
- − Insurance
- −$785
- − Repairs & maintenance
- −$2,404
- − Management
- −$2,404
- − HOA
- −$8,460
- − Depreciation
- −$4,567
- Taxable loss
- −$885
- Est. tax savings @ 24.0%
- +$212
- After-tax cash flow
- $1,307/yr
For passive investors: Depreciation is non-cash, so a rental often shows a tax loss while cash-flowing — sheltering income. Rental losses are passive: they offset passive income freely, and up to $25,000/yr can offset ordinary (W-2) income if you actively participate and your MAGI is under $100k (phasing out to $0 by $150k); unused losses carry forward. On sale, claimed depreciation is recaptured at up to 25%, and gains may owe capital-gains tax (a 1031 exchange can defer both). Figures are a year-1 estimate at your 24.0% rate — not tax advice; consult a CPA.
Schools (NCES district)
- District
- Broward
- NCES district ID
- 1200180
- Math proficiency
- 42% ▼ -18.00%
- Reading proficiency
- 53% ▼ -5.00%
- Median HH income
- $52,139
- Composite
- 40.88/100
- National rank
- #3621
- State rank
- #46 of 73 in FL
Livability — Pembroke Pines
- Score
- 83/100
- State rank
- #54
- US rank
- #933
Category grades
Schools grade is shown separately in the Schools card above.
Census & demographics
- Census place
- Pembroke Pines, FL
- County
- Broward County · 1,963,430 people
- City population
- 180,224
- Metro
- Miami-Fort Lauderdale-Pompano Beach, FL
- Population (ZIP)
- 31,172
- Household income
- $89,306
- Rent vs Own
- Severe rent burden
- 517.0
Population outlook (Broward County) Hauer SSP2
- Today (2025)
- 2,207,033 people
- By 2030
- 2,360,704 · +7.0%
- By 2040
- 2,661,208 · +20.6%
- By 2050
- 2,946,698 · +33.5%
- By 2075
- 3,602,273 · +63.2%
- By 2100
- 3,970,984 · +79.9%
Race, ethnicity, and origin ACS 2023
- Neighborhood character
- Diverse neighborhood (Simpson 0.69)
- Race & ethnicity
- Hispanic / Latino 41% White 35% Two or more races 23% Black 15% Asian 4%
- Hispanic origin (detail)
- Puerto Rican 5% Cuban 13% Dominican 2%
- Common ancestry
- Hispanic 5% Romanian 3% Scotch-Irish 2%
- Foreign-born
- 35% · Canada, Jamaica, China
- Languages at home
- 52% English-only · Spanish 35% French/Haitian/Cajun 5% Other Indo-European 4%
Political lean MEDSL · Broward
- 2024 margin
- D (+17.0) · D 58.0% · R 41.0%
- 2008→2024 swing
- -17.8pp toward R · 2008: 34.7pp · 2024: 17.0pp
- All cycles
- 2024: D+17.0 2020: D+29.8 2016: D+35.0 2012: D+34.9 2008: D+34.7
Not yet ingested
- Civics
- —
Market trends
- HPI YoY
- ▼ -248.72%
- Current HPI
- 380.7596
- Rent YoY
- ▲ 1.58%
- Metro
- Miami-Fort Lauderdale-Pompano Beach, FL
- State GDP YoY
- ▲ 3.28%
- F500 in state
- 36
Industry mix (Fortune 500 HQ in FL)
| Industry | F500 HQs | Revenue |
|---|---|---|
| Industrial Technology | 2 | $29B |
|
||
| Insurance | 2 | $17B |
|
||
| Retail | 1 | $60B |
|
||
| Technology Distribution | 1 | $58B |
|
||
| Homebuilding | 1 | $35B |
|
||
| Technology Manufacturing | 1 | $35B |
|
||
Price history
+230.0% since first listed12 events — show timeline
- 2026-05-13 Price Changed $165,000 MARMLS
- 2026-04-09 Relisted — MARMLS
- 2026-03-28 Relisted — MARMLS
- 2026-03-28 Price Changed $159,900 MARMLS
- 2026-01-25 Listed $162,000 MARMLS
- 2016-12-07 Sold (Public Records) $89,000 Public Records
- 2005-04-04 Sold (Public Records) $125,000 Public Records
- 2004-11-17 Sold (Public Records) $107,000 Public Records
- 2002-11-12 Sold (Public Records) $84,000 Public Records
- 1999-08-20 Sold (Public Records) $51,900 Public Records
- 1998-03-18 Sold (Public Records) $45,900 Public Records
- 1996-09-27 Sold (Public Records) $50,000 Public Records
Property tax history
+7.8%/yrLatest (2025): $3,520 · +0.4% YoY. Source: county tax records.
Cash-flow waterfall
monthlySold comps — $/sqft
last 12 mo · ≤1 miLoading sold comps…