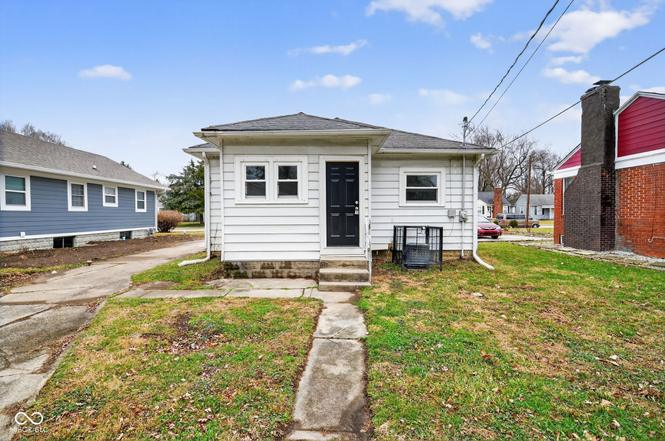
3640 N Temple Ave · Indianapolis city (balance), IN
Flood risk 4/10 · Minor
- FEMA flood zone
- X (unshaded)
- Chance of flooding over 30 yrs
- 0.2%
- Est. flood insurance / yr
- $473 – $860
Fire risk 1/10 · Minimal
- Est. fire insurance / yr
- $717 – $1,331
Heat risk 3/10 · Minor
- Hot days now (above 102°F)
- 7 days/yr
- Hot days in 30 yrs
- 18 days/yr
Wind risk 2/10 · Minimal
- Chance of severe wind over 30 yrs
- 0.0%
Air-quality risk 4/10 · Minor
- Unhealthy air days now
- 5 days/yr
- Unhealthy air days in 30 yrs
- 7 days/yr
Risk factors via First Street. Map © Google.
Why this score? — see what drove the C+ grade
The composite is a weighted blend of 9 inputs, each scored 0–100. Each bar is that input's sub-score; the figure is the points it added to the 100-point composite (weight × sub-score).
- Cash flow +27.4/30.0
- DSCR +9.6/10.0
- ARV discount +8.5/15.0
- 1% rule +7.4/10.0
- Rent growth +2.7/5.0
- Livability +2.5/5.0
- Condition / age +2.5/5.0
- Schools +1.4/10.0
- Appreciation +0.0/10.0
$109,900
🖨 Deal sheet 📄 Offer letter ✓ Due diligence
Listing remarks MLS
2 bedroom bungalow with large covered front porch and 2 car detached garage. The interior features a brick fireplace and built ins. Home needs some TLC.
Key facts
- Stone countertops
- Sunroom
- Shaker cabinets
Tags
Property features AI
Exterior
- Parking: Detached 2-car garage (approximately 440 sq ft)
- Utilities: Public water; Municipal sewer connected
- Home design: Single-family residence; One level
- Construction: Vinyl siding and brick exterior; Concrete perimeter foundation
- Exterior features: Less than 1/4 acre lot (approximately 0.23 acres)
Interior
- Kitchen: Electric oven; Refrigerator; Range hood; Water heater
- Bedrooms: Two bedrooms on the main level (examples: one is 11x10)
- Bathrooms: One full bathroom on the main level
- Heating & cooling: Forced air heating; Central air conditioning
- Interior features: Attic access; Interior-entry basement; Masonry fireplace in the living room; Has basement; Has view
- Laundry & utility: Dedicated laundry room
Neighborhood map
What this means for you Summary
Snapshot
- This is a 2-bed/1.0-bath single-family listed at $110k.
Deal economics
- At list price, monthly cash flow is $321 ($4k/yr) — positive.
- The deal already cash-flows at list — no discount required.
- Meets the 1% rule at list price ($1k rent vs $110k).
- Recommended offer: $100k (9.0% below list) — sets the bar for market timing.
- Cap rate 9.8% vs local median 4.4% in Indianapolis city (balance) — top-decile yield for the area; either an underpriced asset or a hidden risk that comps aren't pricing in. Stress-test before assuming the spread holds.
Location & tenants
- Location reads: area grade C — affects rentability + tenant quality, not the cash-flow math above.
- Indianapolis Public Schools (urban): math 14% / reading 20% proficiency, ranked #286 of 301 in IN (top 95%) — low school quality limits family demand, transient renter base, plan for 1-2y turnover; 77% free/reduced lunch — lower-income household profile, screen leases tightly.
- Market conditions: Rents flat; 334 active listings in the ZIP; 40 comparable units currently listed for rent nearby; rentals at typical pace (median 22d on market — plan ~3-4 weeks tenant-placement turnaround); lower-income renter base — watch delinquency; 1,906 units permitted in Marion County in 2024 (621 in 5+ unit buildings).
- This rent runs 43% of the median local income ($38k/yr) — at the standard rent-burdened threshold; future hikes will face affordability resistance.
Forward outlook
- Local home prices are declining (-3.0%/yr); year-one equity from $760 of loan paydown is wiped out by about $3k of value loss. Plan a longer hold.
- Marion County population projected at +18% by 2050 — long-run rental-demand tailwind backs the buy-and-hold thesis.
Negotiation context
- It's been on market 96 days — a 9% lower offer ($100k) is reasonable based on typical stale-listing flexibility.
- 7 sale attempts since 21y ago; this cycle's ask has dropped $10k (8%) from the opening price — seller is motivated, your offer sets the floor, not the list.
- Current owner paid $8k; list at $110k implies a 1274% gain — meaningful room to come down on a strong offer.
Risks & watch-outs
- Watch-outs: built in 1935 — expect roof / HVAC / electrical / plumbing capex.
Questions for the listing agent
- It's been on market 96 days. Have you received any prior offers? Is the seller open to a 9% concession, seller financing, or rate buy-down credit?
- Built in 1935 — when were the roof, HVAC, electrical panel, plumbing, and water heater last replaced?
- Why hasn't it sold? Are there any deal-killer items the seller is aware of (foundation, flood, title, zoning, code violations)?
- Is there a deadline driving the sale (1031 exchange, divorce, estate, relocation)? That informs how much negotiation room exists.
- What's the average days-on-market for RENTAL listings here right now (not sales)? A rising rental-DOM trend means longer vacancies and softer asking-rent achievability than the comps imply.
- What's the recent tenant-quality profile in this submarket — average credit score on applications, eviction rate, late-payment / NSF rate, and stable-employment percentage? A property-management company in the area should have these aggregated.
- How much new for-sale + rental construction is in the pipeline within 1–3 miles? Heavy new supply typically softens prices + rents 12–24 months out; constrained supply supports both.
Investment metrics
- 1% rule
- 1.24% ✓
- Cap rate
- 9.80%
- Cash-on-cash
- 12.53%
- DSCR
- 1.56
- GRM
- 6.7
CMA / ARV
- ARV (on-the-fly)
- $112,320
- Comps found
- 12
Show comp detail 12 sales within ~0.75 mi
| Address | Dist | Beds/Ba | Sqft | Sold | Price | $/sf | Match |
|---|---|---|---|---|---|---|---|
| 3724 Caroline Ave | 0.40mi | 3/1.0 (+1) | 1,032 (-1%) | 8mo | $72,000 | $70 | 68 |
| 2324 E 36th St | 0.22mi | 3/2.5 (+1) | 1,062 (+2%) | 12mo | $190,000 | $179 | 65 |
| 4034 N Temple Ave | 0.47mi | 2/1.0 | 1,052 (+1%) | 14mo | $72,000 | $68 | 65 |
| 3034 E 35th St | 0.40mi | 3/1.5 (+1) | 1,080 (+4%) | 7mo | $63,000 | $58 | 62 |
| 3460 N Oxford St | 0.28mi | 3/1.0 (+1) | 1,176 (+13%) | 6mo | $50,000 | $43 | 55 |
| 3649 Ralston Ave | 0.65mi | 2/1.0 | 1,008 (-3%) | 16mo | $140,000 | $139 | 51 |
| 3624 N Parker Ave | 0.27mi | 3/2.0 (+1) | 1,179 (+13%) | 8mo | $125,000 | $106 | 50 |
| 3932 Millersville Dr | 0.47mi | 3/1.0 (+1) | 925 (-11%) | 10mo | $100,000 | $108 | 47 |
| 3125 N Tacoma Ave | 0.66mi | 3/1.5 (+1) | 1,104 (+6%) | 9mo | $175,000 | $159 | 44 |
| 3317 Adams St | 0.69mi | 3/1.0 (+1) | 988 (-5%) | 12mo | $70,000 | $71 | 44 |
| 3612 Schofield Ave | 0.61mi | 3/1.0 (+1) | 950 (-9%) | 11mo | $126,000 | $133 | 43 |
| 2217 E 34th St | 0.44mi | 3/1.0 (+1) | 912 (-12%) | 15mo | $163,450 | $179 | 42 |
Match score weights: distance 35% · size 25% · config 20% · recency 20%. Top-matched comps best support the ARV.
Projected returns pro-forma
-3.0% appreciation · 0.81% rent growth · sell at horizon
- IRR
- -0.2%
- Equity multiple
- 0.99×
- Total profit
- $-276
- Equity at exit
- $16,386
- IRR
- 7.0%
- Equity multiple
- 1.48×
- Total profit
- $14,618
- Equity at exit
- $9,502
Cash invested: $30,772 (down + closing). Projections, not guarantees.
Landlord ↔ Tenant lean methodology
- Overall (STATE)
- 90 Strongly Landlord-Friendly
- State Indiana
- 90 Strongly Landlord-Friendly · R+11
- County
- — inherits STATE
- City
- — inherits STATE
ZIP-level market 46218
- Home prices YoY
- -17.1%
- Rents YoY
- 0.8%
- Active inventory
- 334
- Price-to-rent
- 6.7×
Monthly cashflow live
- Estimated rent
- $1,365 high interval (Pro) →
- Mortgage (P&I)
- −$576
- Tax from tax record
- −$135 /mo · $1,623/yr
- Insurance
- −$46
- HOA
- −$0
- Vacancy / Maint / Mgmt
- −$287
- Net cashflow
- $321
Break-even live
UW: 25.0% down · 7.5% · 30yr · 1.5% tax · 5.0% vac · 8.0% maint · 8.0% mgmt
Financing live
Cash to close
- Down payment
- $27,475
- Closing costs
- $3,297
- Reserves months
- —
- Total cash needed
- —
Loan-product check · same deal, 3 products live
Conventional
25% down · 7.5% · 30yr
- Down + closing
- —
- Monthly P&I
- —
- Monthly cashflow
- —
- DSCR
- —
- Eligible?
- —
Personal DTI + credit; lowest rate.
DSCR
20% down · 8.5% · 30yr
- Down + closing
- —
- Monthly P&I
- —
- Monthly cashflow
- —
- DSCR
- —
- Eligible?
- —
No personal income docs; deal must DSCR.
Hard money
10% down · 12.0% · 12mo
- Down + closing
- —
- Monthly P&I
- —
- Monthly cashflow
- —
- DSCR
- —
- Eligible?
- —
Short-term bridge; refi at stabilization.
Rent comps 40 comps
| Address | Beds | Baths | Sqft | Rent | $/sqft | DOM | Units | Dist |
|---|---|---|---|---|---|---|---|---|
| 3741 N Tacoma Ave Indianapolis, IN | 3.0 | 1.0 | 913 | $2,200 | $2.41 | 18d | 1 | 0.12mi |
| 3535 N Oxford St Indianapolis, IN | 3.0 | 1.0 | 1015 | $1,500 | $1.48 | 22d | 1 | 0.26mi |
| 3763 Baltimore Ave Unit 3765 Indianapolis, IN | 1.0 | 1.0 | 750 | $750 | $1.00 | 44d | 1 | 0.30mi |
| 3472 N Dearborn St Indianapolis, IN | 2.0 | 1.0 | 890 | $1,099 | $1.23 | 20d | 1 | 0.42mi |
| 3723 Orchard Ave Unit 3723 Indianapolis, IN | 1.0 | 1.5 | 700 | $1,300 | $1.86 | 24d | 1 | 0.48mi |
| 3363 Nicholas Ave Indianapolis, IN | 2.0 | 1.0 | 720 | $1,000 | $1.39 | 4d | 1 | 0.53mi |
| 1902 E 35th St Indianapolis, IN | 3.0 | 1.0 | 1100 | $1,600 | $1.45 | 44d | 1 | 0.60mi |
| 3522 N Olney St Indianapolis, IN | 3.0 | 1.0 | 768 | $1,300 | $1.69 | 44d | 1 | 0.64mi |
| 3421 N Olney St Indianapolis, IN | 2.0 | 1.0 | 720 | $1,195 | $1.66 | 16d | 1 | 0.71mi |
| 3121 Baltimore Ave Indianapolis, IN | 3.0 | 1.0 | 1232 | $7,865 | $6.38 | 8d | 1 | 0.72mi |
| 3615 Sherman Forest Dr Indianapolis, IN | 4.0 | 1.0–2.5 | 1057 | $1,288 | $1.22 | 4d | 1 | 0.77mi |
| 4115 Meadows Dr Indianapolis, IN | 1.0–3.0 | 1.0–2.0 | 1013 | $1,374 | $1.36 | 44d | 9 | 0.80mi |
| 3383 Station St Indianapolis, IN | 3.0 | 1.0 | 744 | $1,250 | $1.68 | 24d | 1 | 0.88mi |
| 3725 N Sherman Dr #7 Indianapolis, IN | 2.0 | 1.0 | 729 | $845 | $1.16 | 4d | 1 | 0.89mi |
| 2931 N Tacoma Ave Unit 31 Indianapolis, IN | 2.0 | 1.0 | 800 | $950 | $1.19 | 8d | 1 | 0.92mi |
| 4301 Crittenden Ave Indianapolis, IN | 2.0 | 1.0 | 1376 | $1,350 | $0.98 | 44d | 1 | 0.93mi |
| 4303 Norwaldo Ave Indianapolis, IN | 3.0 | 1.0 | 1050 | $1,200 | $1.14 | 44d | 1 | 0.97mi |
| 4326 Crittenden Ave Indianapolis, IN | 2.0 | 1.0 | 812 | $1,045 | $1.29 | 20d | 1 | 0.99mi |
| 4400 E Fall Creek Parkway North Dr Indianapolis, IN | 1.0–2.0 | 1.0–1.5 | 857 | $1,349 | $1.57 | 2d | 31 | 0.99mi |
| 3207 N Arsenal Ave Indianapolis, IN | 3.0 | 1.0 | 994 | $1,195 | $1.20 | 24d | 1 | 1.02mi |
| 2949 Adams St Indianapolis, IN | 2.0 | 1.0 | 978 | $1,150 | $1.18 | 44d | 1 | 1.03mi |
| 2920 N Lasalle St Indianapolis, IN | 3.0 | 1.0 | 875 | $1,095 | $1.25 | 18d | 1 | 1.03mi |
| 4309 Ralston Ave Indianapolis, IN | 3.0 | 1.0 | 918 | $1,600 | $1.74 | 15d | 1 | 1.06mi |
| 3541 Birchwood Ave Indianapolis, IN | 3.0 | 1.0 | 1400 | $1,549 | $1.11 | 12d | 1 | 1.09mi |
| 4448 Evanston Ave Unit B Indianapolis, IN | 2.0 | 1.5 | 1500 | $1,400 | $0.93 | 44d | 1 | 1.10mi |
| 4448 Evanston Ave Unit B Indianapolis, IN | 2.0 | 1.5 | 1500 | $1,275 | $0.85 | 22d | 1 | 1.10mi |
| 2820 Caroline Ave Indianapolis, IN | 3.0 | 1.5 | 1112 | $1,250 | $1.12 | 24d | 1 | 1.11mi |
| 2511 E 46th St Indianapolis, IN | 1.0–2.0 | 1.0–2.0 | 830 | $1,305 | $1.57 | 44d | 2 | 1.12mi |
| 3476 Birchwood Ave Indianapolis, IN | 3.0 | 1.5 | 1420 | $1,625 | $1.14 | 24d | 1 | 1.13mi |
| 3132 Dr Andrew J Brown Ave Indianapolis, IN | 2.0 | 1.0–2.0 | 791 | $2,120 | $2.68 | 2d | 46 | 1.14mi |
| 2830 Lasalle St Unit 28 Indianapolis, IN | 2.0 | 1.0 | 1400 | $1,100 | $0.79 | 44d | 1 | 1.14mi |
| 2827 Adams St Indianapolis, IN | 3.0 | 2.0 | 1200 | $1,512 | $1.26 | 2d | 1 | 1.18mi |
| 3909 Winthrop Ave Unit B Indianapolis, IN | 2.0 | 1.5 | 931 | $1,550 | $1.66 | 12d | 1 | 1.19mi |
| 4521 Norwaldo Ave Unit A Indianapolis, IN | 2.0 | 1.5 | 1024 | $1,525 | $1.49 | 24d | 1 | 1.22mi |
| 4521 Norwaldo Ave Unit B Indianapolis, IN | 2.0 | 1.5 | 1054 | $1,600 | $1.52 | 44d | 1 | 1.22mi |
| 916 Fairfield Ave Unit 918 Indianapolis, IN | 3.0 | 1.0 | 1000 | $1,300 | $1.30 | 8d | 1 | 1.22mi |
| 3509 Guilford Ave Indianapolis, IN | 3.0 | 1.5 | 1351 | $1,445 | $1.07 | 15d | 1 | 1.24mi |
| 3139 Guilford Ave Indianapolis, IN | 3.0 | 1.0 | 1068 | $1,345 | $1.26 | 44d | 1 | 1.29mi |
| 3920 E 30th St Indianapolis, IN | 3.0 | 1.0 | 1071 | $1,350 | $1.26 | 8d | 1 | 1.29mi |
| 3920 E 30th St Indianapolis, IN | 3.0 | 1.0 | 1071 | $1,350 | $1.26 | 4d | 1 | 1.29mi |
Listing history 19 events
-
2026-04-30status Pending
-
2026-04-17price $109,900
-
2026-03-26status Active
-
2026-03-19status Pending
-
2026-01-16$119,900 Active
-
2025-12-21historical
-
2025-11-28status Active
-
2025-11-24status Pending
-
2025-11-16price $119,900
-
2025-10-11price $129,900
-
2025-09-11price $139,900
-
2025-08-21$144,900 Active
-
2010-04-20historical 152-char remark
Show marketing remark (152 chars)
2 bedroom bungalow with large covered front porch and 2 car detached garage. The interior features a brick fireplace and built ins. Home needs some TLC.
-
2010-04-19soldstatus $8,000 152-char remark
Show marketing remark (152 chars)
2 bedroom bungalow with large covered front porch and 2 car detached garage. The interior features a brick fireplace and built ins. Home needs some TLC.
-
2010-02-03$9,900 152-char remark
Show marketing remark (152 chars)
2 bedroom bungalow with large covered front porch and 2 car detached garage. The interior features a brick fireplace and built ins. Home needs some TLC.
-
2008-08-10historical
-
2008-03-11$47,000
-
2006-02-04historical
-
2005-10-04$32,000
ⓘ Source: listings_history table (triggers on properties + properties_extension) + one-shot
backfill from property_details.listing_events for pre-trigger history.
Tax reassessment forecast IN · Partial reset (capped growth)
- Current annual tax
- $1,623 · $135/mo
- Projected year-2 tax
- $1,623 · $135/mo
- Expected delta
- $0/yr ($0/mo · 0.0%)
ⓘ Screening estimate from a state-policy table — verify with the county assessor before closing.
Climate risk First Street
- Flood 4/10 Moderate FEMA zone X (unshaded) · 20% chance over 30 yrs
- Wildfire 1/10 Low
- Heat 3/10 Moderate 7 d/yr ≥102°F today · 18 d/yr by 30 yrs out
- Wind 2/10 Low 0% chance of damaging wind over 30 yrs
- Air quality 4/10 Moderate 5 unhealthy d/yr today · 7 by 30 yrs out
Nearby sold comps map
Loading sold comps map…
Walkable amenities ~0.75 mi
Loading nearby amenities…
Taxation est. · year 1
- Rental income
- $16,383
- − Mortgage interest
- −$6,156
- − Property taxes
- −$1,623
- − Insurance
- −$550
- − Repairs & maintenance
- −$1,311
- − Management
- −$1,311
- − Depreciation
- −$3,197
- Taxable income
- $2,236
- Est. tax owed @ 24.0%
- −$537
- After-tax cash flow
- $3,318/yr
For passive investors: Depreciation is non-cash, so a rental often shows a tax loss while cash-flowing — sheltering income. Rental losses are passive: they offset passive income freely, and up to $25,000/yr can offset ordinary (W-2) income if you actively participate and your MAGI is under $100k (phasing out to $0 by $150k); unused losses carry forward. On sale, claimed depreciation is recaptured at up to 25%, and gains may owe capital-gains tax (a 1031 exchange can defer both). Figures are a year-1 estimate at your 24.0% rate — not tax advice; consult a CPA.
Schools (NCES district)
- District
- Indianapolis Public Schools
- NCES district ID
- 1804770
- Math proficiency
- 14% ▼ -7.00%
- Reading proficiency
- 20% ▼ -3.00%
- Median HH income
- $32,034
- Composite
- 13.69/100
- National rank
- #9499
- State rank
- #286 of 301 in IN
Livability — Indianapolis city (balance)
No livability data for this city. (Only ~50 U.S. cities are tracked.)
Census & demographics
- Census place
- Indianapolis city (balance), IN
- County
- Marion County · 998,460 people
- City population
- 881,119
- Metro
- Indianapolis-Carmel-Anderson, IN
- Population (ZIP)
- 29,360
- Household income
- $38,063
- Rent vs Own
- Severe rent burden
- 2340.0
Population outlook (Marion County) Hauer SSP2
- Today (2025)
- 1,025,572 people
- By 2030
- 1,065,727 · +3.9%
- By 2040
- 1,141,577 · +11.3%
- By 2050
- 1,208,920 · +17.9%
- By 2075
- 1,367,288 · +33.3%
- By 2100
- 1,438,201 · +40.2%
Race, ethnicity, and origin ACS 2023
- Neighborhood character
- Predominantly Black (68%)
- Race & ethnicity
- Black 68% White 18% Hispanic / Latino 9% Two or more races 6%
- Hispanic origin (detail)
- Mexican 6%
- Common ancestry
- Romanian 1%
- Foreign-born
- 5% · Canada, Philippines
- Languages at home
- 92% English-only · Spanish 7%
Political lean MEDSL · Marion
- 2024 margin
- Strong D (+27.7) · D 63.0% · R 35.3% · Other 1.7%
- 2008→2024 swing
- -0.7pp no change · 2008: 28.4pp · 2024: 27.7pp
- All cycles
- 2024: D+27.7 2020: D+29.1 2016: D+22.8 2012: D+22.2 2008: D+28.4
Not yet ingested
- Civics
- —
Market trends
- HPI YoY
- ▼ -81.57%
- Current HPI
- 395.7071
- Rent YoY
- ▲ 0.81%
- Metro
- Indianapolis-Carmel-Anderson, IN
- State GDP YoY
- ▲ 2.90%
- F500 in state
- 18
Industry mix (Fortune 500 HQ in IN)
| Industry | F500 HQs | Revenue |
|---|---|---|
| Industrial Machinery | 2 | $37B |
|
||
| Healthcare | 1 | $177B |
|
||
| Pharmaceuticals | 1 | $45B |
|
||
| Metals / Steel | 1 | $18B |
|
||
| Agriculture | 1 | $17B |
|
||
| Packaging | 1 | $12B |
|
||
Price history
+243.4% since first listed19 events — show timeline
- 2026-04-30 Pending — MIBOR as Distributed by MLS Grid
- 2026-04-17 Price Changed $109,900 MIBOR as Distributed by MLS Grid
- 2026-03-26 Relisted — MIBOR as Distributed by MLS Grid
- 2026-03-19 Pending — MIBOR as Distributed by MLS Grid
- 2026-01-16 Listed $119,900 MIBOR as Distributed by MLS Grid
- 2025-12-21 Listing Removed — MIBOR as Distributed by MLS Grid
- 2025-11-28 Relisted — MIBOR as Distributed by MLS Grid
- 2025-11-24 Pending — MIBOR as Distributed by MLS Grid
- 2025-11-16 Price Changed $119,900 MIBOR as Distributed by MLS Grid
- 2025-10-11 Price Changed $129,900 MIBOR as Distributed by MLS Grid
- 2025-09-11 Price Changed $139,900 MIBOR as Distributed by MLS Grid
- 2025-08-21 Listed $144,900 MIBOR as Distributed by MLS Grid
- 2010-04-20 Listing Removed — MIBOR as Distributed by MLS Grid
- 2010-04-19 Sold (MLS) $8,000 MIBOR as Distributed by MLS Grid
- 2010-02-03 Listed $9,900 MIBOR as Distributed by MLS Grid
- 2008-08-10 Listing Removed — MIBOR as Distributed by MLS Grid
- 2008-03-11 Listed $47,000 MIBOR as Distributed by MLS Grid
- 2006-02-04 Listing Removed — MIBOR as Distributed by MLS Grid
- 2005-10-04 Listed $32,000 MIBOR as Distributed by MLS Grid
Property tax history
+6.0%/yrLatest (2025): $1,623 · +7.2% YoY. Source: county tax records.
Cash-flow waterfall
monthlySold comps — $/sqft
last 12 mo · ≤1 miLoading sold comps…