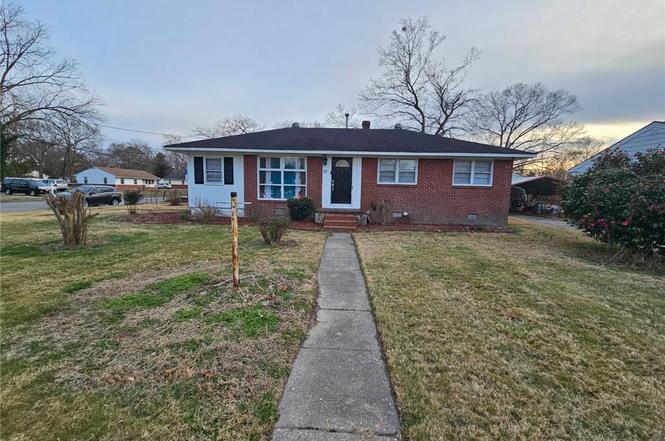
54 Saunders Rd · Newport News, VA
Flood risk 1/10 · Minimal
- FEMA flood zone
- X (unshaded)
- Chance of flooding over 30 yrs
- 0.0%
- Est. flood insurance / yr
- $507 – $1,088
Fire risk 1/10 · Minimal
- Est. fire insurance / yr
- $666 – $1,236
Heat risk 9/10 · Severe
- Hot days now (above 105°F)
- 7 days/yr
- Hot days in 30 yrs
- 17 days/yr
Wind risk 8/10 · Major
- Chance of severe wind over 30 yrs
- 80.0%
Air-quality risk 2/10 · Minimal
- Unhealthy air days now
- 2 days/yr
- Unhealthy air days in 30 yrs
- 2 days/yr
Risk factors via First Street. Map © Google.
Why this score? — see what drove the D+ grade
The composite is a weighted blend of 9 inputs, each scored 0–100. Each bar is that input's sub-score; the figure is the points it added to the 100-point composite (weight × sub-score).
- ARV discount +15.0/15.0
- Cash flow +13.0/30.0
- Rent growth +4.0/5.0
- DSCR +3.9/10.0
- Schools +3.8/10.0
- Livability +3.8/5.0
- 1% rule +3.4/10.0
- Condition / age +2.5/5.0
- Appreciation +0.0/10.0
$224,100
🖨 Deal sheet (PDF) 📄 Offer letter ✓ Due diligence
Listing remarks
Investor Special!!! Seller to make no repairs. HOME TO BE SOLD "AS IS". * * * SQ FT. PER CITY RECORDS * * *
Key facts
- Built 1950
- Listed 5 days
Neighborhood map
What this means for you Summary
Snapshot
- This is a 3-bed/1.0-bath single-family listed at $224k.
Deal economics
- At list price, monthly cash flow is $-13 ($-150/yr) — negative.
- To cash-flow at today's rent, offer at most $222k (1.0% below list).
- To meet the 1% rule (rent ≥ 1% of price), the offer needs to be $188k (15.9% below list).
- Recommended offer: $188k (15.9% below list) — sets the bar for 1% rule.
- Cap rate 6.2% vs local median 4.2% in Newport News — top-decile yield for the area; either an underpriced asset or a hidden risk that comps aren't pricing in. Stress-test before assuming the spread holds.
Location & tenants
- Location reads 75/100 on livability (#123 in VA, #4,018 nationally) — a middle-class / working-renter tenant base. Strengths: health & safety A+, cost of living A, housing A; Watch: crime F, commute F.
- Newport News City Public School District (urban): math 34% / reading 54% proficiency, ranked #112 of 131 in VA (top 86%) — families likely to look elsewhere, expect single-tenant / working-renter base with shorter leases.
- Zoned schools: Joseph H. Saunders Elementary (math 16% / reading 35%, grade F, #1,046 of 1,108 statewide, top 95%, 621 students, 89% FRL); Warwick High (math 42% / reading 77%, grade C+, #247 of 319 statewide, top 80%, 1,645 students, 86% FRL) — zoned schools average 87% FRL vs 55% district-wide (32 pts higher); higher-poverty schools than district average — tighter screening recommended.
- Market conditions: Rents rising fast (+6.0%/yr); 89 active listings in the ZIP; 8 comparable units currently listed for rent nearby; rentals at typical pace (median 19d on market — plan ~3-4 weeks tenant-placement turnaround); 522 units permitted in Newport News city in 2024 (458 in 5+ unit buildings).
- This rent runs 32% of the median local income ($71k/yr) — at the standard rent-burdened threshold; future hikes will face affordability resistance.
Forward outlook
- Local home prices are declining (-3.0%/yr); year-one equity from $2k of loan paydown is wiped out by about $7k of value loss. Plan a longer hold.
- Newport News County population projected to shrink 8% by 2050 — rents likely to lag national; underwrite the cash flow, not the appreciation.
Negotiation context
- Only 5 days on market — expect competitive offers; lowballing is unlikely to land.
- Current owner paid $70k; list at $224k implies a 221% gain — meaningful room to come down on a strong offer.
Risks & watch-outs
- Watch-outs: built in 1950 — expect roof / HVAC / electrical / plumbing capex.
- Climate carrying-cost: severe wind risk, 80% chance of damaging wind over 30y; extreme-heat days projected 7→17/yr by 2055 (HVAC capex compounding) — expect insurance premiums to compound above CPI over the hold.
Questions for the listing agent
- What do current leases actually rent for vs. the listed asking? Can we see a recent rent roll and the last 12 months of T-12 income?
- Built in 1950 — when were the roof, HVAC, electrical panel, plumbing, and water heater last replaced?
- Is there a deadline driving the sale (1031 exchange, divorce, estate, relocation)? That informs how much negotiation room exists.
- Schools are B-rated — typically a magnet for longer-tenancy family renters. What's the average tenant stay here, and is there a school-zone premium baked into asking?
- Crime grade is F in this area — have there been break-ins, vandalism, or insurance claims at this property in the last 3 years? What carrier currently insures it and at what premium?
- The area grade is low — what's the realistic commute time and amenity access for the typical tenant pool here? Any planned neighborhood developments (good or bad) we should know about?
- What's the average days-on-market for RENTAL listings here right now (not sales)? A rising rental-DOM trend means longer vacancies and softer asking-rent achievability than the comps imply.
- What's the recent tenant-quality profile in this submarket — average credit score on applications, eviction rate, late-payment / NSF rate, and stable-employment percentage? A property-management company in the area should have these aggregated.
- How much new for-sale + rental construction is in the pipeline within 1–3 miles? Heavy new supply typically softens prices + rents 12–24 months out; constrained supply supports both.
Investment metrics
- 1% rule
- 0.84% ✗
- Cap rate
- 6.23%
- Cash-on-cash
- -0.24%
- DSCR
- 0.99
- GRM
- 9.9
CMA / ARV
- ARV (on-the-fly)
- $281,736
- Comps found
- 12
Show comp detail 12 sales within ~0.75 mi
| Address | Dist | Beds/Ba | Sqft | Sold | Price | $/sf | Match |
|---|---|---|---|---|---|---|---|
| 13 Wedgewood Dr | 0.11mi | 3/1.0 | 1,150 (+3%) | 8mo | $270,000 | $235 | 84 |
| 10 Kingwood Dr | 0.11mi | 3/1.0 | 1,213 (+8%) | 6mo | $259,500 | $214 | 76 |
| 36 Crestwood Dr | 0.17mi | 3/2.0 | 1,246 (+11%) | 9mo | $269,900 | $217 | 62 |
| 8 Sanlun Lakes Dr | 0.33mi | 3/2.0 | 1,239 (+11%) | 3mo | $321,000 | $259 | 60 |
| 21 Sandy Lake Dr | 0.54mi | 3/2.0 | 1,162 (+4%) | 6mo | $299,000 | $257 | 59 |
| 32 Betz Ln | 0.33mi | 3/1.0 | 1,253 (+12%) | 7mo | $290,000 | $231 | 59 |
| 702 Chatsworth Dr | 0.32mi | 3/2.0 | 1,250 (+12%) | 6mo | $315,000 | $252 | 57 |
| 48 Sandy Lake Dr | 0.58mi | 3/2.0 | 1,239 (+11%) | 0mo | $329,900 | $266 | 51 |
| 230 Anne Dr | 0.45mi | 3/2.0 | 1,239 (+11%) | 7mo | $300,000 | $242 | 51 |
| 50 Sandy Lake Dr | 0.58mi | 3/2.0 | 1,240 (+11%) | 1mo | $330,000 | $266 | 50 |
| 13 Westmont Dr | 0.48mi | 3/2.0 | 1,239 (+11%) | 9mo | $330,000 | $266 | 48 |
| 7 Sunny Meade Cv | 0.59mi | 3/2.0 | 1,239 (+11%) | 10mo | $306,000 | $247 | 42 |
Match score weights: distance 35% · size 25% · config 20% · recency 20%. Top-matched comps best support the ARV.
Projected returns pro-forma
-3.0% appreciation · 5.99% rent growth · sell at horizon
- IRR
- -13.5%
- Equity multiple
- 0.50×
- Total profit
- $-31,272
- Equity at exit
- $33,414
- IRR
- -0.6%
- Equity multiple
- 0.96×
- Total profit
- $-2,783
- Equity at exit
- $19,376
Cash invested: $62,748 (down + closing). Projections, not guarantees.
Landlord ↔ Tenant lean methodology
- Overall (STATE)
- 55 Moderately Landlord-Leaning
- State Virginia
- 55 Moderately Landlord-Leaning · D+2
- County
- — inherits STATE
- City
- — inherits STATE
ZIP-level market 23601
- Home prices YoY
- -13.0%
- Rents YoY
- 6.0%
- Active inventory
- 89
- Price-to-rent
- 9.9×
Monthly cashflow live
- Estimated rent
- $1,884 high interval (Pro) →
- Mortgage (P&I)
- −$1,175
- Tax from tax record
- −$233 /mo · $2,791/yr
- Insurance
- −$93
- HOA
- −$0
- Vacancy / Maint / Mgmt
- −$396
- Net cashflow
- $-13
Break-even live
Sensitivity live
| Price | -10% $114 | -5% $51 | +0% $-13 | +5% $-76 | +10% $-139 |
|---|---|---|---|---|---|
| Rent | -10% $-161 | -5% $-87 | +0% $-13 | +5% $62 | +10% $136 |
| Rate | -1.0pp $100 | -0.5pp $44 | base $-13 | +0.5pp $-71 | +1.0pp $-130 |
UW: 25.0% down · 7.5% · 30yr · 1.5% tax · 5.0% vac · 8.0% maint · 8.0% mgmt
Financing live
Cash to close
- Down payment
- $56,025
- Closing costs
- $6,723
- Reserves months
- —
- Total cash needed
- —
Loan-product check · same deal, 3 products live
Conventional
25% down · 7.5% · 30yr
- Down + closing
- —
- Monthly P&I
- —
- Monthly cashflow
- —
- DSCR
- —
- Eligible?
- —
Personal DTI + credit; lowest rate.
DSCR
20% down · 8.5% · 30yr
- Down + closing
- —
- Monthly P&I
- —
- Monthly cashflow
- —
- DSCR
- —
- Eligible?
- —
No personal income docs; deal must DSCR.
Hard money
10% down · 12.0% · 12mo
- Down + closing
- —
- Monthly P&I
- —
- Monthly cashflow
- —
- DSCR
- —
- Eligible?
- —
Short-term bridge; refi at stabilization.
Rent comps 8 comps
| Address | Beds | Baths | Sqft | Rent | $/sqft | DOM | Units | Dist |
|---|---|---|---|---|---|---|---|---|
| 20 Lenora Dr Newport News, VA | 3.0 | 1.5 | 1030 | $1,950 | $1.89 | 12d | 1 | 0.41mi |
| 210 Durham Ct Yorktown, VA | 3.0 | 2.5 | 1440 | $2,100 | $1.46 | 22d | 1 | 0.51mi |
| 110 Foundry Ct Yorktown, VA | 2.0 | 2.5 | 1278 | $1,700 | $1.33 | 16d | 1 | 0.61mi |
| 173 Louise Dr Newport News, VA | 3.0 | 1.0–2.0 | 1000 | $1,725 | $1.73 | 45d | 5 | 0.76mi |
| 6 Old Pond Ct Hampton, VA | 3.0 | 2.5 | 1494 | $2,695 | $1.80 | 18d | 1 | 1.04mi |
| 101 Saint Clair Cir Yorktown, VA | 2.0–3.0 | 2.0 | 1205 | $2,122 | $1.76 | 3d | 20 | 1.05mi |
| 725 Harpersville Rd Newport News, VA | 3.0 | 1.0 | 1003 | $1,700 | $1.69 | 25d | 1 | 1.16mi |
| 1 Guenevere Ct Apt D Newport News, VA | 1.0–2.0 | 1.0 | 760 | $1,029 | $1.35 | 8d | 1 | 1.36mi |
Listing history 4 events
-
2026-03-01status Under Contract
-
2026-02-25$224,100 Active
-
1989-04-03soldstatus $69,900
-
1964-12-18soldstatus $13,831
ⓘ Source: listings_history table (triggers on properties + properties_extension) + one-shot
backfill from property_details.listing_events for pre-trigger history.
Tax reassessment forecast VA · Resets to sale price
- Current annual tax
- $2,791 · $233/mo
- Projected year-2 tax
- $2,791 · $233/mo
- Expected delta
- $0/yr ($0/mo · 0.0%)
ⓘ Screening estimate from a state-policy table — verify with the county assessor before closing.
Climate risk First Street
- Flood 1/10 Low FEMA zone X (unshaded) · 0% chance over 30 yrs
- Wildfire 1/10 Low
- Heat 9/10 Extreme 7 d/yr ≥105°F today · 17 d/yr by 30 yrs out
- Wind 8/10 Severe 80% chance of damaging wind over 30 yrs
- Air quality 2/10 Low 2 unhealthy d/yr today · 2 by 30 yrs out
Nearby sold comps map
Loading sold comps map…
Walkable amenities ~0.75 mi
Loading nearby amenities…
Taxation est. · year 1
- Rental income
- $22,613
- − Mortgage interest
- −$12,553
- − Property taxes
- −$2,791
- − Insurance
- −$1,120
- − Repairs & maintenance
- −$1,809
- − Management
- −$1,809
- − Depreciation
- −$6,519
- Taxable loss
- −$3,989
- Est. tax savings @ 24.0%
- +$957
- After-tax cash flow
- $807/yr
For passive investors: Depreciation is non-cash, so a rental often shows a tax loss while cash-flowing — sheltering income. Rental losses are passive: they offset passive income freely, and up to $25,000/yr can offset ordinary (W-2) income if you actively participate and your MAGI is under $100k (phasing out to $0 by $150k); unused losses carry forward. On sale, claimed depreciation is recaptured at up to 25%, and gains may owe capital-gains tax (a 1031 exchange can defer both). Figures are a year-1 estimate at your 24.0% rate — not tax advice; consult a CPA.
Schools (NCES district)
- District
- Newport News City Public School District
- NCES district ID
- 5102640
- Math proficiency
- 34% ▼ -37.00%
- Reading proficiency
- 54% ▼ -10.00%
- Median HH income
- $49,644
- Composite
- 37.7/100
- National rank
- #4360
- State rank
- #112 of 131 in VA
Livability — Newport News
- Score
- 75/100
- State rank
- #123
- US rank
- #4018
Category grades
Schools grade is shown separately in the Schools card above.
Census & demographics
- Census place
- Newport News, VA
- County
- Newport News City · 178,950 people
- City population
- 178,950
- Metro
- Virginia Beach-Norfolk-Newport News, VA-NC
- Population (ZIP)
- 26,645
- Household income
- $71,279
- Rent vs Own
- Severe rent burden
- 1175.0
Population outlook (Newport News County) Hauer SSP2
- Today (2025)
- 181,076 people
- By 2030
- 179,683 · -0.8%
- By 2040
- 174,649 · -3.5%
- By 2050
- 167,407 · -7.5%
- By 2075
- 147,597 · -18.5%
- By 2100
- 122,144 · -32.5%
Race, ethnicity, and origin ACS 2023
- Neighborhood character
- Diverse neighborhood (Simpson 0.59)
- Race & ethnicity
- White 51% Black 38% Two or more races 7% Hispanic / Latino 5%
- Hispanic origin (detail)
- Mexican 2% Puerto Rican 3%
- Common ancestry
- Slovak 2% Iranian 2% Romanian 1%
- Foreign-born
- 5% · Canada
- Languages at home
- 94% English-only · Spanish 2% French/Haitian/Cajun 1% Arabic 1%
Political lean MEDSL · Newport News
- 2024 margin
- Strong D (+28.8) · D 63.7% · R 34.9% · Other 1.4%
- 2008→2024 swing
- +0.1pp no change · 2008: 28.7pp · 2024: 28.8pp
- All cycles
- 2024: D+28.8 2020: D+32.9 2016: D+25.4 2012: D+30.0 2008: D+28.7
Not yet ingested
- Civics
- —
Market trends
- HPI YoY
- ▼ -42.06%
- Current HPI
- 281.5503
- Rent YoY
- ▲ 5.99%
- Metro
- Virginia Beach-Norfolk-Newport News, VA-NC
- State GDP YoY
- ▲ 2.40%
- F500 in state
- 50
Industry mix (Fortune 500 HQ in VA)
| Industry | F500 HQs | Revenue |
|---|---|---|
| Aerospace / Defense | 4 | $236B |
|
||
| Technology / Defense | 3 | $32B |
|
||
| Financial Services | 2 | $176B |
|
||
| Utilities | 2 | $27B |
|
||
| Insurance | 2 | $25B |
|
||
| Technology | 2 | $15B |
|
||
Price history
+1520.3% since first listed4 events — show timeline
- 2026-03-01 Pending — REINMLS
- 2026-02-25 Listed $224,100 REINMLS
- 1989-04-03 Sold (Public Records) $69,900 Public Records
- 1964-12-18 Sold (Public Records) $13,831 Public Records
Property tax history
+3.8%/yrLatest (2026): $2,791 · +11.6% YoY. Source: county tax records.
Cash-flow waterfall
monthlySold comps — $/sqft
last 12 mo · ≤1 miLoading sold comps…