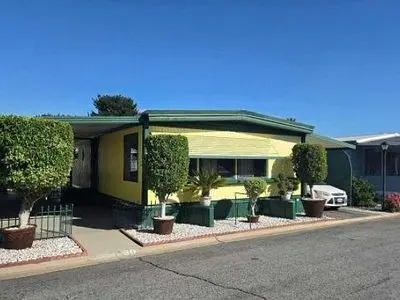
1035 E Huntington Dr · Monrovia, CA
Flood risk 1/10 · Minimal
- FEMA flood zone
- X (unshaded)
- Chance of flooding over 30 yrs
- 0.0%
- Est. flood insurance / yr
- $507 – $1,088
Fire risk 6/10 · Moderate
- Est. fire insurance / yr
- $659 – $1,223
Heat risk 7/10 · Major
- Hot days now (above 101°F)
- 7 days/yr
- Hot days in 30 yrs
- 18 days/yr
Wind risk 1/10 · Minimal
- Chance of severe wind over 30 yrs
- —
Air-quality risk 7/10 · Major
- Unhealthy air days now
- 12 days/yr
- Unhealthy air days in 30 yrs
- 14 days/yr
Risk factors via First Street. Map © Google.
Why this score? — see what drove the B- grade
The composite is a weighted blend of 9 inputs, each scored 0–100. Each bar is that input's sub-score; the figure is the points it added to the 100-point composite (weight × sub-score).
- Cash flow +30.0/30.0
- 1% rule +10.0/10.0
- DSCR +10.0/10.0
- ARV discount +7.5/15.0
- Schools +3.9/10.0
- Rent growth +3.3/5.0
- Livability +2.6/5.0
- Condition / age +2.5/5.0
- Appreciation +0.0/10.0
$255,000
🖨 Deal sheet (PDF) 📄 Offer letter ✓ Due diligence
Listing remarks MLS
Double wide trailer approximately 1200 sq ft with patio at front door and carport for 3 cars on other side.
Key facts
- Doggie door
- Swimming pool
- Private bathroom
Tags
Neighborhood map
What this means for you Summary
Snapshot
- This is a 2-bed/2.0-bath land listed at $255k.
Deal economics
- At list price, monthly cash flow is $2k ($22k/yr) — positive.
- The deal already cash-flows at list — no discount required.
- Meets the 1% rule at list price ($5k rent vs $255k).
- Recommended offer: $247k (3.0% below list) — sets the bar for market timing.
- Cap rate 14.8% vs local median 2.1% in Monrovia — top-decile yield for the area; either an underpriced asset or a hidden risk that comps aren't pricing in. Stress-test before assuming the spread holds.
Location & tenants
- Location reads 52/100 on livability (#993 in CA) — a working-class tenant base; expect higher turnover. Strengths: employment A+, health & safety A-; Watch: schools C-, crime C-, amenities F.
- Monrovia Unified (suburban): math 39% / reading 48% proficiency, ranked #182 of 517 in CA (top 35%) — families likely to look elsewhere, expect single-tenant / working-renter base with shorter leases.
- Market conditions: Rents rising (+3.4%/yr); 71 active listings in the ZIP; 12 comparable units currently listed for rent nearby; rentals leasing fast (median 6d on market — plan ~1-2 weeks tenant-placement turnaround); solid renter incomes; 19,697 units permitted in Los Angeles County in 2024 (9,426 in 5+ unit buildings).
- At $4,527/mo this rent would consume 56% of the median local household income ($97k/yr) (locally 2134% of renters already pay >50% of income on rent) — very limited rent-growth headroom before tenants either downsize or default.
Forward outlook
- Local home prices are declining (-3.0%/yr); year-one equity from $2k of loan paydown is wiped out by about $8k of value loss. Plan a longer hold.
- Los Angeles County population projected at +9% by 2050 — modest demand growth; plan on rents tracking national, not racing it.
- At projected returns (-3.0% appreciation + 3.4% rent growth), your $71k cash investment doubles in ~4 years — after that, you're playing with house money.
Negotiation context
- It's been on market 37 days — a 3% lower offer ($247k) is reasonable based on typical stale-listing flexibility.
- 3 sale attempts since 13y ago with the ask held roughly flat each time — persistent listings suggest the price (not the market) is what's stuck; bring a comps-based counter.
- Current owner paid $49k; list at $255k implies a 420% gain — meaningful room to come down on a strong offer.
Risks & watch-outs
- Climate carrying-cost: major wildfire risk; extreme-heat days projected 7→18/yr by 2055 (HVAC capex compounding) — expect insurance premiums to compound above CPI over the hold.
Questions for the listing agent
- It's been on market 37 days. Have you received any prior offers? Is the seller open to a 3% concession, seller financing, or rate buy-down credit?
- Is there a deadline driving the sale (1031 exchange, divorce, estate, relocation)? That informs how much negotiation room exists.
- What's the average days-on-market for RENTAL listings here right now (not sales)? A rising rental-DOM trend means longer vacancies and softer asking-rent achievability than the comps imply.
- What's the recent tenant-quality profile in this submarket — average credit score on applications, eviction rate, late-payment / NSF rate, and stable-employment percentage? A property-management company in the area should have these aggregated.
- How much new for-sale + rental construction is in the pipeline within 1–3 miles? Heavy new supply typically softens prices + rents 12–24 months out; constrained supply supports both.
Investment metrics
- 1% rule
- 1.78% ✓
- Cap rate
- 14.83%
- Cash-on-cash
- 30.49%
- DSCR
- 2.36
- GRM
- 4.7
CMA / ARV
No comps found within radius.
Projected returns pro-forma
-3.0% appreciation · 3.36% rent growth · sell at horizon
- IRR
- 25.6%
- Equity multiple
- 2.06×
- Total profit
- $75,940
- Equity at exit
- $38,021
- IRR
- 33.5%
- Equity multiple
- 4.11×
- Total profit
- $221,992
- Equity at exit
- $22,048
Cash invested: $71,400 (down + closing). Projections, not guarantees.
Landlord ↔ Tenant lean methodology
- Overall (STATE)
- 18 Strongly Tenant-Friendly
- State California
- 18 Strongly Tenant-Friendly · D+13
- County
- — inherits STATE
- City
- — inherits STATE
ZIP-level market 91016
- Rents YoY
- 3.4%
- Active inventory
- 71
- Price-to-rent
- 4.7×
Monthly cashflow live
- Estimated rent
- $4,527 high interval (Pro) →
- Mortgage (P&I)
- −$1,337
- Tax est. 1.5%
- −$319 /mo · $3,825/yr
- Insurance
- −$106
- HOA
- −$0
- Vacancy / Maint / Mgmt
- −$951
- Net cashflow
- $1,814
Break-even live
Sensitivity live
| Price | -10% $1,990 | -5% $1,902 | +0% $1,814 | +5% $1,726 | +10% $1,638 |
|---|---|---|---|---|---|
| Rent | -10% $1,457 | -5% $1,635 | +0% $1,814 | +5% $1,993 | +10% $2,172 |
| Rate | -1.0pp $1,943 | -0.5pp $1,879 | base $1,814 | +0.5pp $1,748 | +1.0pp $1,681 |
UW: 25.0% down · 7.5% · 30yr · 1.5% tax · 5.0% vac · 8.0% maint · 8.0% mgmt
Financing live
Cash to close
- Down payment
- $63,750
- Closing costs
- $7,650
- Reserves months
- —
- Total cash needed
- —
Loan-product check · same deal, 3 products live
Conventional
25% down · 7.5% · 30yr
- Down + closing
- —
- Monthly P&I
- —
- Monthly cashflow
- —
- DSCR
- —
- Eligible?
- —
Personal DTI + credit; lowest rate.
DSCR
20% down · 8.5% · 30yr
- Down + closing
- —
- Monthly P&I
- —
- Monthly cashflow
- —
- DSCR
- —
- Eligible?
- —
No personal income docs; deal must DSCR.
Hard money
10% down · 12.0% · 12mo
- Down + closing
- —
- Monthly P&I
- —
- Monthly cashflow
- —
- DSCR
- —
- Eligible?
- —
Short-term bridge; refi at stabilization.
Rent comps 12 comps
| Address | Beds | Baths | Sqft | Rent | $/sqft | DOM | Units | Dist |
|---|---|---|---|---|---|---|---|---|
| 1204 Oliva Ct Duarte, CA | 3.0 | 3.5 | 1773 | $5,500 | $3.10 | 6d | 1 | 0.08mi |
| 1018 Royal Oaks Dr Unit C Monrovia, CA | 3.0 | 3.0 | 1725 | $3,995 | $2.32 | 18d | 1 | 0.22mi |
| 1406 S California Ave Unit D Monrovia, CA | 2.0 | 3.0 | 1540 | $3,750 | $2.44 | 2d | 1 | 0.60mi |
| 1233 S California Ave Monrovia, CA | 2.0 | 2.0 | 1800 | $5,000 | $2.78 | 2d | 1 | 0.67mi |
| 1676 3rd St Duarte, CA | 3.0 | 2.5 | 1731 | $3,950 | $2.28 | 25d | 1 | 0.85mi |
| 1750 Fasana Rd Duarte, CA | 4.0 | 1.0–4.0 | 1480 | $4,087 | $2.76 | 0d | 36 | 0.99mi |
| 825 S Myrtle Ave Monrovia, CA | 1.0–3.0 | 1.0–2.0 | 1258 | $4,162 | $3.31 | 0d | 1 | 1.02mi |
| 225 W Duarte Rd Monrovia, CA | 2.0 | 1.0–3.0 | 1537 | $8,185 | $5.32 | 2d | 109 | 1.26mi |
| 1625 S Magnolia Ave Monrovia, CA | 1.0–3.0 | 1.0–2.0 | 1094 | $4,008 | $3.66 | 0d | 49 | 1.31mi |
| 232 May Ave Monrovia, CA | 3.0 | 2.0 | 1484 | $3,800 | $2.56 | 22d | 1 | 1.32mi |
| 211 Linwood Ave Unit A Monrovia, CA | 3.0 | 3.0 | 1562 | $3,850 | $2.46 | 44d | 1 | 1.33mi |
| 1070 Norumbega Dr Monrovia, CA | 3.0 | 3.0 | 2231 | $7,500 | $3.36 | 11d | 1 | 1.46mi |
Listing history 21 events
-
2026-06-18days on market $255,000 Active 37 DOM
-
2026-06-17days on market $255,000 Active 36 DOM
-
2026-06-16days on market $255,000 Active 35 DOM
-
2026-06-16price $255,000 Active 34 DOM
-
2026-06-15days on market $265,000 Active 34 DOM
-
2026-06-13days on market $265,000 Active 32 DOM
-
2026-06-13days on market $265,000 Active 31 DOM
-
2026-06-09days on market $265,000 Active 28 DOM
-
2026-06-08days on market $265,000 Active 27 DOM
-
2026-06-07days on market $265,000 Active 26 DOM
-
2026-06-04days on market $265,000 Active 23 DOM
-
2026-06-03days on market $265,000 Active 22 DOM
-
2026-06-02days on market $265,000 Active 21 DOM
-
2026-06-01days on market $265,000 Active 20 DOM
-
2026-05-31days on market $265,000 Active 19 DOM
-
2026-05-12$265,000 Active 524-char remark
-
2013-07-11soldstatus $49,000 Closed 107-char remark
Show marketing remark (107 chars)
Double wide trailer approximately 1200 sq ft with patio at front door and carport for 3 cars on other side.
-
2013-04-18status Pending 107-char remark
Show marketing remark (107 chars)
Double wide trailer approximately 1200 sq ft with patio at front door and carport for 3 cars on other side.
-
2013-04-11historical
Show marketing remark (107 chars)
Double wide trailer approximately 1200 sq ft with patio at front door and carport for 3 cars on other side.
-
2013-04-11$49,000 Active 107-char remark
Show marketing remark (107 chars)
Double wide trailer approximately 1200 sq ft with patio at front door and carport for 3 cars on other side.
-
2013-04-10$49,000 Active
ⓘ Source: listings_history table (triggers on properties + properties_extension) + one-shot
backfill from property_details.listing_events for pre-trigger history.
Climate risk First Street
- Flood 1/10 Low FEMA zone X (unshaded) · 0% chance over 30 yrs
- Wildfire 6/10 Major
- Heat 7/10 Severe 7 d/yr ≥101°F today · 18 d/yr by 30 yrs out
- Wind 1/10 Low
- Air quality 7/10 Severe 12 unhealthy d/yr today · 14 by 30 yrs out
Nearby sold comps map
Loading sold comps map…
Walkable amenities ~0.75 mi
Loading nearby amenities…
Taxation est. · year 1
- Rental income
- $54,326
- − Mortgage interest
- −$14,284
- − Property taxes
- −$3,825
- − Insurance
- −$1,275
- − Repairs & maintenance
- −$4,346
- − Management
- −$4,346
- − Depreciation
- −$7,418
- Taxable income
- $18,831
- Est. tax owed @ 24.0%
- −$4,520
- After-tax cash flow
- $17,251/yr
For passive investors: Depreciation is non-cash, so a rental often shows a tax loss while cash-flowing — sheltering income. Rental losses are passive: they offset passive income freely, and up to $25,000/yr can offset ordinary (W-2) income if you actively participate and your MAGI is under $100k (phasing out to $0 by $150k); unused losses carry forward. On sale, claimed depreciation is recaptured at up to 25%, and gains may owe capital-gains tax (a 1031 exchange can defer both). Figures are a year-1 estimate at your 24.0% rate — not tax advice; consult a CPA.
Schools (NCES district)
- District
- Monrovia Unified
- NCES district ID
- 0625320
- Math proficiency
- 39% ▼ -4.00%
- Reading proficiency
- 48% ▼ -10.00%
- Median HH income
- $69,032
- Composite
- 39.18/100
- National rank
- #4022
- State rank
- #182 of 517 in CA
Livability — Monrovia
- Score
- 52/100
- State rank
- #993
- US rank
- #24760
Category grades
Schools grade is shown separately in the Schools card above.
Census & demographics
- Census place
- Monrovia, CA
- County
- Los Angeles County · 9,444,647 people
- City population
- 41,140
- Metro
- Los Angeles-Long Beach-Anaheim, CA
- Population (ZIP)
- 41,140
- Household income
- $96,540
- Rent vs Own
- Severe rent burden
- 2134.0
Population outlook (Los Angeles County) Hauer SSP2
- Today (2025)
- 10,940,515 people
- By 2030
- 11,256,481 · +2.9%
- By 2040
- 11,729,929 · +7.2%
- By 2050
- 11,948,407 · +9.2%
- By 2075
- 11,818,114 · +8.0%
- By 2100
- 10,842,928 · -0.9%
Race, ethnicity, and origin ACS 2023
- Neighborhood character
- Diverse neighborhood (Simpson 0.70)
- Race & ethnicity
- Hispanic / Latino 43% White 30% Two or more races 21% Asian 16% Black 6%
- Hispanic origin (detail)
- Mexican 33% Puerto Rican 1%
- Common ancestry
- Italian 1% Slovak 1% Lithuanian 1%
- Foreign-born
- 24% · Canada, China, Vietnam
- Languages at home
- 58% English-only · Spanish 27% Chinese 7% Tagalog/Filipino 2%
Political lean MEDSL · Los Angeles
- 2024 margin
- Solid D (+32.9) · D 64.8% · R 31.9% · Other 3.3%
- 2008→2024 swing
- -7.4pp toward R · 2008: 40.4pp · 2024: 32.9pp
- All cycles
- 2024: D+32.9 2020: D+44.2 2016: D+48.0 2012: D+40.0 2008: D+40.4
Not yet ingested
- Civics
- —
Market trends
- HPI YoY
- ▼ -1140.27%
- Current HPI
- 390.9169
- Rent YoY
- ▲ 3.36%
- Metro
- Los Angeles-Long Beach-Anaheim, CA
- State GDP YoY
- ▲ 3.21%
- F500 in state
- 116
Industry mix (Fortune 500 HQ in CA)
| Industry | F500 HQs | Revenue |
|---|---|---|
| Technology | 27 | $1,492B |
|
||
| Financial Services | 3 | $174B |
|
||
| Retail | 3 | $44B |
|
||
| Insurance | 3 | $26B |
|
||
| Media / Entertainment | 2 | $115B |
|
||
| Pharmaceuticals / Biotech | 2 | $62B |
|
||
Price history
+420.4% since first listed7 events — show timeline
- 2026-06-16 Price Changed $255,000 FSBO.com
- 2026-05-12 Listed $265,000 FSBO.com
- 2013-07-11 Sold (MLS) $49,000 CRMLS
- 2013-04-18 Pending — CRMLS
- 2013-04-11 Listing Removed — CRMLS
- 2013-04-11 Listed $49,000 CRMLS
- 2013-04-10 Listed $49,000 CRMLS
Property tax history
+3.9%/yrLatest (2025): $83,713 · +2.0% YoY. Source: county tax records.
Cash-flow waterfall
monthlySold comps — $/sqft
last 12 mo · ≤1 miLoading sold comps…