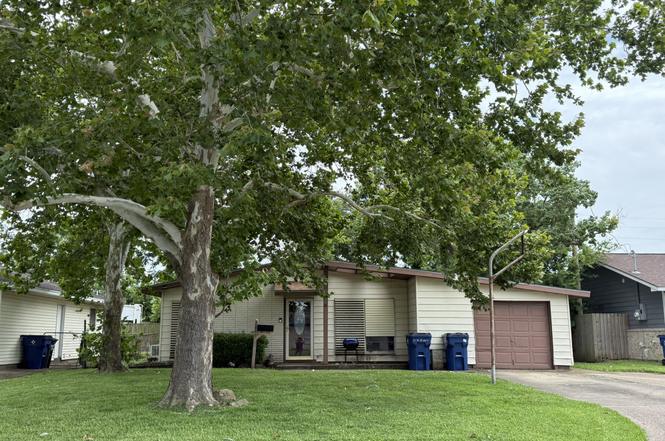
2213 17th Ave N · Texas City, TX
Flood risk 9/10 · Severe
- FEMA flood zone
- X
- Chance of flooding over 30 yrs
- 0.99%
- Est. flood insurance / yr
- $507 – $1,088
Fire risk 1/10 · Minimal
- Est. fire insurance / yr
- $1,222 – $2,270
Heat risk 10/10 · Severe
- Hot days now (above 108°F)
- 7 days/yr
- Hot days in 30 yrs
- 26 days/yr
Wind risk 9/10 · Severe
- Chance of severe wind over 30 yrs
- 99.0%
Air-quality risk 2/10 · Minimal
- Unhealthy air days now
- 2 days/yr
- Unhealthy air days in 30 yrs
- 2 days/yr
Risk factors via First Street. Map © Google.
Why this score? — see what drove the C+ grade
The composite is a weighted blend of 9 inputs, each scored 0–100. Each bar is that input's sub-score; the figure is the points it added to the 100-point composite (weight × sub-score).
- Cash flow +23.4/30.0
- ARV discount +15.0/15.0
- DSCR +7.5/10.0
- 1% rule +6.7/10.0
- Rent growth +3.7/5.0
- Livability +3.1/5.0
- Condition / age +2.5/5.0
- Schools +2.4/10.0
- Appreciation +0.0/10.0
$119,900
🖨 Deal sheet (PDF) 📄 Offer letter ✓ Due diligence
Listing remarks
Welcome to Texas City! This home is ideally situated on the north side of Palmer Highway, on a nice quiet street, walking distance from the local elementary school. Offering endless possibilities, it’s an excellent opportunity for a handyman or an investor seeking their next project. The property is being sold "AS IS" and priced accordingly, providing plenty of room to renovate and build equity. With a bit of TLC, this could become a smart investment—or the perfect place to call home!
Key facts
- 6,303 sq ft lot
- Garage
- Built 1970
Neighborhood map
What this means for you Summary
Snapshot
- This is a 3-bed/2.0-bath single-family listed at $120k.
Deal economics
- At list price, monthly cash flow is $155 ($2k/yr) — positive.
- The deal already cash-flows at list — no discount required.
- Meets the 1% rule at list price ($1k rent vs $120k).
- Recommended offer: $106k (12.0% below list) — sets the bar for market timing.
- Cap rate 8.5% vs local median 4.3% in Texas City — top-decile yield for the area; either an underpriced asset or a hidden risk that comps aren't pricing in. Stress-test before assuming the spread holds.
Location & tenants
- Location reads 62/100 on livability (#907 in TX) — a middle-class / working-renter tenant base. Strengths: cost of living A+, housing A+; Watch: crime D+, amenities F, commute F.
- Texas City ISD (suburban): math 28% / reading 29% proficiency, ranked #655 of 826 in TX (top 79%) — low school quality limits family demand, transient renter base, plan for 1-2y turnover; 66% free/reduced lunch — lower-income household profile, screen leases tightly.
- Zoned schools: Blocker Middle (math 33% / reading 36%, grade F, #858 of 1,662 statewide, top 54%, 865 students, 80% FRL); Texas City H S (math 32% / reading 36%, grade F, #1,002 of 1,632 statewide, top 62%, 1,718 students, 72% FRL).
- Market conditions: Rents rising fast (+4.9%/yr); 294 active listings in the ZIP; 27 comparable units currently listed for rent nearby; rentals at typical pace (median 22d on market — plan ~3-4 weeks tenant-placement turnaround); 3,258 units permitted in Galveston County in 2024 (0 in 5+ unit buildings).
Forward outlook
- Local home prices are declining (-3.0%/yr); year-one equity from $829 of loan paydown is wiped out by about $4k of value loss. Plan a longer hold.
- Galveston County population projected at +43% by 2050 — long-run rental-demand tailwind backs the buy-and-hold thesis.
Negotiation context
- It's been on market 166 days — a 12% lower offer ($106k) is reasonable based on typical stale-listing flexibility.
- 3 sale attempts; this cycle's ask has dropped $15k (11%) from the opening price — seller is motivated, your offer sets the floor, not the list.
Risks & watch-outs
- Watch-outs: flood insurance adds $66/mo.
- Climate carrying-cost: severe flood risk; severe wind risk, 99% chance of damaging wind over 30y; extreme-heat days projected 7→26/yr by 2055 (HVAC capex compounding) — expect insurance premiums to compound above CPI over the hold.
Questions for the listing agent
- It's been on market 166 days. Have you received any prior offers? Is the seller open to a 12% concession, seller financing, or rate buy-down credit?
- Built in 1970 — when were the roof, HVAC, electrical panel, plumbing, and water heater last replaced?
- What's the actual annual flood-insurance premium (NFIP or private), and is the property in a SFHA with mandatory coverage?
- Why hasn't it sold? Are there any deal-killer items the seller is aware of (foundation, flood, title, zoning, code violations)?
- Is there a deadline driving the sale (1031 exchange, divorce, estate, relocation)? That informs how much negotiation room exists.
- Schools are F-rated, which usually means shorter tenancies and higher turnover. Who's the typical renter profile here, and what's been the actual vacancy rate?
- Crime grade is D in this area — have there been break-ins, vandalism, or insurance claims at this property in the last 3 years? What carrier currently insures it and at what premium?
- What's the average days-on-market for RENTAL listings here right now (not sales)? A rising rental-DOM trend means longer vacancies and softer asking-rent achievability than the comps imply.
- What's the recent tenant-quality profile in this submarket — average credit score on applications, eviction rate, late-payment / NSF rate, and stable-employment percentage? A property-management company in the area should have these aggregated.
- How much new for-sale + rental construction is in the pipeline within 1–3 miles? Heavy new supply typically softens prices + rents 12–24 months out; constrained supply supports both.
Investment metrics
- 1% rule
- 1.17% ✓
- Cap rate
- 8.51%
- Cash-on-cash
- 7.92%
- DSCR
- 1.35
- GRM
- 7.1
CMA / ARV
- ARV (on-the-fly)
- $161,868
- Comps found
- 12
Show comp detail 12 sales within ~0.75 mi
| Address | Dist | Beds/Ba | Sqft | Sold | Price | $/sf | Match |
|---|---|---|---|---|---|---|---|
| 2206 18th Ave N | 0.09mi | 3/1.0 | 1,162 (+1%) | 0mo | $115,000 | $99 | 90 |
| 1513 21st St N | 0.14mi | 3/1.5 | 1,152 (+0%) | 6mo | $175,000 | $152 | 86 |
| 2310 21st Ave N | 0.27mi | 3/2.0 | 1,236 (+8%) | 10mo | $145,000 | $117 | 66 |
| 2410 21st Ave N | 0.30mi | 4/2.0 (+1) | 1,288 (+12%) | 2mo | $160,000 | $124 | 59 |
| 2418 28th Ave N | 0.68mi | 2/1.5 (-1) | 1,134 (-1%) | 2mo | $75,000 | $66 | 58 |
| 2312 6th Ave N | 0.71mi | 3/1.0 | 1,100 (-4%) | 1mo | $165,000 | $150 | 55 |
| 2613 7th Ave N | 0.75mi | 3/1.5 | 1,100 (-4%) | 1mo | $155,000 | $141 | 55 |
| 2909 N 14th Avenue Ave N | 0.70mi | 3/2.0 | 1,104 (-4%) | 7mo | $155,000 | $140 | 55 |
| 2909 15th Ave N | 0.69mi | 3/2.0 | 1,104 (-4%) | 10mo | $195,000 | $177 | 53 |
| 2604 27th Ave N | 0.68mi | 3/2.0 | 1,261 (+10%) | 2mo | $210,000 | $167 | 50 |
| 1521 15th Ave N | 0.60mi | 2/1.0 (-1) | 1,036 (-10%) | 6mo | $105,000 | $101 | 42 |
| 2320 29th Ave N | 0.70mi | 3/1.0 | 991 (-14%) | 1mo | $154,900 | $156 | 40 |
Match score weights: distance 35% · size 25% · config 20% · recency 20%. Top-matched comps best support the ARV.
Projected returns pro-forma
-3.0% appreciation · 4.91% rent growth · sell at horizon
- IRR
- -5.2%
- Equity multiple
- 0.80×
- Total profit
- $-6,686
- Equity at exit
- $17,877
- IRR
- 6.9%
- Equity multiple
- 1.57×
- Total profit
- $19,070
- Equity at exit
- $10,367
Cash invested: $33,572 (down + closing). Projections, not guarantees.
Landlord ↔ Tenant lean methodology
- Overall (STATE)
- 87 Strongly Landlord-Friendly
- State Texas
- 87 Strongly Landlord-Friendly · R+5
- County
- — inherits STATE
- City
- — inherits STATE
ZIP-level market 77590
- Home prices YoY
- -19.3%
- Rents YoY
- 4.9%
- Active inventory
- 294
- Price-to-rent
- 7.1×
Monthly cashflow live
- Estimated rent
- $1,407 high interval (Pro) →
- Mortgage (P&I)
- −$629
- Tax from tax record
- −$211 /mo · $2,531/yr
- Insurance
- −$50
- Flood insurance flood zone
- −$66 /mo · $798/yr
- HOA
- −$0
- Vacancy / Maint / Mgmt
- −$295
- Net cashflow
- $155
Break-even live
Sensitivity live
| Price | -10% $223 | -5% $189 | +0% $155 | +5% $121 | +10% $87 |
|---|---|---|---|---|---|
| Rent | -10% $44 | -5% $100 | +0% $155 | +5% $211 | +10% $266 |
| Rate | -1.0pp $216 | -0.5pp $186 | base $155 | +0.5pp $124 | +1.0pp $93 |
UW: 25.0% down · 7.5% · 30yr · 1.5% tax · 5.0% vac · 8.0% maint · 8.0% mgmt
Financing live
Cash to close
- Down payment
- $29,975
- Closing costs
- $3,597
- Reserves months
- —
- Total cash needed
- —
Loan-product check · same deal, 3 products live
Conventional
25% down · 7.5% · 30yr
- Down + closing
- —
- Monthly P&I
- —
- Monthly cashflow
- —
- DSCR
- —
- Eligible?
- —
Personal DTI + credit; lowest rate.
DSCR
20% down · 8.5% · 30yr
- Down + closing
- —
- Monthly P&I
- —
- Monthly cashflow
- —
- DSCR
- —
- Eligible?
- —
No personal income docs; deal must DSCR.
Hard money
10% down · 12.0% · 12mo
- Down + closing
- —
- Monthly P&I
- —
- Monthly cashflow
- —
- DSCR
- —
- Eligible?
- —
Short-term bridge; refi at stabilization.
Rent comps 27 comps
| Address | Beds | Baths | Sqft | Rent | $/sqft | DOM | Units | Dist |
|---|---|---|---|---|---|---|---|---|
| 2202 16th Ave N Texas City, TX | 2.0 | 1.5 | 860 | $975 | $1.13 | 12d | 4 | 0.05mi |
| 2418 14th Ave N Texas City, TX | 3.0 | 2.0 | 1488 | $1,775 | $1.19 | 4d | 1 | 0.25mi |
| 1231 23rd St N Texas City, TX | 4.0 | 2.0 | 1330 | $1,500 | $1.13 | 0d | 1 | 0.28mi |
| 1919 13th Ave N Texas City, TX | 1.0–3.0 | 1.0–2.0 | 950 | $1,499 | $1.58 | 0d | 4 | 0.38mi |
| 2701 13th Ave N Unit C-C3 Texas City, TX | 2.0 | 1.0 | 811 | $1,189 | $1.47 | 22d | 1 | 0.56mi |
| 2701 13th Ave N Unit C-C12 Texas City, TX | 2.0 | 1.0 | 811 | $1,222 | $1.51 | 22d | 1 | 0.56mi |
| 2701 13th Ave N Unit H-H3 Texas City, TX | 2.0 | 1.0 | 811 | $1,250 | $1.54 | 22d | 1 | 0.56mi |
| 2701 13th Ave N Unit K-K3 Texas City, TX | 2.0 | 1.0 | 811 | $1,099 | $1.36 | 22d | 1 | 0.56mi |
| 2701 13th Ave N Unit E-E6 Texas City, TX | 2.0 | 1.0 | 811 | $1,137 | $1.40 | 22d | 1 | 0.56mi |
| 2701 13th Ave N Unit B-B6 Texas City, TX | 2.0 | 1.0 | 811 | $1,239 | $1.53 | 4d | 1 | 0.56mi |
| 2701 13th Ave N Unit J-J3 Texas City, TX | 2.0 | 1.0 | 811 | $1,287 | $1.59 | 21d | 1 | 0.56mi |
| 2707 13th Ave N Texas City, TX | 2.0 | 1.0 | 811 | $1,257 | $1.55 | 45d | 1 | 0.57mi |
| 2608 21st St N Texas City, TX | 3.0 | 2.0 | 974 | $1,400 | $1.44 | 45d | 1 | 0.64mi |
| 2602 21st St N Texas City, TX | 1.0–3.0 | 1.0–2.0 | 768 | $1,450 | $1.89 | 0d | 44 | 0.71mi |
| 2714 5th Ave N Texas City, TX | 3.0 | 2.0 | 1382 | $1,800 | $1.30 | 45d | 1 | 0.91mi |
| 2526 3rd 1/2 Ave N Texas City, TX | 3.0 | 2.0 | 1240 | $1,550 | $1.25 | 25d | 1 | 0.91mi |
| 2622 34th Ave N Texas City, TX | 3.0 | 1.0 | 1476 | $1,725 | $1.17 | 45d | 1 | 1.02mi |
| 1116 11th St N Texas City, TX | 2.0 | 1.0 | 1075 | $1,129 | $1.05 | 45d | 1 | 1.09mi |
| 3106 Danforth Dr Texas City, TX | 3.0 | 1.0 | 1100 | $1,800 | $1.64 | 25d | 1 | 1.11mi |
| 1228 6th Ave N Unit 1 Texas City, TX | 2.0 | 1.0 | 847 | $945 | $1.12 | 14d | 1 | 1.13mi |
| 1001 9th Ave N Texas City, TX | 2.0 | 1.0 | 814 | $1,250 | $1.54 | 45d | 1 | 1.28mi |
| 1028 5th Ave N Unit 1 Texas City, TX | 2.0 | 1.0 | 847 | $945 | $1.12 | 14d | 1 | 1.31mi |
| 701 22nd Ave N Texas City, TX | 3.0 | 2.0 | 1011 | $1,386 | $1.37 | 45d | 1 | 1.37mi |
| 3404 9th Ave N Texas City, TX | 1.0–2.0 | 1.0–2.0 | 721 | $1,525 | $2.11 | 0d | 30 | 1.40mi |
| 1112 1st Ave N Texas City, TX | 2.0 | 1.0 | 847 | $945 | $1.12 | 23d | 1 | 1.44mi |
| 1114 1st Ave N Texas City, TX | 2.0 | 1.0 | 847 | $945 | $1.12 | 23d | 1 | 1.44mi |
| 3507 25th Ave N Texas City, TX | 2.0 | 2.0 | 855 | $1,045 | $1.22 | 45d | 1 | 1.44mi |
Listing history 12 events
-
2026-05-06status Pending
-
2026-04-25status Pending
-
2026-04-14status Active
-
2026-04-09status Pending
-
2026-03-28status Pending
-
2026-03-13price $119,900
-
2025-12-13price $129,000
-
2025-11-15$135,000 Active
-
2025-11-14historical
-
2025-11-05price $135,000
-
2025-07-13$137,000 Active
-
2016-03-08soldstatus
ⓘ Source: listings_history table (triggers on properties + properties_extension) + one-shot
backfill from property_details.listing_events for pre-trigger history.
Tax reassessment forecast TX · Resets to sale price
- Current annual tax
- $2,531 · $211/mo
- Projected year-2 tax
- $2,531 · $211/mo
- Expected delta
- $0/yr ($0/mo · 0.0%)
ⓘ Screening estimate from a state-policy table — verify with the county assessor before closing.
Climate risk First Street
- Flood 9/10 Extreme FEMA zone X · 99% chance over 30 yrs
- Wildfire 1/10 Low
- Heat 10/10 Extreme 7 d/yr ≥108°F today · 26 d/yr by 30 yrs out
- Wind 9/10 Extreme 99% chance of damaging wind over 30 yrs
- Air quality 2/10 Low 2 unhealthy d/yr today · 2 by 30 yrs out
Nearby sold comps map
Loading sold comps map…
Walkable amenities ~0.75 mi
Loading nearby amenities…
Taxation est. · year 1
- Rental income
- $16,882
- − Mortgage interest
- −$6,716
- − Property taxes
- −$2,531
- − Insurance
- −$1,397
- − Repairs & maintenance
- −$1,351
- − Management
- −$1,351
- − Depreciation
- −$3,488
- Taxable income
- $48
- Est. tax owed @ 24.0%
- −$12
- After-tax cash flow
- $1,851/yr
For passive investors: Depreciation is non-cash, so a rental often shows a tax loss while cash-flowing — sheltering income. Rental losses are passive: they offset passive income freely, and up to $25,000/yr can offset ordinary (W-2) income if you actively participate and your MAGI is under $100k (phasing out to $0 by $150k); unused losses carry forward. On sale, claimed depreciation is recaptured at up to 25%, and gains may owe capital-gains tax (a 1031 exchange can defer both). Figures are a year-1 estimate at your 24.0% rate — not tax advice; consult a CPA.
Schools (NCES district)
- District
- Texas City ISD
- NCES district ID
- 4842510
- Math proficiency
- 28% ▼ -10.00%
- Reading proficiency
- 29% ▼ -4.00%
- Median HH income
- $44,875
- Composite
- 24.47/100
- National rank
- #7664
- State rank
- #655 of 826 in TX
Livability — Texas City
- Score
- 62/100
- State rank
- #907
- US rank
- #16268
Category grades
Schools grade is shown separately in the Schools card above.
Census & demographics
- Census place
- Texas City, TX
- County
- Galveston County · 357,330 people
- City population
- 49,936
- Metro
- Houston-The Woodlands-Sugar Land, TX
- Population (ZIP)
- 31,642
- Household income
- $65,801
- Rent vs Own
- Severe rent burden
- 1821.0
Population outlook (Galveston County) Hauer SSP2
- Today (2025)
- 390,640 people
- By 2030
- 425,226 · +8.9%
- By 2040
- 493,765 · +26.4%
- By 2050
- 559,698 · +43.3%
- By 2075
- 719,260 · +84.1%
- By 2100
- 819,628 · +109.8%
Race, ethnicity, and origin ACS 2023
- Neighborhood character
- Diverse neighborhood (Simpson 0.66)
- Race & ethnicity
- White 41% Hispanic / Latino 38% Two or more races 20% Black 17% Asian 2%
- Hispanic origin (detail)
- Mexican 33% Puerto Rican 1%
- Common ancestry
- Lithuanian 2% Slovak 1% Italian 1%
- Foreign-born
- 9% · Canada, Vietnam
- Languages at home
- 72% English-only · Spanish 26% Other Indo-European 1%
Political lean MEDSL · Galveston
- 2024 margin
- Strong R (+27.4) · D 35.7% · R 63.1% · Other 1.2%
- 2008→2024 swing
- -7.9pp toward R · 2008: -19.5pp · 2024: -27.4pp
- All cycles
- 2024: R+27.4 2020: R+22.6 2016: R+22.6 2012: R+26.9 2008: R+19.5
Not yet ingested
- Civics
- —
Market trends
- HPI YoY
- ▼ -58.35%
- Current HPI
- 244.5809
- Rent YoY
- ▲ 4.91%
- Metro
- Houston-The Woodlands-Sugar Land, TX
- State GDP YoY
- ▲ 3.95%
- F500 in state
- 110
Industry mix (Fortune 500 HQ in TX)
| Industry | F500 HQs | Revenue |
|---|---|---|
| Energy | 16 | $1,198B |
|
||
| Technology | 5 | $198B |
|
||
| Engineering / Construction | 4 | $72B |
|
||
| Energy Services | 3 | $60B |
|
||
| Utilities | 3 | $41B |
|
||
| Healthcare | 2 | $330B |
|
||
Price history
-12.5% since first listed12 events — show timeline
- 2026-05-06 Pending — HARMLS
- 2026-04-25 Pending — HARMLS
- 2026-04-14 Relisted — HARMLS
- 2026-04-09 Pending — HARMLS
- 2026-03-28 Pending — HARMLS
- 2026-03-13 Price Changed $119,900 HARMLS
- 2025-12-13 Price Changed $129,000 HARMLS
- 2025-11-15 Listed $135,000 HARMLS
- 2025-11-14 Listing Removed — HARMLS
- 2025-11-05 Price Changed $135,000 HARMLS
- 2025-07-13 Listed $137,000 HARMLS
- 2016-03-08 Sold (Public Records) — Public Records
Property tax history
+3.1%/yrLatest (2025): $2,531 · +11.6% YoY. Source: county tax records.
Cash-flow waterfall
monthlySold comps — $/sqft
last 12 mo · ≤1 miLoading sold comps…