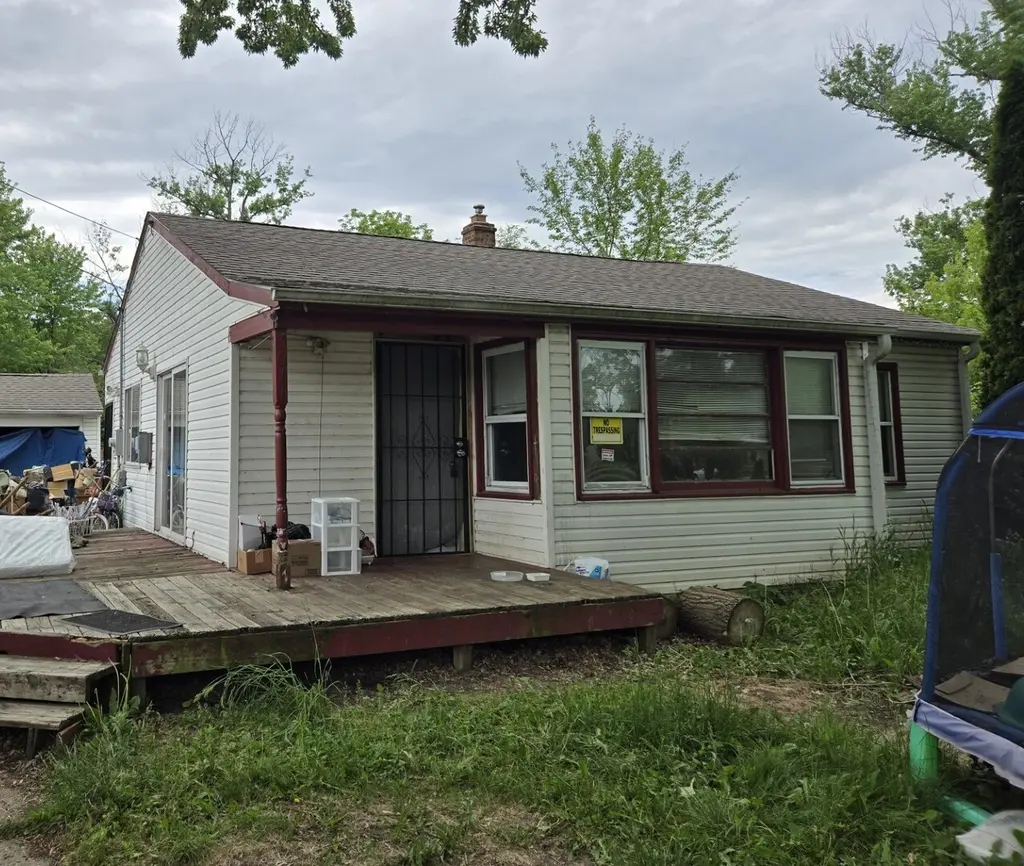
3611 Algonquin Blvd · Rockford, IL
Flood risk 3/10 · Minor
- FEMA flood zone
- X (unshaded)
- Chance of flooding over 30 yrs
- 0.2%
- Est. flood insurance / yr
- $473 – $860
Fire risk 1/10 · Minimal
- Est. fire insurance / yr
- $804 – $1,492
Heat risk 2/10 · Minimal
- Hot days now (above 101°F)
- 7 days/yr
- Hot days in 30 yrs
- 15 days/yr
Wind risk 2/10 · Minimal
- Chance of severe wind over 30 yrs
- —
Air-quality risk 2/10 · Minimal
- Unhealthy air days now
- 1 days/yr
- Unhealthy air days in 30 yrs
- 2 days/yr
Risk factors via First Street. Map © Google.
Why this score? — see what drove the D grade
The composite is a weighted blend of 9 inputs, each scored 0–100. Each bar is that input's sub-score; the figure is the points it added to the 100-point composite (weight × sub-score).
- Cash flow +14.8/30.0
- ARV discount +11.2/15.0
- DSCR +4.5/10.0
- 1% rule +4.2/10.0
- Livability +3.1/5.0
- Rent growth +2.5/5.0
- Condition / age +2.5/5.0
- Schools +1.2/10.0
- Appreciation +0.0/10.0
$120,000
🖨 Deal sheet (PDF) 📄 Offer letter ✓ Due diligence
Listing remarks
This solid ranch could be a great starter or investment but needs a lot of work. The home sits far back from the road on a larger than average sized lot. The small neighborhood feels like country living but is within a few miles of the river walk and downtown area. The home has hardwoods throughout. Living room with lots of light and a small dining area with sliders to the deck. Roof about 6 years old. Newer water heater. Feel free to inspect but being sold as is. No FHA/VA.
Key facts
- Sliders to the deck
- Newer water heater
- Hardwoods throughout
Tags
Property features AI
Finance
- HOA & community: No master association fee required
Exterior
- Parking: Detached garage with gravel driveway (2 garage/2 total parking spaces)
- Utilities: Well water supply; Public sewer service
- Home design: Detached single-family home; One-story; Fee simple ownership; Built 71–80 years ago; Vinyl siding
- Construction: Vinyl siding exterior; Unfinished full basement; Approximately 948 finished living area
- Exterior features: Lot approximately .25-.49 acre (dimensions approx. 80 x 192); Well water; Public sewer
Interior
- Kitchen: Kitchen on main level (approx. 10 x 11)
- Bedrooms: Two bedrooms (master bedroom on main level, second bedroom on main level)
- Bathrooms: One full bathroom
- Heating & cooling: Natural gas forced-air heating
- Interior features: Five total rooms; Full, unfinished basement
- Laundry & utility: Dedicated laundry room
Neighborhood map
What this means for you Summary
Snapshot
- This is a 2-bed/1.0-bath single-family listed at $120k.
Deal economics
- At list price, monthly cash flow is $34 ($403/yr) — positive.
- The deal already cash-flows at list — no discount required.
- To meet the 1% rule (rent ≥ 1% of price), the offer needs to be $110k (8.3% below list).
- Recommended offer: $110k (8.3% below list) — sets the bar for 1% rule.
Location & tenants
- Location reads 62/100 on livability (#876 in IL) — a middle-class / working-renter tenant base. Strengths: cost of living A+, housing A+, health & safety A+; Watch: schools F, crime F, amenities F.
- Rockford SD 205 (urban): math 12% / reading 16% proficiency, ranked #533 of 620 in IL (top 86%) — low school quality limits family demand, transient renter base, plan for 1-2y turnover; 73% free/reduced lunch — lower-income household profile, screen leases tightly.
- Market conditions: 69 active listings in the ZIP; 2 comparable units currently listed for rent nearby; 285 units permitted in Winnebago County in 2024 (0 in 5+ unit buildings).
Forward outlook
- Local home prices are declining (-3.0%/yr); year-one equity from $830 of loan paydown is wiped out by about $4k of value loss. Plan a longer hold.
- Winnebago County population projected at -20% by 2050 — secular population decline; favor cash flow + early exit over multi-decade hold.
Negotiation context
- It's been on market 24 days — a 2% lower offer ($118k) is reasonable based on typical stale-listing flexibility.
- Current owner paid $48k; list at $120k implies a 150% gain — meaningful room to come down on a strong offer.
Risks & watch-outs
- Watch-outs: built in 1952 — expect roof / HVAC / electrical / plumbing capex.
Questions for the listing agent
- Built in 1952 — when were the roof, HVAC, electrical panel, plumbing, and water heater last replaced?
- Is there a deadline driving the sale (1031 exchange, divorce, estate, relocation)? That informs how much negotiation room exists.
- Schools are F-rated, which usually means shorter tenancies and higher turnover. Who's the typical renter profile here, and what's been the actual vacancy rate?
- Crime grade is F in this area — have there been break-ins, vandalism, or insurance claims at this property in the last 3 years? What carrier currently insures it and at what premium?
- The area grade is low — what's the realistic commute time and amenity access for the typical tenant pool here? Any planned neighborhood developments (good or bad) we should know about?
- What's the average days-on-market for RENTAL listings here right now (not sales)? A rising rental-DOM trend means longer vacancies and softer asking-rent achievability than the comps imply.
- What's the recent tenant-quality profile in this submarket — average credit score on applications, eviction rate, late-payment / NSF rate, and stable-employment percentage? A property-management company in the area should have these aggregated.
- How much new for-sale + rental construction is in the pipeline within 1–3 miles? Heavy new supply typically softens prices + rents 12–24 months out; constrained supply supports both.
Investment metrics
- 1% rule
- 0.92% ✗
- Cap rate
- 6.63%
- Cash-on-cash
- 1.20%
- DSCR
- 1.05
- GRM
- 9.1
CMA / ARV
- ARV (on-the-fly)
- $130,824
- Comps found
- 8
Show comp detail 8 sales within ~0.75 mi
| Address | Dist | Beds/Ba | Sqft | Sold | Price | $/sf | Match |
|---|---|---|---|---|---|---|---|
| 412 Brooke Rd | 0.65mi | 2/1.0 | 973 (+3%) | 11mo | $95,000 | $98 | 56 |
| 213 Seneca Ave | 0.05mi | 2/1.0 | 1,070 (+13%) | 24mo | $147,500 | $138 | 56 |
| 1207 Prairie Rd | 0.70mi | 2/1.0 | 993 (+5%) | 9mo | $189,000 | $190 | 52 |
| 321 Sawyer Rd | 0.62mi | 2/2.0 | 977 (+3%) | 23mo | $135,000 | $138 | 43 |
| 411 Fitch Rd | 0.65mi | 3/1.5 (+1) | 1,013 (+7%) | 19mo | $86,000 | $85 | 36 |
| 409 Barnum Rd | 0.66mi | 2/1.0 | 816 (-14%) | 18mo | $65,000 | $80 | 31 |
| 809 Iroquois Ave | 0.60mi | 3/1.0 (+1) | 1,080 (+14%) | 19mo | $150,000 | $139 | 28 |
| 902 Iroquois Ave | 0.66mi | 3/2.0 (+1) | 1,080 (+14%) | 22mo | $170,000 | $157 | 19 |
Match score weights: distance 35% · size 25% · config 20% · recency 20%. Top-matched comps best support the ARV.
Projected returns pro-forma
-3.0% appreciation · 3.0% rent growth · sell at horizon
- IRR
- -14.4%
- Equity multiple
- 0.49×
- Total profit
- $-17,283
- Equity at exit
- $17,892
- IRR
- -5.6%
- Equity multiple
- 0.64×
- Total profit
- $-12,209
- Equity at exit
- $10,375
Cash invested: $33,600 (down + closing). Projections, not guarantees.
Landlord ↔ Tenant lean methodology
- Overall (STATE)
- 43 Moderately Tenant-Leaning
- State Illinois
- 43 Moderately Tenant-Leaning · D+7
- County
- — inherits STATE
- City
- — inherits STATE
ZIP-level market 61102
- Home prices YoY
- -33.1%
- Active inventory
- 69
- Price-to-rent
- 9.1×
Monthly cashflow live
- Estimated rent
- $1,100 medium interval (Pro) →
- Mortgage (P&I)
- −$629
- Tax from tax record
- −$156 /mo · $1,876/yr
- Insurance
- −$50
- HOA
- −$0
- Vacancy / Maint / Mgmt
- −$231
- Net cashflow
- $34
Break-even live
Sensitivity live
| Price | -10% $102 | -5% $68 | +0% $34 | +5% $0 | +10% $-34 |
|---|---|---|---|---|---|
| Rent | -10% $-53 | -5% $-10 | +0% $34 | +5% $77 | +10% $121 |
| Rate | -1.0pp $94 | -0.5pp $64 | base $34 | +0.5pp $3 | +1.0pp $-29 |
UW: 25.0% down · 7.5% · 30yr · 1.5% tax · 5.0% vac · 8.0% maint · 8.0% mgmt
Financing live
Cash to close
- Down payment
- $30,000
- Closing costs
- $3,600
- Reserves months
- —
- Total cash needed
- —
Loan-product check · same deal, 3 products live
Conventional
25% down · 7.5% · 30yr
- Down + closing
- —
- Monthly P&I
- —
- Monthly cashflow
- —
- DSCR
- —
- Eligible?
- —
Personal DTI + credit; lowest rate.
DSCR
20% down · 8.5% · 30yr
- Down + closing
- —
- Monthly P&I
- —
- Monthly cashflow
- —
- DSCR
- —
- Eligible?
- —
No personal income docs; deal must DSCR.
Hard money
10% down · 12.0% · 12mo
- Down + closing
- —
- Monthly P&I
- —
- Monthly cashflow
- —
- DSCR
- —
- Eligible?
- —
Short-term bridge; refi at stabilization.
Rent comps 2 comps
| Address | Beds | Baths | Sqft | Rent | $/sqft | DOM | Units | Dist |
|---|---|---|---|---|---|---|---|---|
| 2208 Christina St Rockford, IL | 2.0 | 1.0 | 700 | $1,300 | $1.86 | 21d | 1 | 1.02mi |
| 2010 Kishwaukee St Unit 20102-N Rockford, IL | 1.0 | 1.0 | 1000 | $875 | $0.88 | 44d | 1 | 1.47mi |
Listing history 21 events
-
2026-06-19days on market $120,000 Active 24 DOM
-
2026-06-18days on market $120,000 Active 23 DOM
-
2026-06-17price $120,000 Active 22 DOM
-
2026-06-17days on market $125,000 Active 22 DOM
-
2026-06-16days on market $125,000 Active 21 DOM
-
2026-06-15days on market $125,000 Active 20 DOM
-
2026-06-14days on market $125,000 Active 18 DOM
-
2026-06-13days on market $125,000 Active 17 DOM
-
2026-06-10days on market $125,000 Active 15 DOM
-
2026-06-09days on market $125,000 Active 14 DOM
-
2026-06-08days on market $125,000 Active 13 DOM
-
2026-06-07days on market $125,000 Active 12 DOM
-
2026-06-03days on market $125,000 Active 8 DOM
-
2026-06-02days on market $125,000 Active 7 DOM
-
2026-06-01days on market $125,000 Active 6 DOM
-
2026-05-31days on market $125,000 Active 5 DOM
-
2026-05-30days on market $125,000 Active 4 DOM
-
2026-05-26$125,000 Active
-
1995-08-03soldstatus $48,000
-
1995-08-03soldstatus $48,000
-
1989-07-31soldstatus $23,330
ⓘ Source: listings_history table (triggers on properties + properties_extension) + one-shot
backfill from property_details.listing_events for pre-trigger history.
Tax reassessment forecast IL · Partial reset (capped growth)
- Current annual tax
- $1,876 · $156/mo
- Projected year-2 tax
- $2,300 · $192/mo
- Expected delta
- +$424/yr (+$35/mo · 22.6%)
ⓘ Screening estimate from a state-policy table — verify with the county assessor before closing.
Climate risk First Street
- Flood 3/10 Moderate FEMA zone X (unshaded) · 20% chance over 30 yrs
- Wildfire 1/10 Low
- Heat 2/10 Low 7 d/yr ≥101°F today · 15 d/yr by 30 yrs out
- Wind 2/10 Low
- Air quality 2/10 Low 1 unhealthy d/yr today · 2 by 30 yrs out
Nearby sold comps map
Loading sold comps map…
Walkable amenities ~0.75 mi
Loading nearby amenities…
Taxation est. · year 1
- Rental income
- $13,204
- − Mortgage interest
- −$6,722
- − Property taxes
- −$1,876
- − Insurance
- −$600
- − Repairs & maintenance
- −$1,056
- − Management
- −$1,056
- − Depreciation
- −$3,491
- Taxable loss
- −$1,598
- Est. tax savings @ 24.0%
- +$383
- After-tax cash flow
- $787/yr
For passive investors: Depreciation is non-cash, so a rental often shows a tax loss while cash-flowing — sheltering income. Rental losses are passive: they offset passive income freely, and up to $25,000/yr can offset ordinary (W-2) income if you actively participate and your MAGI is under $100k (phasing out to $0 by $150k); unused losses carry forward. On sale, claimed depreciation is recaptured at up to 25%, and gains may owe capital-gains tax (a 1031 exchange can defer both). Figures are a year-1 estimate at your 24.0% rate — not tax advice; consult a CPA.
Schools (NCES district)
- District
- Rockford SD 205
- NCES district ID
- 1734510
- Math proficiency
- 12% ▼ -2.00%
- Reading proficiency
- 16% ▼ -3.00%
- Median HH income
- $42,533
- Composite
- 12.21/100
- National rank
- #9649
- State rank
- #533 of 620 in IL
Livability — Rockford
- Score
- 62/100
- State rank
- #876
- US rank
- #17035
Category grades
Schools grade is shown separately in the Schools card above.
Census & demographics
- City population
- 147,297
- Population (ZIP)
- 16,620
Population outlook (Winnebago County) Hauer SSP2
- Today (2025)
- 271,080 people
- By 2030
- 260,684 · -3.8%
- By 2040
- 238,405 · -12.1%
- By 2050
- 216,129 · -20.3%
- By 2075
- 172,882 · -36.2%
- By 2100
- 135,336 · -50.1%
Race, ethnicity, and origin ACS 2023
- Neighborhood character
- Highly diverse neighborhood (Simpson 0.70)
- Race & ethnicity
- White 36% Black 33% Hispanic / Latino 25% Two or more races 15%
- Hispanic origin (detail)
- Mexican 23%
- Common ancestry
- Portuguese 2% Iranian 1% Romanian 1%
- Foreign-born
- 9% · Canada
- Languages at home
- 81% English-only · Spanish 18%
Political lean MEDSL · Winnebago
- 2024 margin
- Toss-up / Even · D 49.5% · R 49.0% · Other 1.5%
- 2008→2024 swing
- -12.2pp toward R · 2008: 12.8pp · 2024: 0.6pp
- All cycles
- 2024: D+0.6 2020: D+2.5 2016: R+1.2 2012: D+5.7 2008: D+12.8
Not yet ingested
- Civics
- —
Market trends
- HPI YoY
- ▼ -93.81%
- Current HPI
- 189.9634
- Rent YoY
- —
- Metro
- —
- State GDP YoY
- ▲ 1.59%
- F500 in state
- 60
Industry mix (Fortune 500 HQ in IL)
| Industry | F500 HQs | Revenue |
|---|---|---|
| Insurance | 4 | $201B |
|
||
| Consumer Goods | 4 | $87B |
|
||
| Industrial Machinery | 3 | $64B |
|
||
| Healthcare | 2 | $55B |
|
||
| Retail / Pharmacy | 1 | $148B |
|
||
| Agriculture / Food | 1 | $86B |
|
||
Price history
+435.8% since first listed4 events — show timeline
- 2026-05-26 Listed $125,000 MRED as Distributed by MLS Grid
- 1995-08-03 Sold (Public Records) $48,000 Public Records
- 1995-08-03 Sold (Public Records) $48,000 Public Records
- 1989-07-31 Sold (Public Records) $23,330 Public Records
Property tax history
+0.9%/yrLatest (2024): $1,876 · +8.1% YoY. Source: county tax records.
Cash-flow waterfall
monthlySold comps — $/sqft
last 12 mo · ≤1 miLoading sold comps…