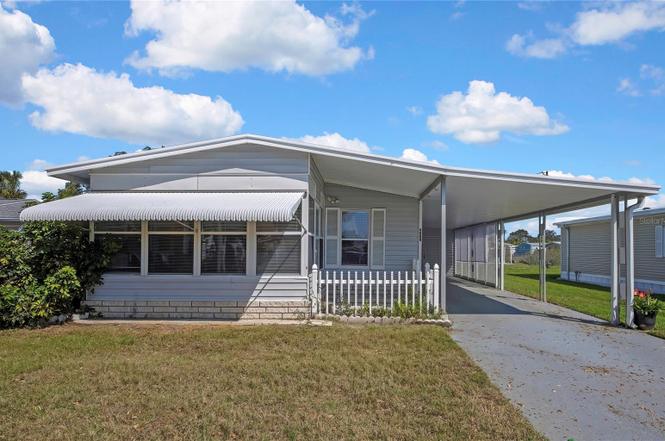
4809 Empress Ln · Elfers, FL
Flood risk 5/10 · Moderate
- FEMA flood zone
- X (shaded)
- Chance of flooding over 30 yrs
- 0.24%
- Est. flood insurance / yr
- $507 – $1,088
Fire risk 3/10 · Minor
- Est. fire insurance / yr
- $947 – $1,759
Heat risk 10/10 · Severe
- Hot days now (above 109°F)
- 7 days/yr
- Hot days in 30 yrs
- 27 days/yr
Wind risk 10/10 · Severe
- Chance of severe wind over 30 yrs
- 99.0%
Air-quality risk 2/10 · Minimal
- Unhealthy air days now
- 1 days/yr
- Unhealthy air days in 30 yrs
- 1 days/yr
Risk factors via First Street. Map © Google.
Why this score? — see what drove the C grade
The composite is a weighted blend of 9 inputs, each scored 0–100. Each bar is that input's sub-score; the figure is the points it added to the 100-point composite (weight × sub-score).
- Cash flow +23.9/30.0
- DSCR +7.7/10.0
- ARV discount +6.9/15.0
- 1% rule +6.3/10.0
- Schools +4.3/10.0
- Livability +3.9/5.0
- Condition / age +2.5/5.0
- Rent growth +1.9/5.0
- Appreciation +0.0/10.0
$142,900
🖨 Deal sheet (PDF) 📄 Offer letter ✓ Due diligence
Listing remarks
Stop and check out this well-maintained home in a very active 55+ community. Home is furnished with 2 bedrooms, 2 bathrooms, finished Florida room with separate a/c. Central heat and air-conditioning NEW in 2022, NEW Refrigerator, NEW dryer, enclosed and screen lanai. Windows have been replaced; seller is not sure of year of replacement. Low monthly maintenance fee of $143.00 includes lawn service, garbage removal, maintenance of year-around-heated pool, Clubhouse, Shuffleboard and the common areas. You OWN YOUR LAND. Measurements are approx. Buyer to verify all information that is deemed to be accurate.
Key facts
- Clubhouse
- New refrigerator
- New dryer
Tags
Property features AI
Finance
- Other: Property type: Residential manufactured home; Zoning: RMH
- Financial info: Total annual fees $1,716
- HOA & community: Homeowners association managed by Qualified Property Management; Monthly HOA fee of $143 (includes common area taxes, escrow reserves, management, pool, private road, recreational facilities, trash); Association amenities: clubhouse, pool, recreation facilities, shuffleboard court, wheelchair access, deed restrictions, fence restrictions, vehicle restrictions, special community restrictions, street lights, sidewalks; Buyer approval required; Senior community; No truck/RV/motorcycle parking; Golf carts allowed; Pets allowed with breed restrictions (cats and dogs OK, max pet weight 25 lbs)
Exterior
- Parking: Driveway; Ground-level parking pad; Tandem parking; 2-space carport
- Security: Lobby key required
- Utilities: Public water; Public sewer; Electricity connected; Water connected; Sewer connected; Cable connected; Underground utilities
- Home design: Manufactured home (double wide); One story; Faces south; Completed condition; Entry on crawlspace foundation
- Construction: Vinyl siding; Other roof type; Crawlspace foundation; Built as double wide manufactured home
- Exterior features: Enclosed porch; Porch; Awnings; Exterior lighting; Shed on property; Landscaped with trees; Level lot; Sidewalks; Paved surfaces; Near public transit; Private maintained road; Asphalt road surface
Interior
- Kitchen: Range; Refrigerator; Electric water heater
- Bedrooms: 2 bedrooms
- Flooring: Carpet; Laminate
- Bathrooms: 2 full bathrooms
- Heating & cooling: Central heating; Baseboard heating; Central air conditioning
- Interior features: Ceiling fans; Window treatments
- Laundry & utility: Washer; Dryer; Laundry located outside
Neighborhood map
What this means for you Summary
Snapshot
- This is a 2-bed/2.0-bath manufactured listed at $143k.
Deal economics
- At list price, monthly cash flow is $277 ($3k/yr) — positive.
- The deal already cash-flows at list — no discount required.
- Meets the 1% rule at list price ($2k rent vs $143k).
- Recommended offer: $130k (9.0% below list) — sets the bar for market timing.
- Cap rate 8.6% vs local median 4.7% in Elfers — top-decile yield for the area; either an underpriced asset or a hidden risk that comps aren't pricing in. Stress-test before assuming the spread holds.
Location & tenants
- Location reads 78/100 on livability (#167 in FL, #2,486 nationally) — a middle-class / working-renter tenant base. Strengths: cost of living A+, housing A+, health & safety A+; Watch: crime C-, employment D+, amenities D-.
- Pasco (suburban): math 50% / reading 52% proficiency, ranked #32 of 73 in FL (top 44%) — acceptable for families but not a draw, mixed tenant base, ~2y average lease.
- Market conditions: Rents soft (-2.5%/yr); 134 active listings in the ZIP; 40 comparable units currently listed for rent nearby; rentals at typical pace (median 18d on market — plan ~3-4 weeks tenant-placement turnaround); 6,765 units permitted in Pasco County in 2024 (1,250 in 5+ unit buildings).
- This rent runs 39% of the median local income ($49k/yr) — at the standard rent-burdened threshold; future hikes will face affordability resistance.
Forward outlook
- Local home prices are declining (-3.0%/yr); year-one equity from $988 of loan paydown is wiped out by about $4k of value loss. Plan a longer hold.
- Pasco County population projected at +29% by 2050 — long-run rental-demand tailwind backs the buy-and-hold thesis.
Negotiation context
- It's been on market 99 days — a 9% lower offer ($130k) is reasonable based on typical stale-listing flexibility.
- Current owner paid $41k; list at $143k implies a 249% gain — meaningful room to come down on a strong offer.
Risks & watch-outs
- Climate carrying-cost: moderate flood risk; severe wind risk, 99% chance of damaging wind over 30y; extreme-heat days projected 7→27/yr by 2055 (HVAC capex compounding) — expect insurance premiums to compound above CPI over the hold.
Questions for the listing agent
- It's been on market 99 days. Have you received any prior offers? Is the seller open to a 9% concession, seller financing, or rate buy-down credit?
- Built in 1979 — when were the roof, HVAC, electrical panel, plumbing, and water heater last replaced?
- What does the HOA fee cover, when was the last increase, and are there any pending special assessments or reserve-fund shortfalls?
- Why hasn't it sold? Are there any deal-killer items the seller is aware of (foundation, flood, title, zoning, code violations)?
- Is there a deadline driving the sale (1031 exchange, divorce, estate, relocation)? That informs how much negotiation room exists.
- What's the average days-on-market for RENTAL listings here right now (not sales)? A rising rental-DOM trend means longer vacancies and softer asking-rent achievability than the comps imply.
- What's the recent tenant-quality profile in this submarket — average credit score on applications, eviction rate, late-payment / NSF rate, and stable-employment percentage? A property-management company in the area should have these aggregated.
- How much new for-sale + rental construction is in the pipeline within 1–3 miles? Heavy new supply typically softens prices + rents 12–24 months out; constrained supply supports both.
Investment metrics
- 1% rule
- 1.13% ✓
- Cap rate
- 8.62%
- Cash-on-cash
- 8.32%
- DSCR
- 1.37
- GRM
- 7.4
CMA / ARV
- ARV (on-the-fly)
- $141,120
- Comps found
- 11
Show comp detail 11 sales within ~0.75 mi
| Address | Dist | Beds/Ba | Sqft | Sold | Price | $/sf | Match |
|---|---|---|---|---|---|---|---|
| 3301 Chatford Dr | 0.04mi | 2/2.0 | 960 (0%) | 2mo | $145,000 | $151 | 97 |
| 3115 Bixler Ct | 0.17mi | 2/2.0 | 960 (0%) | 2mo | $87,000 | $91 | 90 |
| 3126 Birkdale Dr | 0.19mi | 2/2.0 | 936 (-2%) | 9mo | $152,400 | $163 | 79 |
| 3200 Birkdale Dr | 0.16mi | 2/2.0 | 960 (0%) | 17mo | $140,000 | $146 | 78 |
| 4735 Burney Dr | 0.07mi | 2/2.0 | 896 (-7%) | 13mo | $135,000 | $151 | 75 |
| 4720 Burney Dr | 0.10mi | 3/2.0 (+1) | 1,065 (+11%) | 1mo | $135,000 | $127 | 72 |
| 4715 Burney Dr | 0.10mi | 2/2.0 | 864 (-10%) | 12mo | $132,000 | $153 | 69 |
| 3414 Chatford Dr | 0.14mi | 2/2.0 | 1,056 (+10%) | 12mo | $85,000 | $80 | 66 |
| 3330 Chatford Dr | 0.09mi | 2/2.0 | 840 (-12%) | 13mo | $113,000 | $135 | 64 |
| 4920 Sherrell Dr | 0.16mi | 2/2.0 | 864 (-10%) | 18mo | $127,000 | $147 | 61 |
| 3035 Buckner Ct | 0.25mi | 2/2.0 | 1,056 (+10%) | 18mo | $193,000 | $183 | 56 |
Match score weights: distance 35% · size 25% · config 20% · recency 20%. Top-matched comps best support the ARV.
Projected returns pro-forma
-3.0% appreciation · 0.0% rent growth · sell at horizon
- IRR
- -7.1%
- Equity multiple
- 0.75×
- Total profit
- $-10,199
- Equity at exit
- $21,307
- IRR
- -1.8%
- Equity multiple
- 0.89×
- Total profit
- $-4,310
- Equity at exit
- $12,355
Cash invested: $40,012 (down + closing). Projections, not guarantees.
Landlord ↔ Tenant lean methodology
- Overall (STATE)
- 87 Strongly Landlord-Friendly
- State Florida
- 87 Strongly Landlord-Friendly · R+3
- County
- — inherits STATE
- City
- — inherits STATE
ZIP-level market 34690
- Home prices YoY
- -22.4%
- Rents YoY
- -2.5%
- Active inventory
- 134
- Price-to-rent
- 7.4×
Monthly cashflow live
- Estimated rent
- $1,615 high interval (Pro) →
- Mortgage (P&I)
- −$749
- Tax from tax record
- −$47 /mo · $563/yr
- Insurance
- −$60
- HOA
- −$143
- Vacancy / Maint / Mgmt
- −$339
- Net cashflow
- $277
Break-even live
Sensitivity live
| Price | -10% $358 | -5% $318 | +0% $277 | +5% $237 | +10% $196 |
|---|---|---|---|---|---|
| Rent | -10% $150 | -5% $213 | +0% $277 | +5% $341 | +10% $405 |
| Rate | -1.0pp $349 | -0.5pp $314 | base $277 | +0.5pp $240 | +1.0pp $203 |
UW: 25.0% down · 7.5% · 30yr · 1.5% tax · 5.0% vac · 8.0% maint · 8.0% mgmt
Financing live
Cash to close
- Down payment
- $35,725
- Closing costs
- $4,287
- Reserves months
- —
- Total cash needed
- —
Loan-product check · same deal, 3 products live
Conventional
25% down · 7.5% · 30yr
- Down + closing
- —
- Monthly P&I
- —
- Monthly cashflow
- —
- DSCR
- —
- Eligible?
- —
Personal DTI + credit; lowest rate.
DSCR
20% down · 8.5% · 30yr
- Down + closing
- —
- Monthly P&I
- —
- Monthly cashflow
- —
- DSCR
- —
- Eligible?
- —
No personal income docs; deal must DSCR.
Hard money
10% down · 12.0% · 12mo
- Down + closing
- —
- Monthly P&I
- —
- Monthly cashflow
- —
- DSCR
- —
- Eligible?
- —
Short-term bridge; refi at stabilization.
Rent comps 40 comps
| Address | Beds | Baths | Sqft | Rent | $/sqft | DOM | Units | Dist |
|---|---|---|---|---|---|---|---|---|
| 3433 Monticello St Holiday, FL | 3.0 | 1.5 | 960 | $1,650 | $1.72 | 25d | 1 | 0.15mi |
| 3511 Cambridge St New Port Richey, FL | 2.0 | 2.0 | 936 | $2,100 | $2.24 | 6d | 1 | 0.25mi |
| 3421 Tricon Ln #12 Holiday, FL | 2.0 | 1.0 | 870 | $1,095 | $1.26 | 0d | 1 | 0.40mi |
| 5232 Sparrow Dr Holiday, FL | 2.0 | 1.0 | 976 | $1,975 | $2.02 | 25d | 1 | 0.47mi |
| 4723 Aegean Ave Holiday, FL | 2.0 | 1.0 | 1000 | $1,636 | $1.64 | 6d | 1 | 0.63mi |
| 4348 Plaza Dr Holiday, FL | 1.0–2.0 | 1.0–2.0 | 860 | $1,499 | $1.74 | 0d | 7 | 0.66mi |
| 3439 Clydesdale Dr Holiday, FL | 2.0 | 1.0 | 968 | $1,395 | $1.44 | 6d | 1 | 0.69mi |
| 2610 Templewood Dr Holiday, FL | 3.0 | 1.0 | 1056 | $1,800 | $1.70 | 6d | 1 | 0.69mi |
| 2552 Chancery Dr Holiday, FL | 2.0 | 1.0 | 816 | $1,595 | $1.95 | 25d | 1 | 0.72mi |
| 4205 Jordana Way Holiday, FL | 1.0–3.0 | 1.0–2.0 | 1027 | $1,404 | $1.37 | 3d | 13 | 0.74mi |
| 3029 Corona Dr Holiday, FL | 3.0 | 2.0 | 894 | $1,950 | $2.18 | 6d | 1 | 0.79mi |
| 2509 Sweetwood Dr Holiday, FL | 2.0 | 1.0 | 988 | $1,650 | $1.67 | 18d | 1 | 0.80mi |
| 4124 Flamingo Dr New Port Richey, FL | 3.0 | 1.0 | 744 | $1,500 | $2.02 | 15d | 1 | 0.84mi |
| 4124 Flamingo Dr New Port Richey, FL | 3.0 | 1.0 | 744 | $1,500 | $2.02 | 4d | 1 | 0.84mi |
| 5606 Mirada Dr Holiday, FL | 2.0 | 1.0 | 864 | $1,550 | $1.79 | 15d | 1 | 0.86mi |
| 4133 Grayton Dr New Port Richey, FL | 2.0 | 1.5 | 1068 | $1,727 | $1.62 | 6d | 1 | 0.88mi |
| 5020 Vickers Dr New Port Richey, FL | 2.0 | 1.0 | 863 | $1,495 | $1.73 | 0d | 1 | 0.90mi |
| 4358 Tahitian Gardens Cir Holiday, FL | 1.0 | 1.0 | 600 | $1,350 | $2.25 | 15d | 1 | 0.97mi |
| 4358 Tahitian Gardens Cir Unit G Holiday, FL | 1.0 | 1.0 | 600 | $1,350 | $2.25 | 25d | 1 | 0.97mi |
| 4823 Longwood Ave Holiday, FL | 3.0 | 1.0 | 1122 | $1,800 | $1.60 | 6d | 1 | 0.98mi |
| 4365 Tahitian Gardens Cir Unit C Holiday, FL | 2.0 | 1.0 | 825 | $1,300 | $1.58 | 0d | 1 | 0.99mi |
| 4356 Tahitian Gardens Cir Unit C Holiday, FL | 2.0 | 1.0 | 825 | $1,350 | $1.64 | 25d | 1 | 0.99mi |
| 4354 Tahitian Gardens Cir Unit F Holiday, FL | 2.0 | 1.0 | 825 | $1,500 | $1.82 | 25d | 1 | 1.01mi |
| 4209 Touchton Pl New Port Richey, FL | 1.0 | 1.0 | 624 | $1,300 | $2.08 | 17d | 1 | 1.02mi |
| 4221 Touchton Pl New Port Richey, FL | 2.0 | 2.0 | 888 | $1,300 | $1.46 | 24d | 1 | 1.03mi |
| 3516 Sheryl Hill Dr Holiday, FL | 2.0 | 2.0 | 848 | $1,595 | $1.88 | 25d | 1 | 1.04mi |
| 4318 Tahitian Gardens Cir Unit B Holiday, FL | 1.0 | 1.0 | 576 | $1,200 | $2.08 | 25d | 1 | 1.05mi |
| 4351 Tahitian Gardens Cir Holiday, FL | 2.0 | 1.0 | 825 | $1,150 | $1.39 | 25d | 1 | 1.06mi |
| 4313 Tahitian Gardens Cir Unit C Holiday, FL | 2.0 | 1.5 | 825 | $1,300 | $1.58 | 15d | 1 | 1.07mi |
| 4326 Tahitian Gardens Cir Unit 14E Holiday, FL | 2.0 | 1.5 | 768 | $2,000 | $2.60 | 25d | 1 | 1.14mi |
| 4337 Tahitian Gardens Cir Unit F Holiday, FL | 2.0 | 1.0 | 768 | $1,500 | $1.95 | 25d | 1 | 1.17mi |
| 2122 Ranchita Trl Holiday, FL | 2.0 | 1.0 | 648 | $1,399 | $2.16 | 25d | 1 | 1.18mi |
| 3445 Wiltshire Dr Holiday, FL | 2.0 | 1.5 | 992 | $1,450 | $1.46 | 22d | 1 | 1.18mi |
| 2117 Calusa Trl Unit B Holiday, FL | 1.0 | 1.0 | 708 | $1,200 | $1.69 | 6d | 1 | 1.20mi |
| 4408 Rustic Dr New Port Richey, FL | 2.0 | 1.0 | 1101 | $1,500 | $1.36 | 25d | 1 | 1.20mi |
| 4211 Hampton Dr New Port Richey, FL | 2.0 | 2.0 | 1050 | $1,795 | $1.71 | 6d | 1 | 1.20mi |
| 4334 Tahitian Gardens Cir Unit C Holiday, FL | 2.0 | 1.0 | 768 | $1,450 | $1.89 | 25d | 1 | 1.22mi |
| 4411 Rustic Dr Unit 1 New Port Richey, FL | 2.0 | 2.0 | 1050 | $1,450 | $1.38 | 13d | 1 | 1.23mi |
| 3612 Springfield Dr Holiday, FL | 2.0 | 1.5 | 1040 | $1,450 | $1.39 | 18d | 1 | 1.23mi |
| 2132 Kepner Dr Holiday, FL | 2.0 | 1.0 | 920 | $1,295 | $1.41 | 21d | 1 | 1.27mi |
HOA detail
- Monthly dues
- $143 · $1,716/yr
- Likely covers
- trashpool
Listing history 15 events
-
2026-06-18days on market $142,900 Active 99 DOM
-
2026-06-17days on market $142,900 Active 98 DOM
-
2026-06-16days on market $142,900 Active 97 DOM
-
2026-06-15days on market $142,900 Active 96 DOM
-
2026-06-13days on market $142,900 Active 94 DOM
-
2026-06-09days on market $142,900 Active 90 DOM
-
2026-06-08days on market $142,900 Active 89 DOM
-
2026-06-07days on market $142,900 Active 88 DOM
-
2026-06-04days on market $142,900 Active 85 DOM
-
2026-06-03days on market $142,900 Active 84 DOM
-
2026-06-02days on market $142,900 Active 83 DOM
-
2026-06-01days on market $142,900 Active 82 DOM
-
2026-05-31days on market $142,900 Active 81 DOM
-
2026-03-11$142,900 Active
-
2001-05-14soldstatus $41,000
ⓘ Source: listings_history table (triggers on properties + properties_extension) + one-shot
backfill from property_details.listing_events for pre-trigger history.
Tax reassessment forecast FL · Resets to sale price
- Current annual tax
- $563 · $47/mo
- Projected year-2 tax
- $1,186 · $99/mo
- Expected delta
- +$623/yr (+$52/mo · 110.5%)
ⓘ Screening estimate from a state-policy table — verify with the county assessor before closing.
Climate risk First Street
- Flood 5/10 Major FEMA zone X (shaded) · 24% chance over 30 yrs
- Wildfire 3/10 Moderate
- Heat 10/10 Extreme 7 d/yr ≥109°F today · 27 d/yr by 30 yrs out
- Wind 10/10 Extreme 99% chance of damaging wind over 30 yrs
- Air quality 2/10 Low 1 unhealthy d/yr today · 1 by 30 yrs out
Nearby sold comps map
Loading sold comps map…
Walkable amenities ~0.75 mi
Loading nearby amenities…
Taxation est. · year 1
- Rental income
- $19,385
- − Mortgage interest
- −$8,005
- − Property taxes
- −$563
- − Insurance
- −$714
- − Repairs & maintenance
- −$1,551
- − Management
- −$1,551
- − HOA
- −$1,716
- − Depreciation
- −$4,157
- Taxable income
- $1,127
- Est. tax owed @ 24.0%
- −$271
- After-tax cash flow
- $3,057/yr
For passive investors: Depreciation is non-cash, so a rental often shows a tax loss while cash-flowing — sheltering income. Rental losses are passive: they offset passive income freely, and up to $25,000/yr can offset ordinary (W-2) income if you actively participate and your MAGI is under $100k (phasing out to $0 by $150k); unused losses carry forward. On sale, claimed depreciation is recaptured at up to 25%, and gains may owe capital-gains tax (a 1031 exchange can defer both). Figures are a year-1 estimate at your 24.0% rate — not tax advice; consult a CPA.
Schools (NCES district)
- District
- Pasco
- NCES district ID
- 1201530
- Math proficiency
- 50% ▼ -10.00%
- Reading proficiency
- 52% ▼ -5.00%
- Median HH income
- $45,039
- Composite
- 43.14/100
- National rank
- #3074
- State rank
- #32 of 73 in FL
Livability — Elfers
- Score
- 78/100
- State rank
- #167
- US rank
- #2486
Category grades
Schools grade is shown separately in the Schools card above.
Census & demographics
- Census place
- Elfers, FL
- County
- Pasco County · 524,098 people
- Metro
- Tampa-St. Petersburg-Clearwater, FL
- Population (ZIP)
- 12,498
- Household income
- $49,401
- Rent vs Own
- Severe rent burden
- 625.0
Population outlook (Pasco County) Hauer SSP2
- Today (2025)
- 570,045 people
- By 2030
- 605,844 · +6.3%
- By 2040
- 674,806 · +18.4%
- By 2050
- 736,022 · +29.1%
- By 2075
- 862,900 · +51.4%
- By 2100
- 906,364 · +59.0%
Race, ethnicity, and origin ACS 2023
- Neighborhood character
- Predominantly White (70%)
- Race & ethnicity
- White 70% Hispanic / Latino 21% Two or more races 11% Black 5% Native American 2% Asian 1%
- Hispanic origin (detail)
- Mexican 4% Puerto Rican 7% Cuban 3% Dominican 2%
- Common ancestry
- Lithuanian 3% Romanian 2% Slovak 1%
- Foreign-born
- 12% · Canada, Jamaica, Vietnam
- Languages at home
- 78% English-only · Spanish 16% Arabic 2% Other Indo-European 2%
Political lean MEDSL · Pasco
- 2024 margin
- Strong R (+25.2) · D 36.9% · R 62.1% · Other 1.0%
- 2008→2024 swing
- -21.6pp toward R · 2008: -3.6pp · 2024: -25.2pp
- All cycles
- 2024: R+25.2 2020: R+20.1 2016: R+21.6 2012: R+6.7 2008: R+3.6
Not yet ingested
- Civics
- —
Market trends
- HPI YoY
- ▼ -91.40%
- Current HPI
- 316.5846
- Rent YoY
- ▼ -2.49%
- Metro
- Tampa-St. Petersburg-Clearwater, FL
- State GDP YoY
- ▲ 3.28%
- F500 in state
- 36
Industry mix (Fortune 500 HQ in FL)
| Industry | F500 HQs | Revenue |
|---|---|---|
| Industrial Technology | 2 | $29B |
|
||
| Insurance | 2 | $17B |
|
||
| Retail | 1 | $60B |
|
||
| Technology Distribution | 1 | $58B |
|
||
| Homebuilding | 1 | $35B |
|
||
| Technology Manufacturing | 1 | $35B |
|
||
Price history
+248.5% since first listed2 events — show timeline
- 2026-03-11 Listed $142,900 Stellar MLS as Distributed by MLS Grid
- 2001-05-14 Sold (Public Records) $41,000 Public Records
Property tax history
+4.8%/yrLatest (2025): $563 · +4.9% YoY. Source: county tax records.
Cash-flow waterfall
monthlySold comps — $/sqft
last 12 mo · ≤1 miLoading sold comps…